


Bitcoin vs Gold Forecast: BTC and XAU extend slide as hawkish Fed expectations weigh
- Bitcoin ticks lower for the third straight day as odds of an extended correction below $60,000 rise.
- Gold’s downtrend persists below $3,600, with the trading pair testing 14-month lows around $3,515.
- Market participants price in 95% odds that the Fed will hike interest rates in December as headwinds intensify.
Bitcoin (BTC) is trading under pressure below $62,000 on Friday, weighed down by broader risk-off sentiment in the crypto market. Attempts by the bulls to stage a recovery have repeatedly failed to gain traction, leaving BTC susceptible to mounting headwinds.
Gold (XAU/USD) is similarly in bearish hands, though it is moderating around $3,560 after testing 14-month lows at $3,515. Both Bitcoin and Gold’s technical outlook reflects weak market sentiment, as investors sit on the sidelines ahead of the crucial interest rate decision in December.
Rate hike odds remain elevated
Derivatives traders are currently pricing in 95% odds that the Federal Reserve (Fed) will hike interest rates to the 4.00-4.25% range in December. These expectations come amid sticky inflation in the United States (US), worsened by persistent geopolitical tensions in the Middle East, which have kept Oil and energy prices elevated.
The central bank, meanwhile, is struggling with its dual mandate to support maximum employment and stabilize the economy; hence the need to bring inflation down to the 2% long-term target.
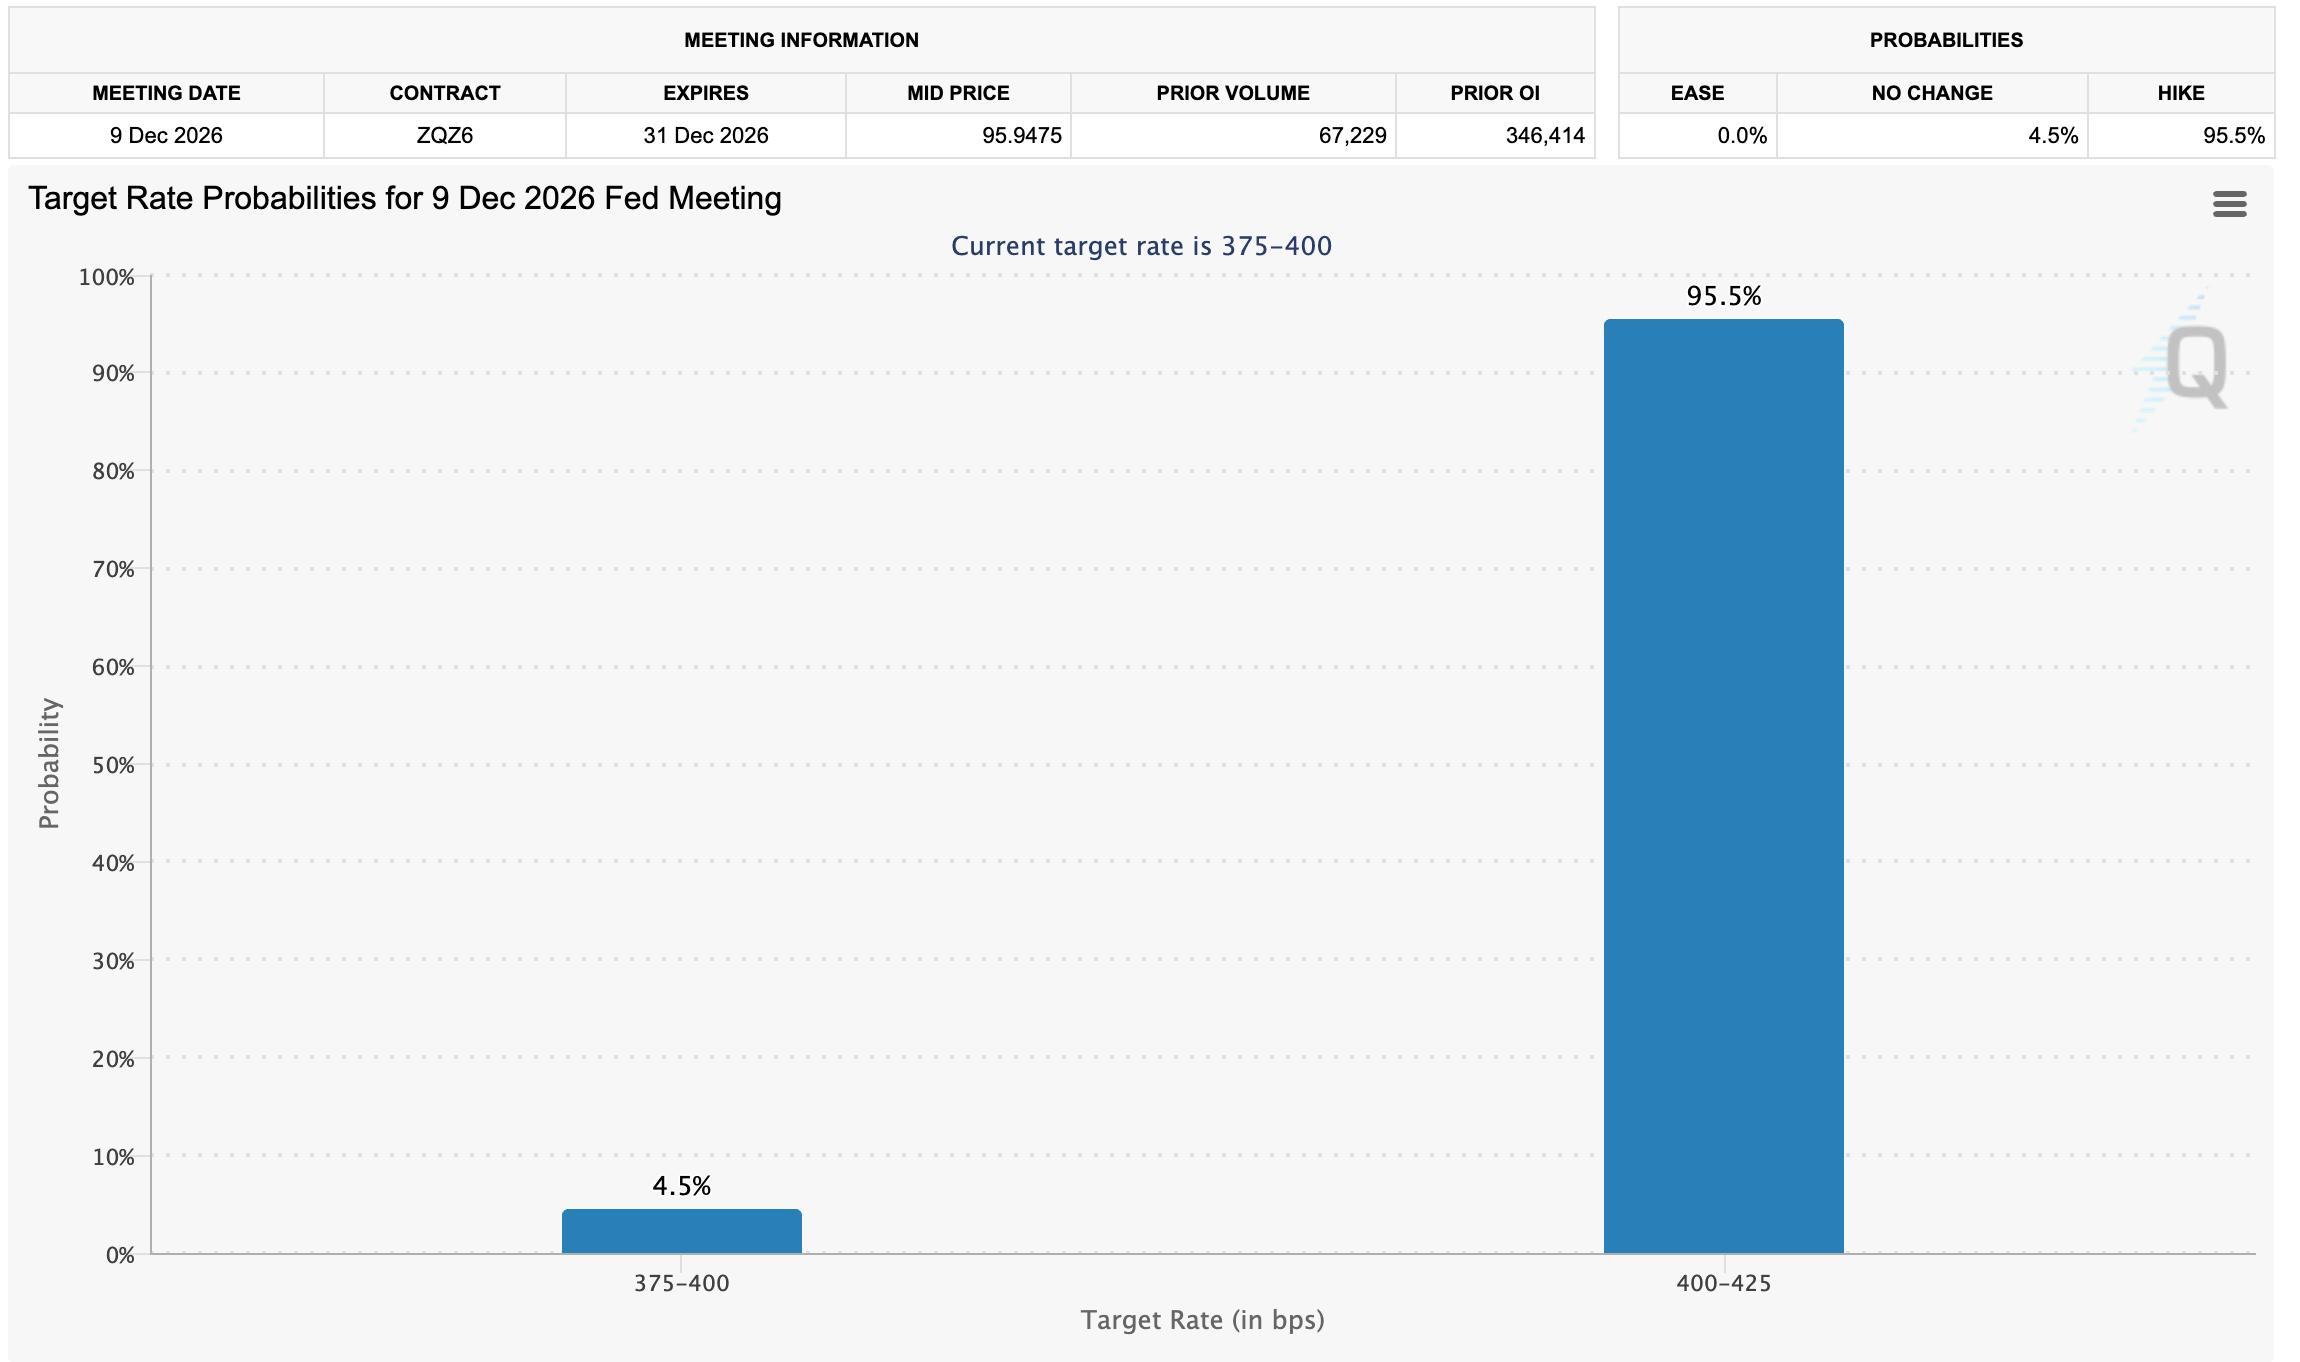
A stricter monetary policy at a time when ten-year US Treasury yields remain above 5% could drive liquidity out of risk assets, especially crypto and into more stable, government-backed investments.
“Markets are now pricing an approximately 96% probability of a 25-basis-point Fed hike in December,” Crypt Finance said in an emailed analysis report, adding, “The US Dollar (USD) has strengthened accordingly, with the DXY near a 19-month high around 103.9. Meanwhile, the US 10-year Treasury yield declined roughly 13 basis points this week toward 5.0%, supported by safe-haven demand amid the equity selloff.”
Bitcoin spot Exchange Traded Funds (ETFs) are facing persistent withdrawals, with outflows amounting to $1.12 billion through Thursday, according to SoSoValue.
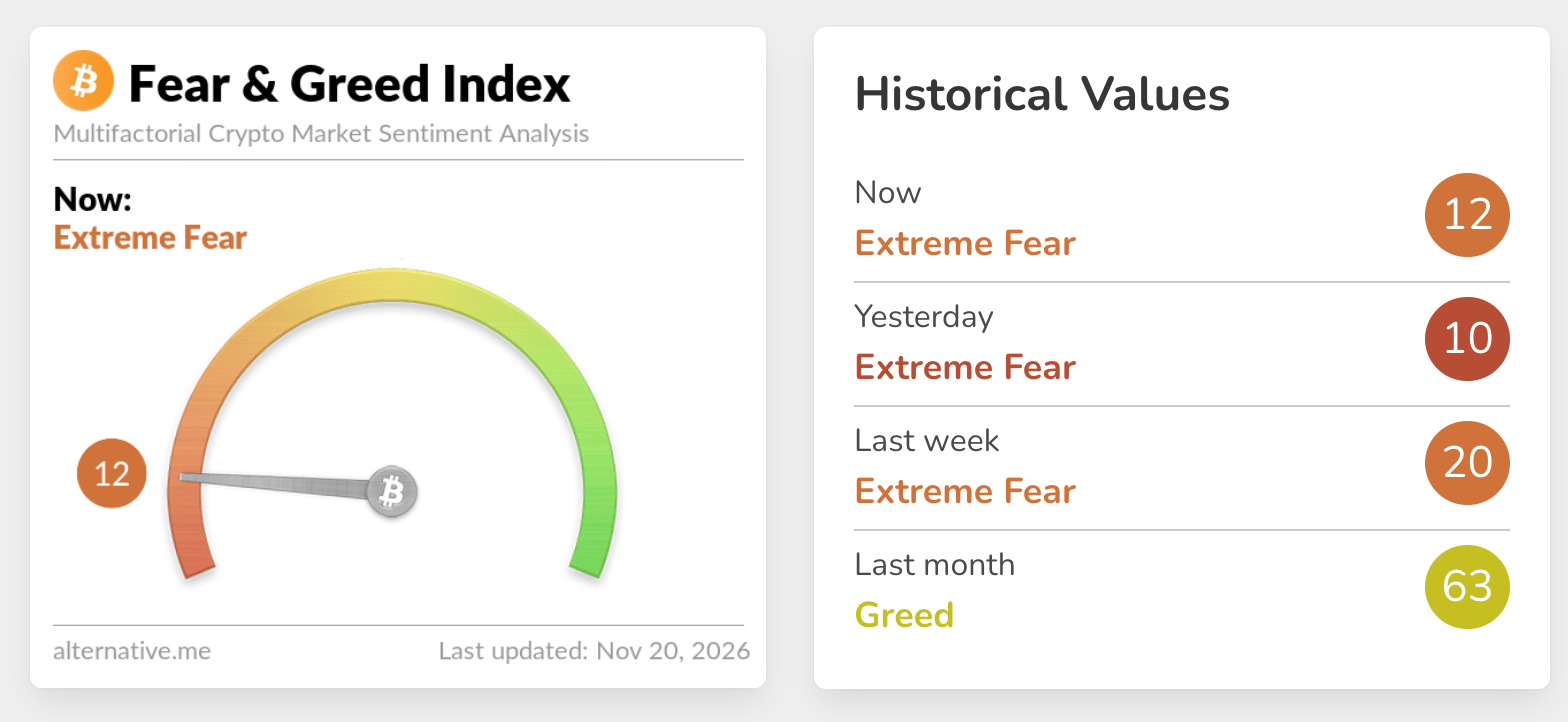
The Fear & Greed Index was at 12 in the Extreme Fear territory on Friday, up only slightly from 10 in the same range the day before, which reaffirms that appetite for crypto assets is significantly low. This suggests subdued demand and a weak tailwind for a recovery.
Technical analysis: Bitcoin accelerates downward momentum
Bitcoin trades at $61,471, extending its retreat well below the short and medium-term Exponential Moving Averages (EMAs) and preserving a bearish near-term bias. The 50-day EMA at $74,640, the 100-day EMA at $75,418 and the 200-day EMA at $75,881 all sit well overhead, suggesting rallies are likely to meet supply rather than trend support, while the SuperTrend line at $69,730 reinforces this broad cap on the upside.
Momentum remains weak, with the Moving Average Convergence Divergence (MACD) indicator embedded in negative territory and the Relative Strength Index (RSI) around 20, hinting at oversold conditions but not yet translating into a meaningful recovery.
Initial resistance is defined by the SuperTrend barrier near $69,730, and a break above this area would expose clustered dynamic resistance from the 50-day EMA at $74,640 to the 100-day and 200-day EMAs at $75,418 and $75,881, respectively. With no nearby technical support evident from the available indicators on the daily chart, the pair remains vulnerable to further downside extensions below $60,000 while it trades beneath this dense resistance band, and any rebound is likely to be viewed as corrective so long as price holds under the $69,730 level.
Technical analysis: Gold correction deepens
Gold trades at $3,567, extending a bearish phase with price entrenched well below its key moving averages. The 50-day EMA around $4,050, the 100-day EMA near $4,164 and the 200-day EMA close to $4,221 all sit overhead, suggesting a firmly capped market where bounces are likely to struggle.
Momentum remains heavy, with the MACD deep in negative territory and the RSI slipping into oversold conditions near 25, hinting that while the downtrend dominates, the risk of short-lived corrective rebounds is rising.
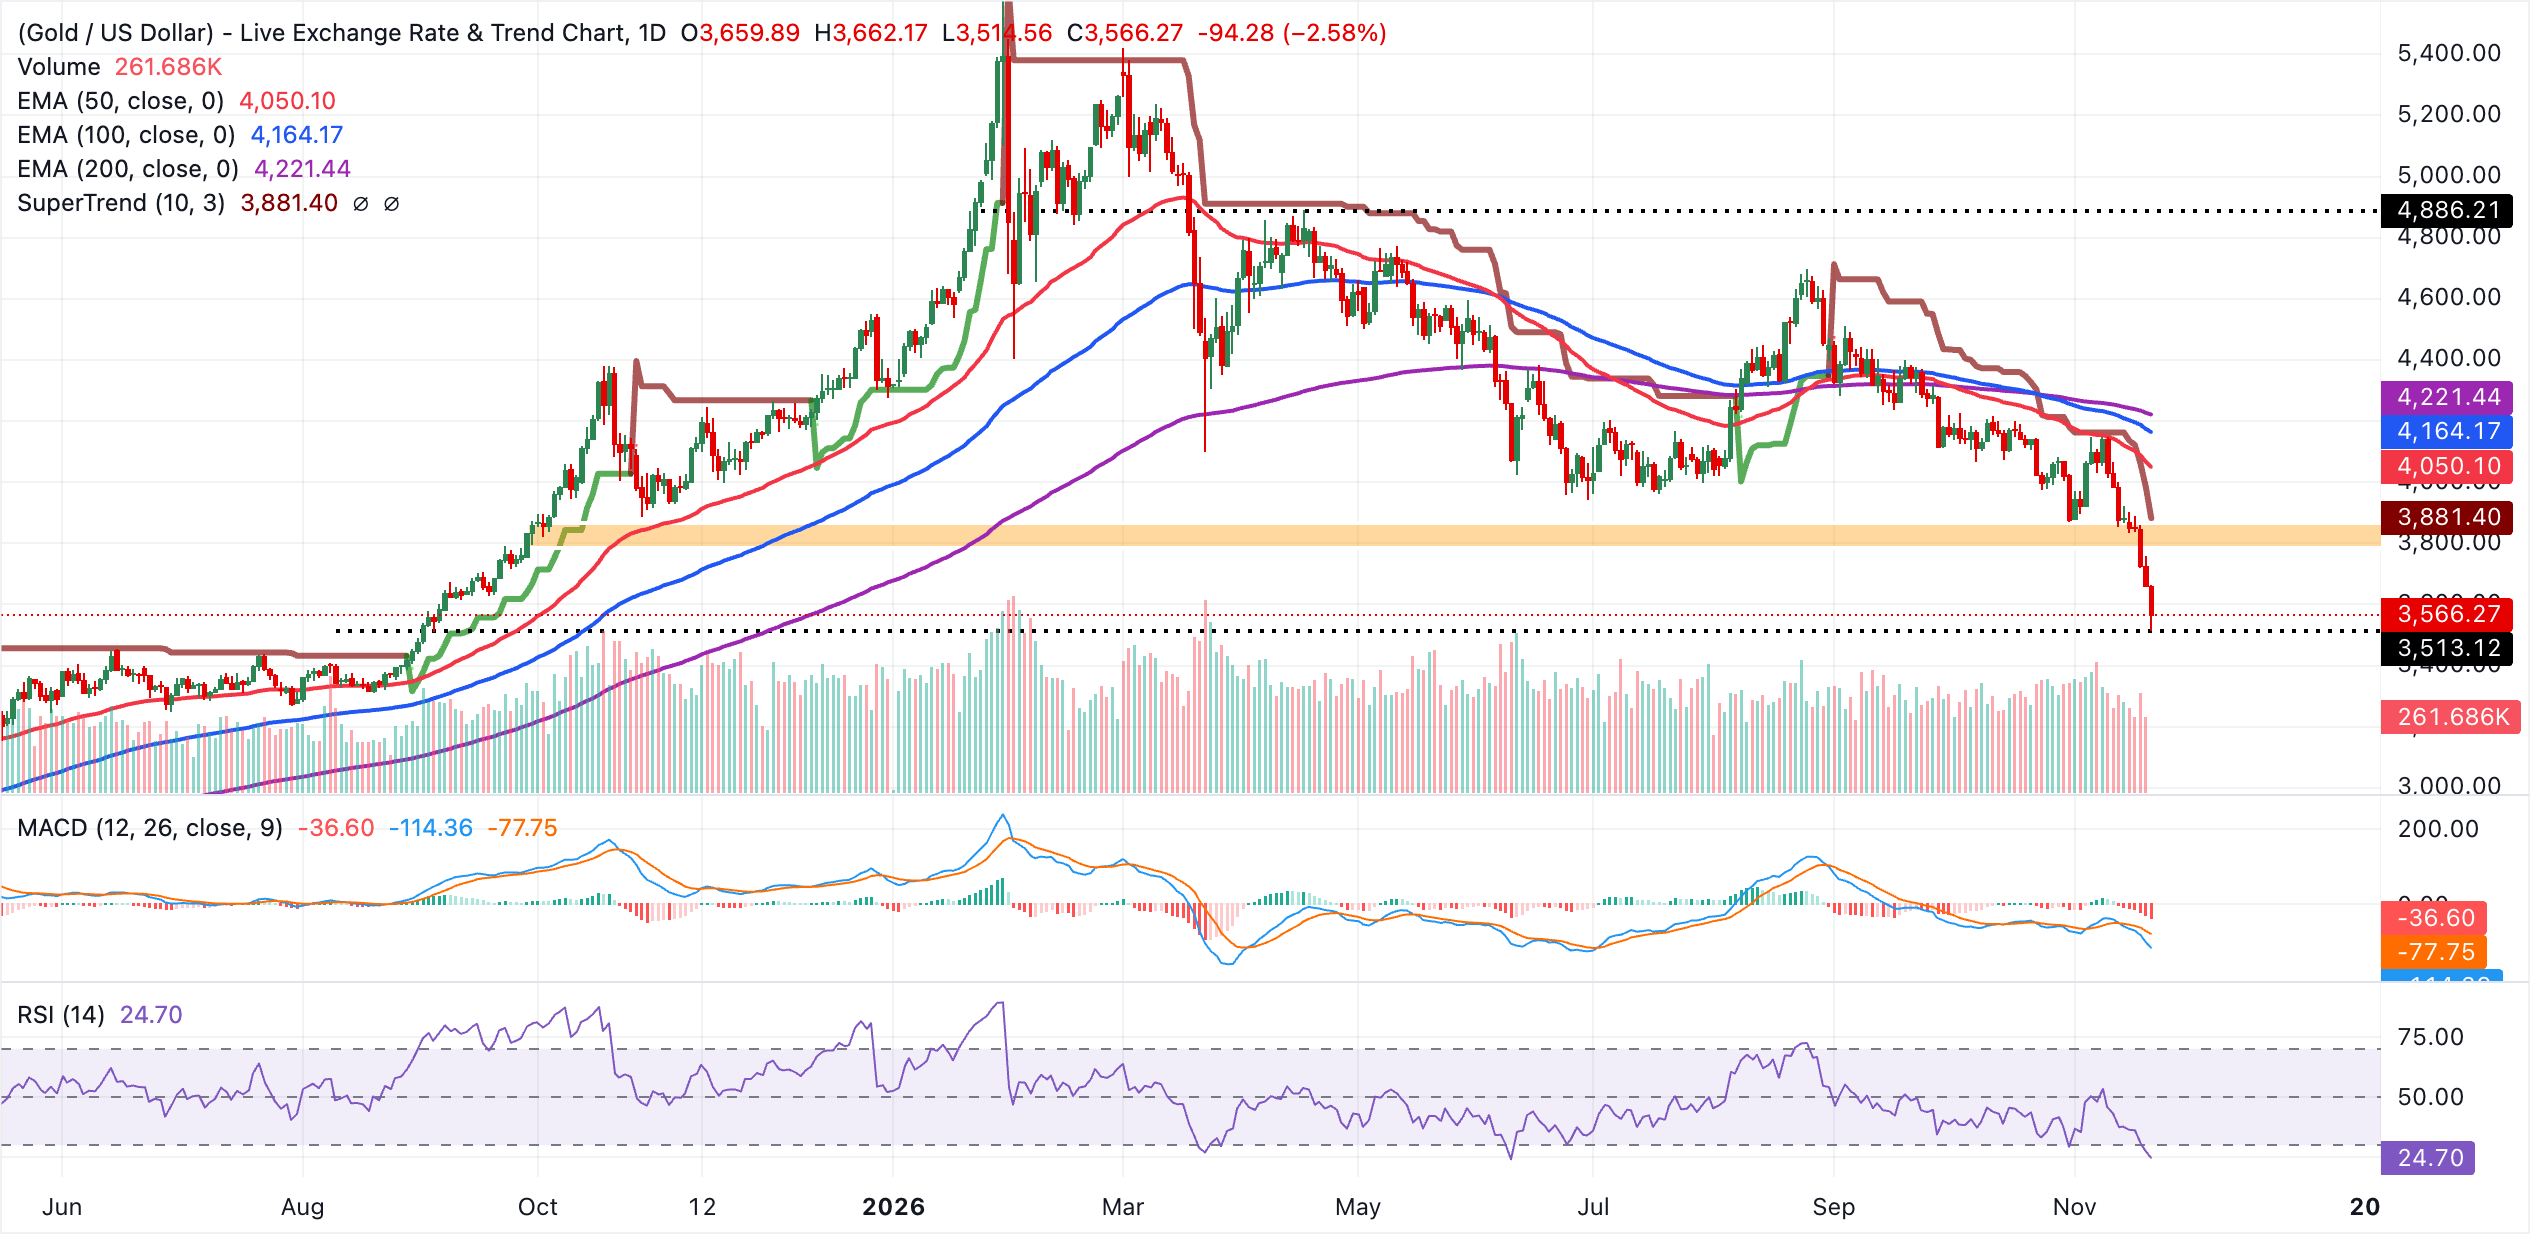
Initial resistance lies at the SuperTrend line near $3,881, ahead of the 50-day EMA at about $4,050, where stronger selling interest could re-emerge. Further up, the 100-day EMA at roughly $4,164 and the 200-day EMA around $4,221 form a broader resistance band that would need to be reclaimed to ease the prevailing bearish bias.
With no clear nearby structural support levels from the indicators on the daily chart, XAU/USD remains vulnerable to further downside until buyers can establish a floor and force a sustained recovery above at least the first EMA barrier.
(The technical analysis of this story was written with the help of an AI tool. Know more.)
Bitcoin, altcoins, stablecoins FAQs
Bitcoin is the largest cryptocurrency by market capitalization, a virtual currency designed to serve as money. This form of payment cannot be controlled by any one person, group, or entity, which eliminates the need for third-party participation during financial transactions.
Altcoins are any cryptocurrency apart from Bitcoin, but some also regard Ethereum as a non-altcoin because it is from these two cryptocurrencies that forking happens. If this is true, then Litecoin is the first altcoin, forked from the Bitcoin protocol and, therefore, an “improved” version of it.
Stablecoins are cryptocurrencies designed to have a stable price, with their value backed by a reserve of the asset it represents. To achieve this, the value of any one stablecoin is pegged to a commodity or financial instrument, such as the US Dollar (USD), with its supply regulated by an algorithm or demand. The main goal of stablecoins is to provide an on/off-ramp for investors willing to trade and invest in cryptocurrencies. Stablecoins also allow investors to store value since cryptocurrencies, in general, are subject to volatility.
Bitcoin dominance is the ratio of Bitcoin's market capitalization to the total market capitalization of all cryptocurrencies combined. It provides a clear picture of Bitcoin’s interest among investors. A high BTC dominance typically happens before and during a bull run, in which investors resort to investing in relatively stable and high market capitalization cryptocurrency like Bitcoin. A drop in BTC dominance usually means that investors are moving their capital and/or profits to altcoins in a quest for higher returns, which usually triggers an explosion of altcoin rallies.
추천 기사


