


Crypto Today: Bitcoin and Ethereum consolidate, XRP dips as optimism for a US-Iran deal fades
- Bitcoin holds above the short-term $64,000 support as hopes for a potential US-Iran deal dim.
- Ethereum trades broadly sideways, with the 50-day EMA providing immediate support.
- XRP is testing the critical $1.00 support level, weighed down by deteriorating momentum indicators.
Bitcoin (BTC) maintains a neutral outlook on Tuesday while testing support at $64,000. Investors appear to be sitting on the fence, awaiting a catalyst for a breakout above $65,000. Ethereum (ETH) follows in Bitcoin’s footsteps, trading below $1,900 while anchored above the $1,800 demand zone.
Meanwhile, Ripple (XRP) remains pressured toward the $1.00 critical support level. This marks the third consecutive day of declines, undermining the token’s broader technical structure.
Fading US-Iran deal hopes weigh on crypto sentiment
Iran said on Monday that a potential agreement with Oman to manage commercial shipping through the Strait of Hormuz would not be sufficient to fully reopen the strategic waterway unless the United States (US) meets a series of conditions.
In response to Tehran's demand for compensation from Washington, US President Donald Trump asserted that the US would, in turn, seek reparations from Iran for American casualties.
Trump claimed in a pre-recorded interview with media outlet Real America's Voice that Iran’s economic situation is not sustainable.
“So economically, they are a mess. They can't borrow money. We control their money, what they had, which is a lot. They had a lot, and we have total control of it. I'm their banker," Trump said.
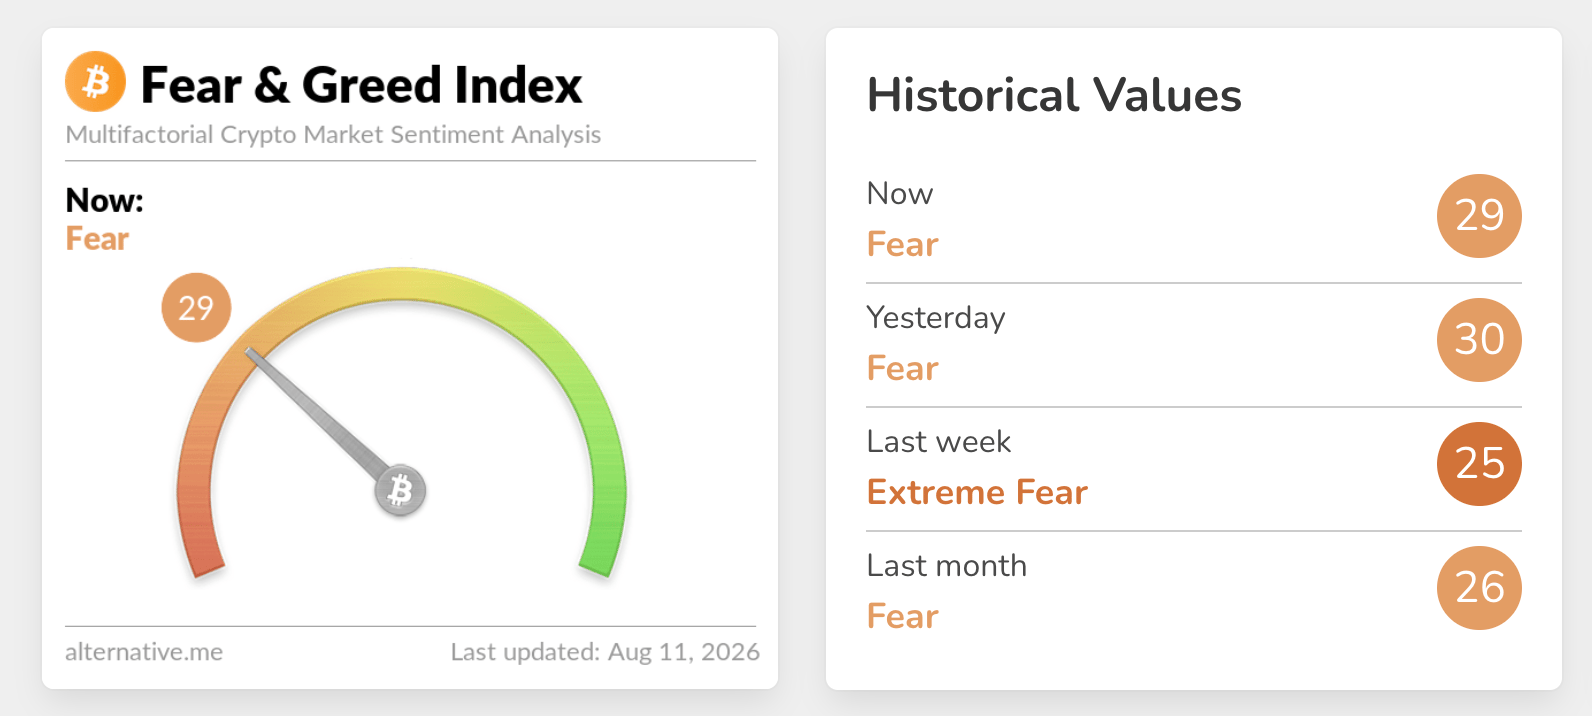
Risk appetite remains lethargic as reflected in the crypto Fear & Greed Index. The index is embedded in the Fear territory at 29 on Tuesday, down slightly from 30 the previous day. If risk appetite continues to weaken, subdued demand for digital assets is likely to limit any recovery, increasing the probability of a broader market correction.
Technical Analysis: Bitcoin bulls defend short-term support
Bitcoin trades at $64,116, keeping a capped tone as it holds below the key Exponential Moving Averages (EMAs). The spot price remains under the 50-day EMA at $64,633, with the 100-day EMA at $66,837 and the 200-day EMA at $72,804 stacked overhead, collectively suggesting the broader trend remains under pressure despite the latest stabilization.
The Moving Average Convergence Divergence (MACD) indicator is marginally positive near the zero line, while the Relative Strength Index (RSI) at 49 sits in neutral territory, hinting at a lack of strong directional momentum rather than a decisive reversal.
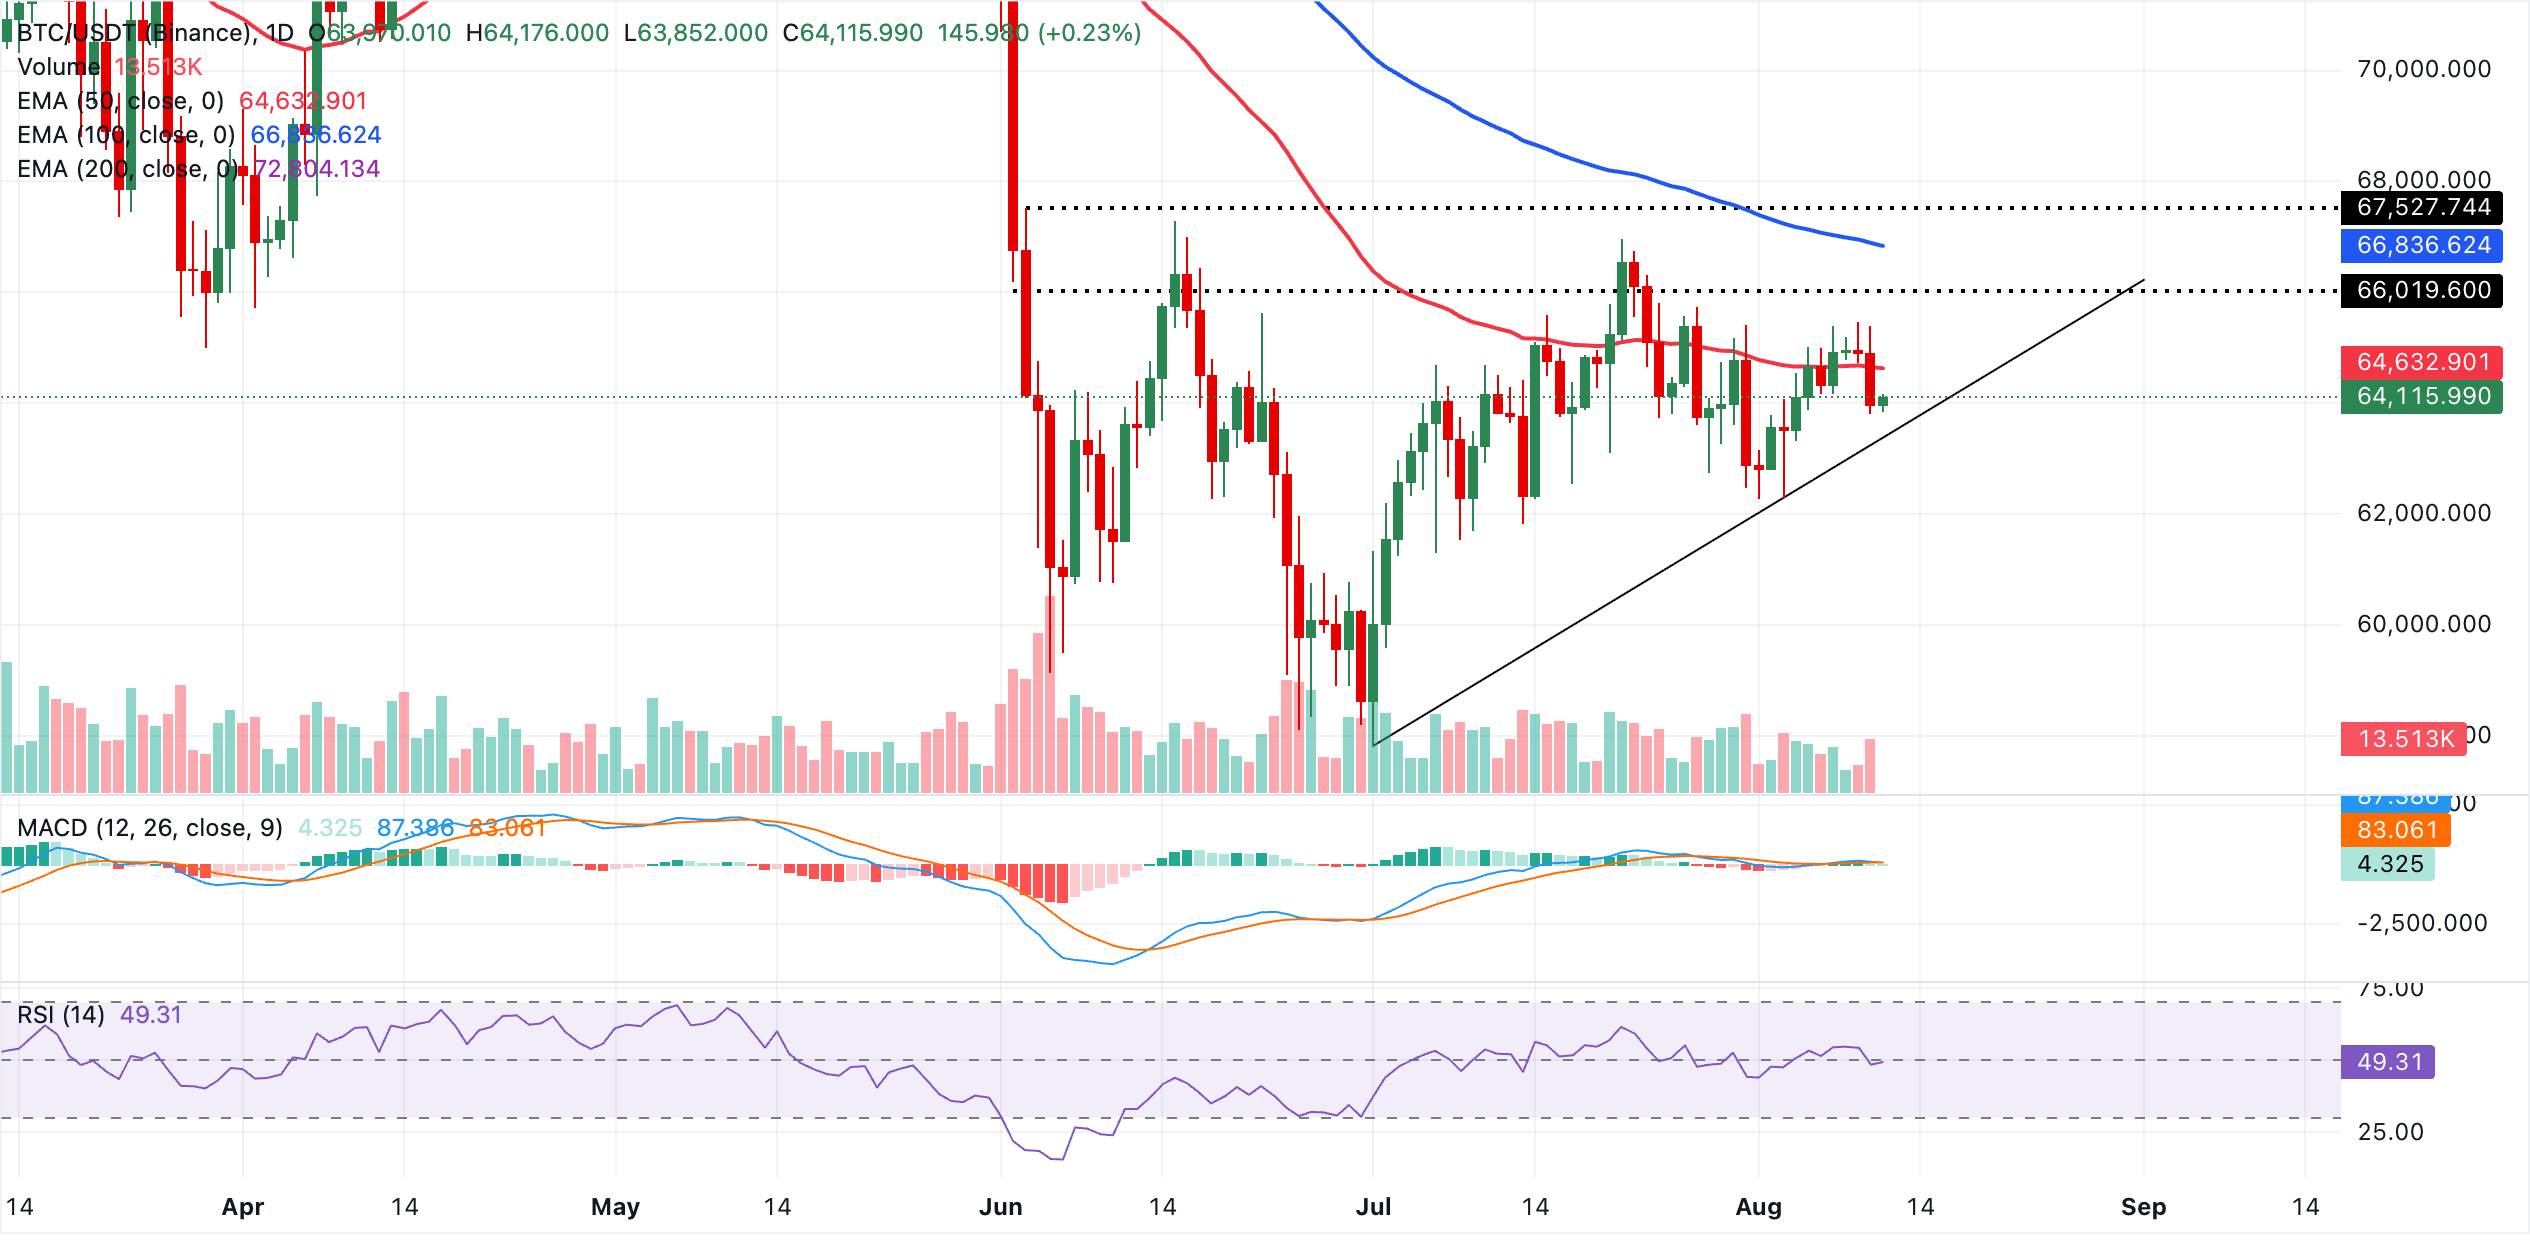
Immediate resistance lies at the 50-day EMA around $64,633, followed by the 100-day EMA near $66,837 and then the more distant 200-day EMA at approximately $72,804, forming a layered supply zone that bulls would need to reclaim to shift the bias.
On the downside, initial support emerges at the upward-sloping trendline break area around $63,430, where a sustained move below this level would likely expose BTC to deeper corrective losses, while holding above it keeps the pair in a consolidative mode beneath those dominant EMAs.
Altcoins technical outlook: Ethereum holds support as XRP slides
Ethereum trades at $1,877, holding above the 50-day EMA at $1,863 but remaining capped beneath the 100-day EMA at $1,924 and the 200-day EMA near $2,123. This configuration suggests a neutral to slightly bearish near-term tone, with price caught between short-term trend support and heavier overhead supply.
Momentum is mixed, as the RSI sits around 50, while the MACD stays below zero with a negative histogram, hinting that bullish attempts may struggle while these higher EMAs remain unreclaimed.
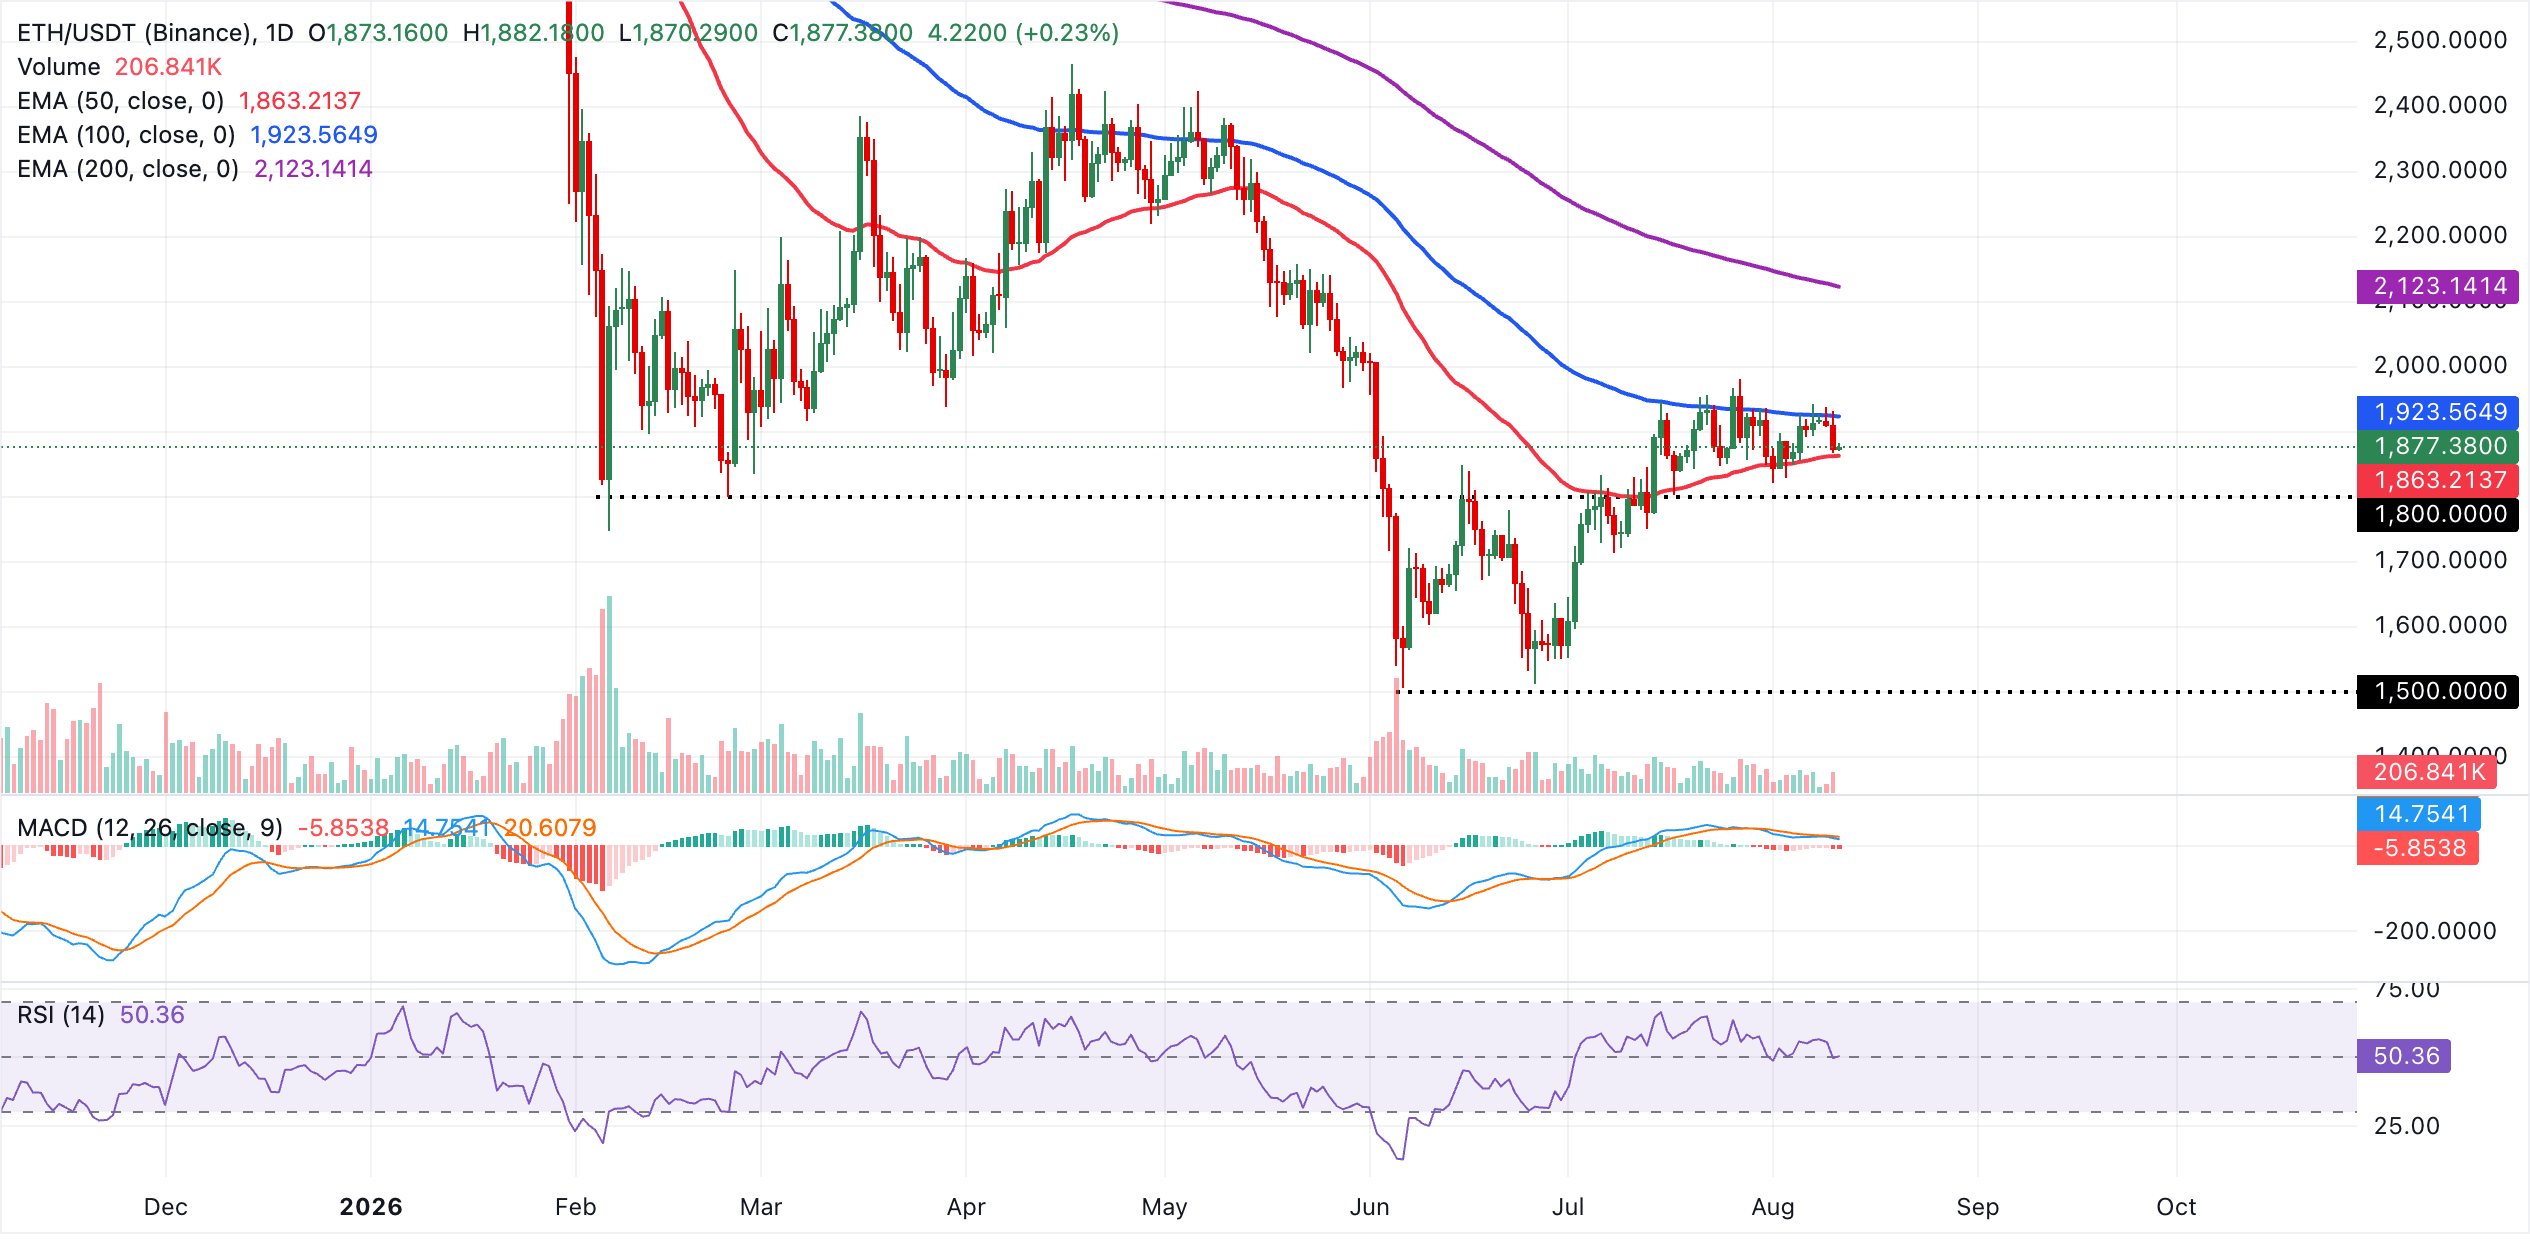
Initial resistance is seen at the 100-day EMA near $1,924, where a sustained break would open the way toward the more significant barrier at the 200-day EMA around $2,123. On the downside, immediate support is provided by the 50-day EMA at $1,863. A daily close below this level would expose a deeper pullback, leaving ETH vulnerable to further weakness as buyers lose the short-term trend floor.
XRP, on the other hand, trades above $1.00, extending a bearish near‑term bias as price holds decisively beneath the 50-day, 100-day and 200-day EMAs, which all sit overhead and reinforce a capped structure.
The MACD indicator stays below zero on the daily chart, hinting at persistent downside pressure, while the RSI at 34 hovers just above oversold territory, suggesting that sellers remain in control even as the pair approaches stretched conditions.
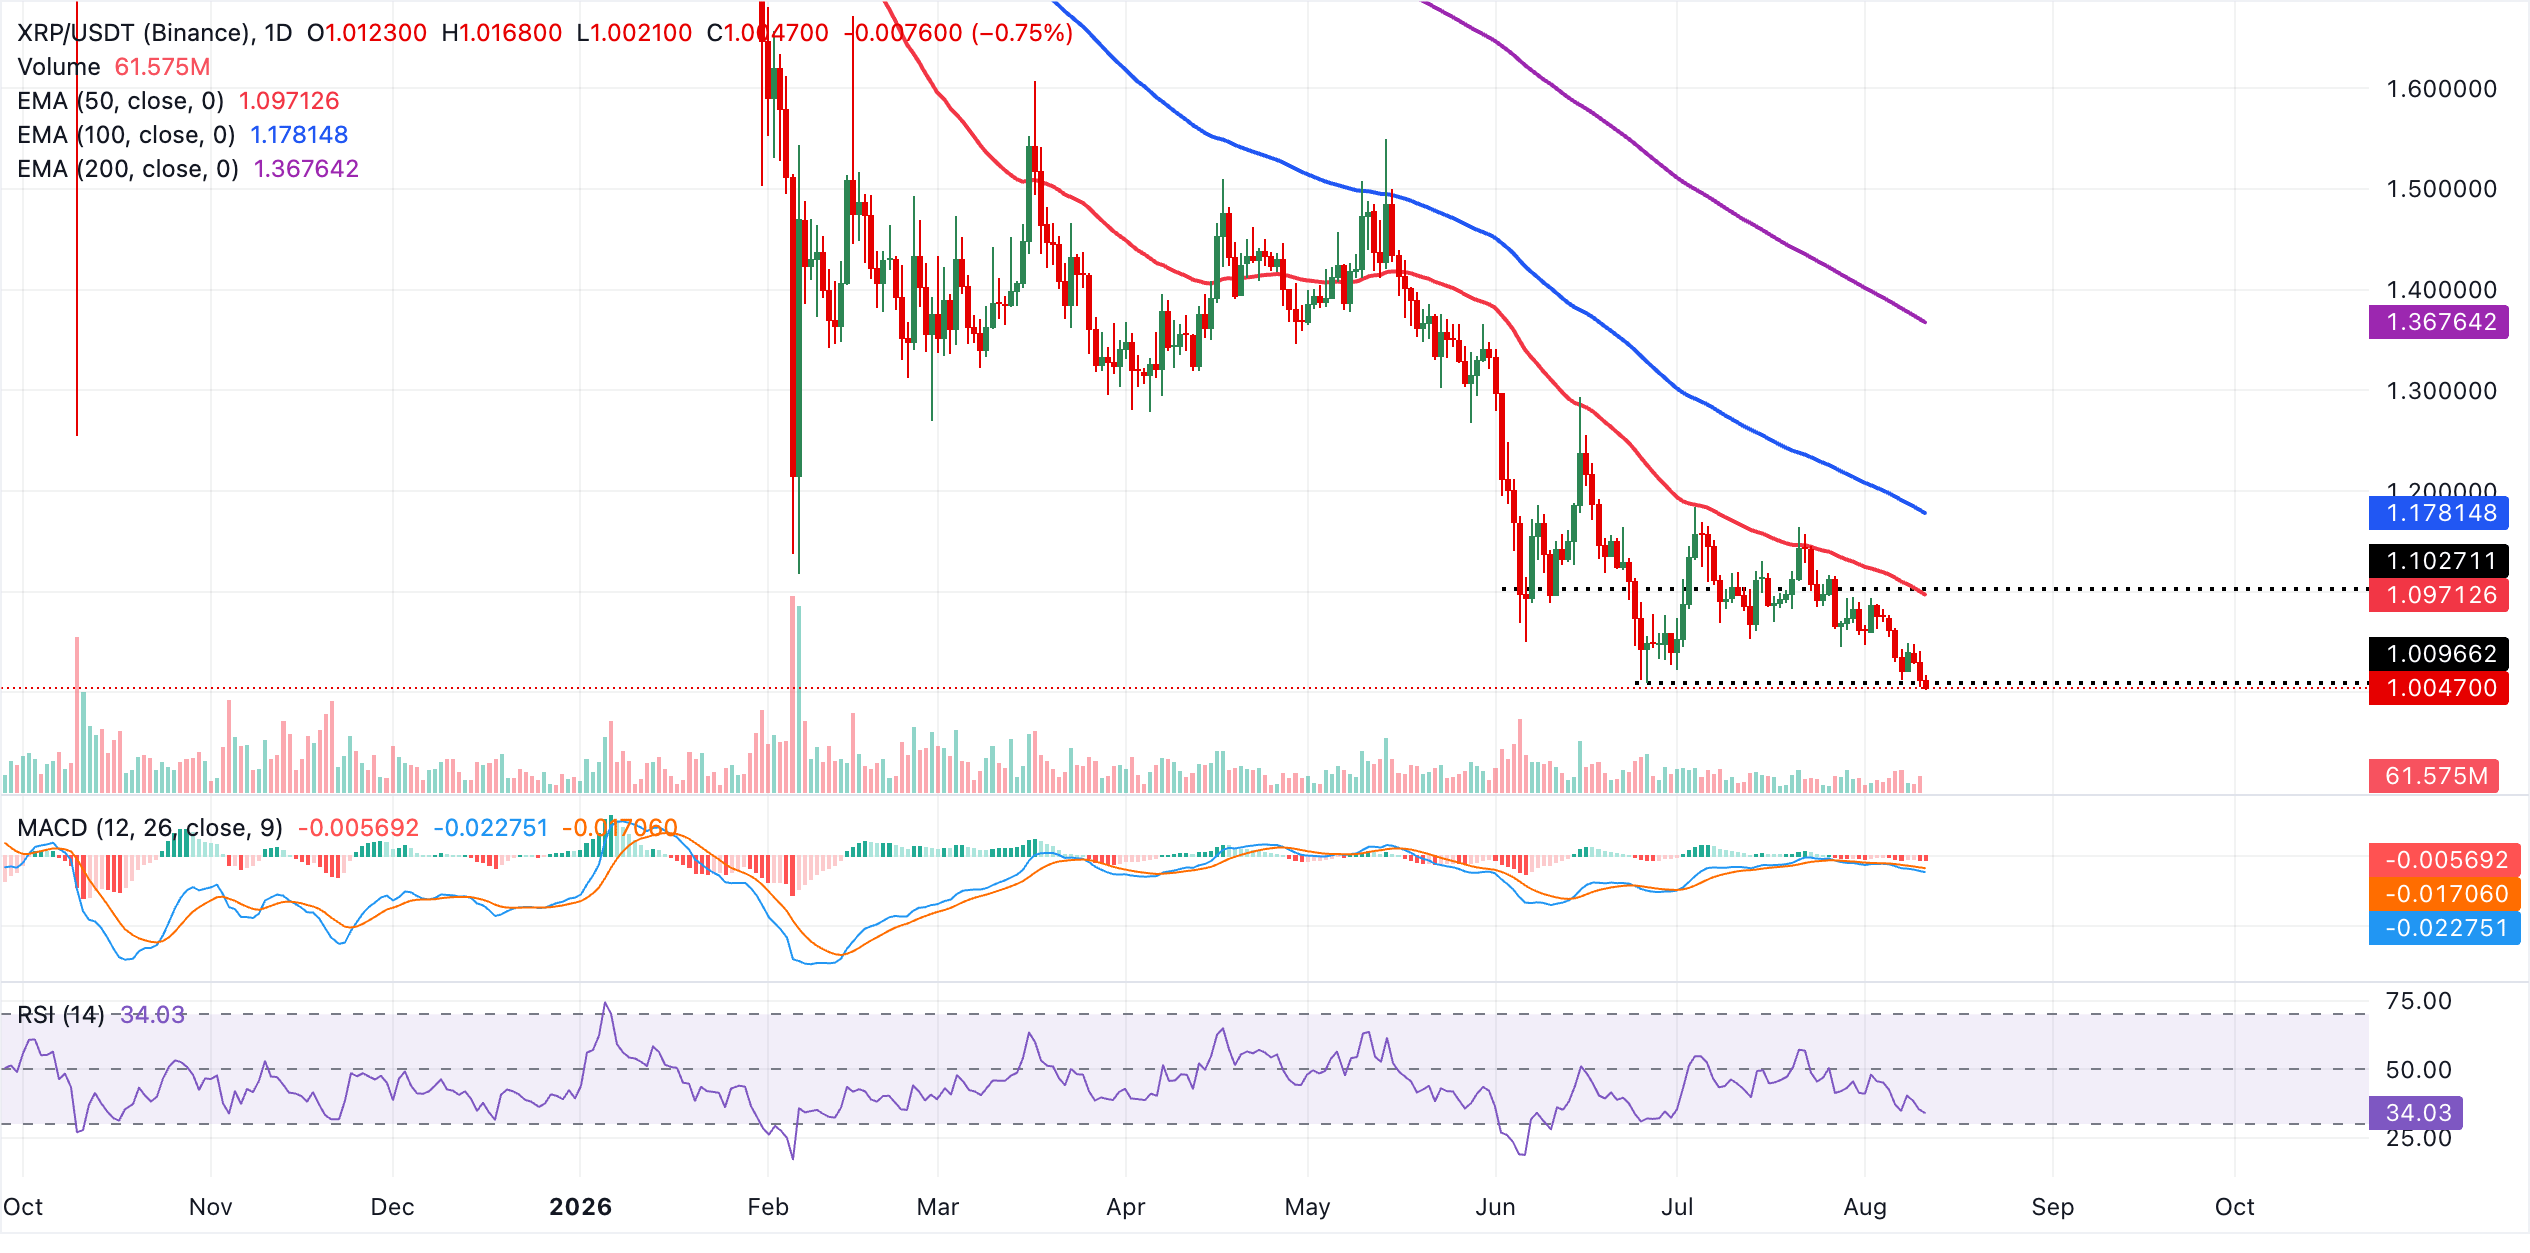
Immediate resistance emerges at the 50-day EMA near $1.10, followed by the 100-day EMA at $1.18 and the more distant 200-day EMA around $1.37, forming a layered barrier that the pair would need to reclaim to alleviate the current bearish tone. Any further decline would likely be guided by prior price lows and psychological handles at $1.00 and $0.95, while only a sustained recovery above the clustered EMAs would start to shift the bias toward stabilization.
(The technical analysis of this story was written with the help of an AI tool. Know more.)
Bitcoin, altcoins, stablecoins FAQs
Bitcoin is the largest cryptocurrency by market capitalization, a virtual currency designed to serve as money. This form of payment cannot be controlled by any one person, group, or entity, which eliminates the need for third-party participation during financial transactions.
Altcoins are any cryptocurrency apart from Bitcoin, but some also regard Ethereum as a non-altcoin because it is from these two cryptocurrencies that forking happens. If this is true, then Litecoin is the first altcoin, forked from the Bitcoin protocol and, therefore, an “improved” version of it.
Stablecoins are cryptocurrencies designed to have a stable price, with their value backed by a reserve of the asset it represents. To achieve this, the value of any one stablecoin is pegged to a commodity or financial instrument, such as the US Dollar (USD), with its supply regulated by an algorithm or demand. The main goal of stablecoins is to provide an on/off-ramp for investors willing to trade and invest in cryptocurrencies. Stablecoins also allow investors to store value since cryptocurrencies, in general, are subject to volatility.
Bitcoin dominance is the ratio of Bitcoin's market capitalization to the total market capitalization of all cryptocurrencies combined. It provides a clear picture of Bitcoin’s interest among investors. A high BTC dominance typically happens before and during a bull run, in which investors resort to investing in relatively stable and high market capitalization cryptocurrency like Bitcoin. A drop in BTC dominance usually means that investors are moving their capital and/or profits to altcoins in a quest for higher returns, which usually triggers an explosion of altcoin rallies.
추천 기사


