


Solana Price Forecast: SOL risks a steeper decline below $70 despite steady ETF inflows
- Solana edges lower on Monday, facing downside pressure with the price capped below its 50-day EMA at $75.68.
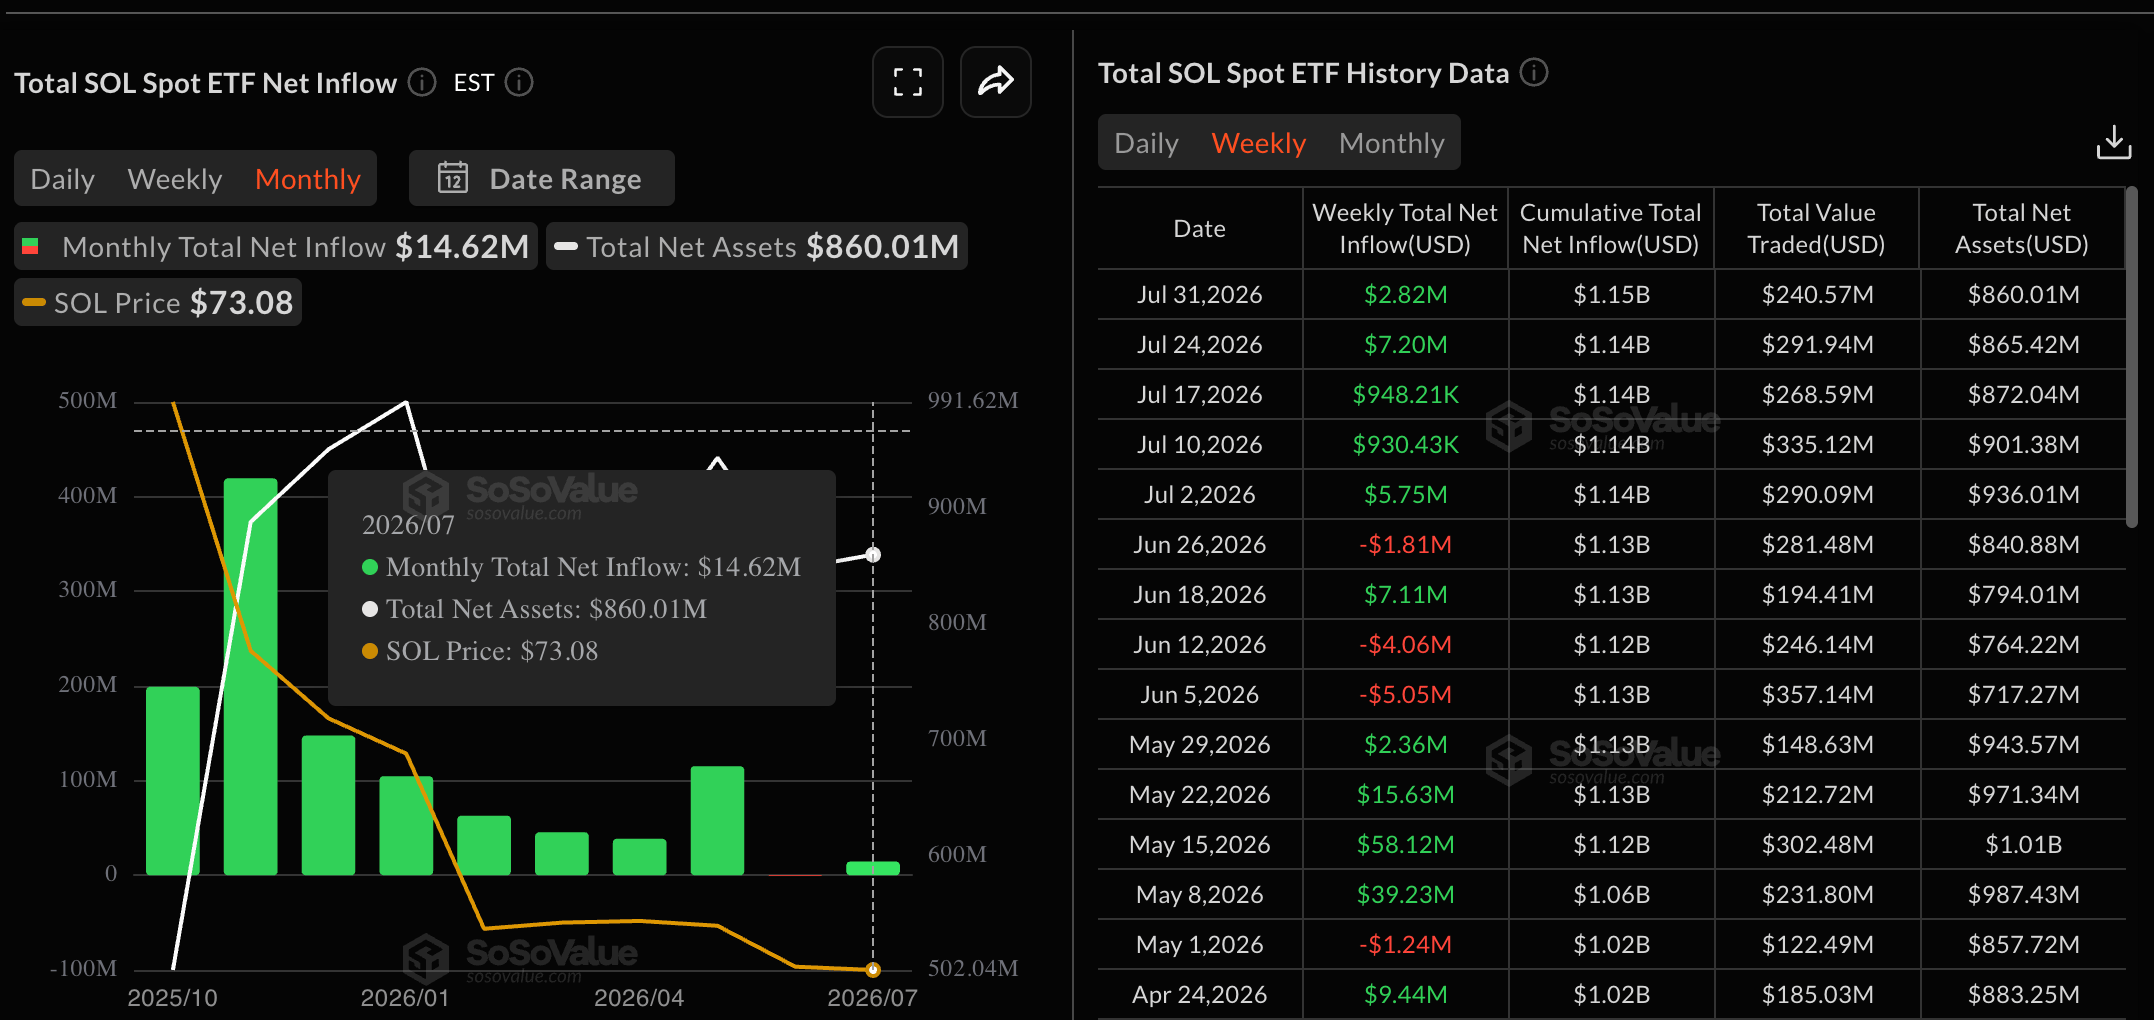
- Institutional demand shows resilience with five consecutive weekly inflows totaling $14.62 million in July.
- Retail demand eases as trading volume declines and the funding rate turns negative.
Solana (SOL) is trading in the red on Monday, losing bullish momentum and remaining capped below its 50-day Exponential Moving Average (EMA) at $75.68. SOL-focused Exchange Traded Funds (ETFs) show resilience with a monthly inflow of $14.62 million in July, while the near-term retail support wanes with the funding rate turning negative. The technical outlook for SOL is mildly bearish as downside momentum gains traction.
Solana loses retail strength despite resilient ETF inflows
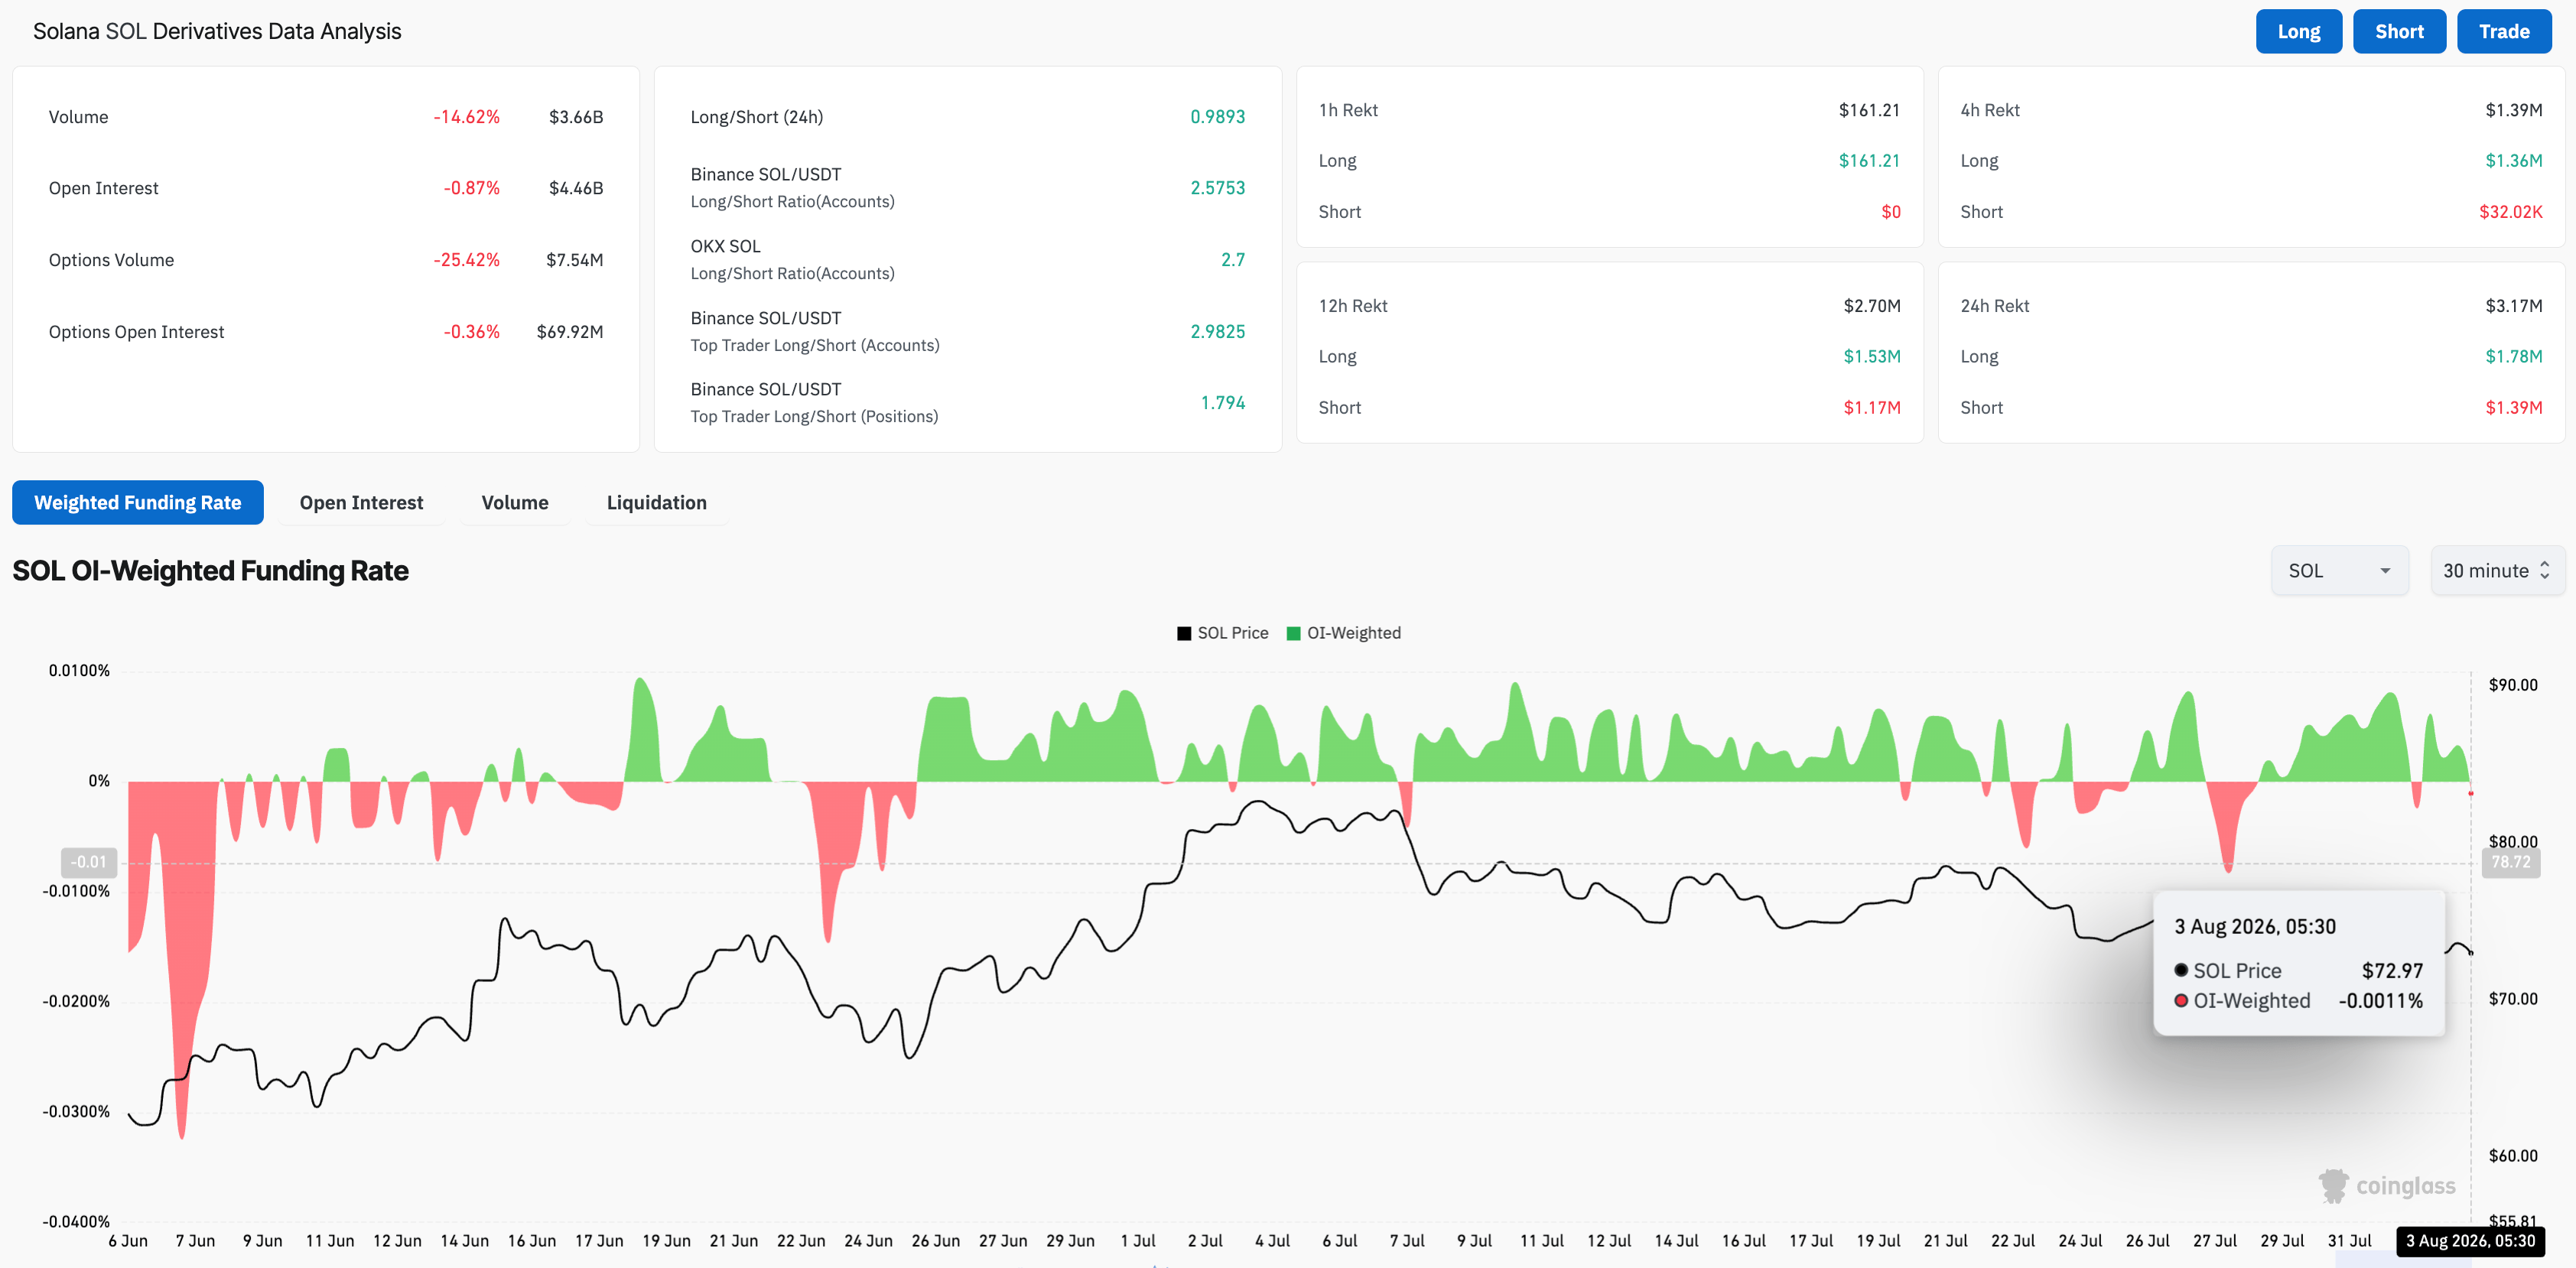
Solana is facing reduced speculative demand as broader crypto market sentiment weakens, while institutional investors remain resilient. CoinGlass data shows that SOL futures trading volume fell 14% over the last 24 hours to $3.66 billion, indicating reduced retail activity. Meanwhile, the funding rate – the premium traders are willing to pay to hold a position – has flipped negative to -0.0011% from a peak of 0.0062% on Sunday, pointing to a bearish bias.
On the other hand, SOL ETFs recorded $2.82 million in inflows last week, extending a streak of five consecutive weekly inflows and bringing July inflows to $14.62 million. This marks the lowest monthly positive flow, up from $786,580 in outflows in May, which could be an early sign of renewed institutional demand.
Technical outlook: Will Solana price drop below $70?
Solana maintains a bearish near-term tone, capped below its 50-day EMA at $75.68 and well under the 200-day EMA at $92.69. From a technical perspective, SOL trades below a descending trendline near $76.06 and is heading toward the support trendline near $71.30.
A decisive close below this zone could extend the decline toward the 78.6% Fibonacci retracement of the downswing from the $98.41 high to the $60.13 low, at $66.81
Momentum aligns with this capped structure, as the Relative Strength Index (RSI) at 43 hovers below the midline and the Moving Average Convergence Divergence (MACD) remains negative below the signal line, suggesting firm downside pressure.
On the topside, immediate resistance is clustered between the 50-day EMA at $75.68 and the trendline break level at $76.06. Further up, the 50% retracement at $79.27 defines a key barrier before the 23.6% retracement at $87.60 and the 200-day EMA at $92.69.
(The technical analysis of this story was written with the help of an AI tool. Know more.)
추천 기사


