


Crypto Today: Bitcoin, Ethereum, XRP give back gains as tit-for-tat US-Iran strikes persist
- Bitcoin losses extend below $63,000 amid incessant geopolitical pressure in the Middle East.
- Ethereum drops and holds the 50-day EMA as immediate support, weighed down by ETF outflows.
- XRP’s technical structure remains weak, paving the way for declines below $1.10 despite mild capital inflows.
Cryptocurrencies broadly edge lower on Friday, as investors continue to assess the impact of the incessant strikes between the United States (US) and Iran in the Middle East. Bitcoin (BTC) has corrected by more than 1% on the day, trading below $63,000. This is part of a larger retracement from its weekly high of $65,600.
Ethereum (ETH) and Ripple (XRP) similarly reflect overall pressure, with ETH falling toward the short-term $1,800 support and XRP hovering below the pivotal $1.10 level.
US-Iran strikes weigh on markets as investors turn risk-averse
US military operations continued for a sixth consecutive night, targeting southern Iran. Al Jazeera reported that officials in Bandar Abbas have confirmed strikes on civilian infrastructure, including power facilities and a train station.
Reuters, citing sources late Thursday, revealed that Iran has instructed Yemen’s Houthi militia to prepare to close the Red Sea oil corridor if US actions escalate against Iranian power assets, significantly heightening risks to global energy markets.
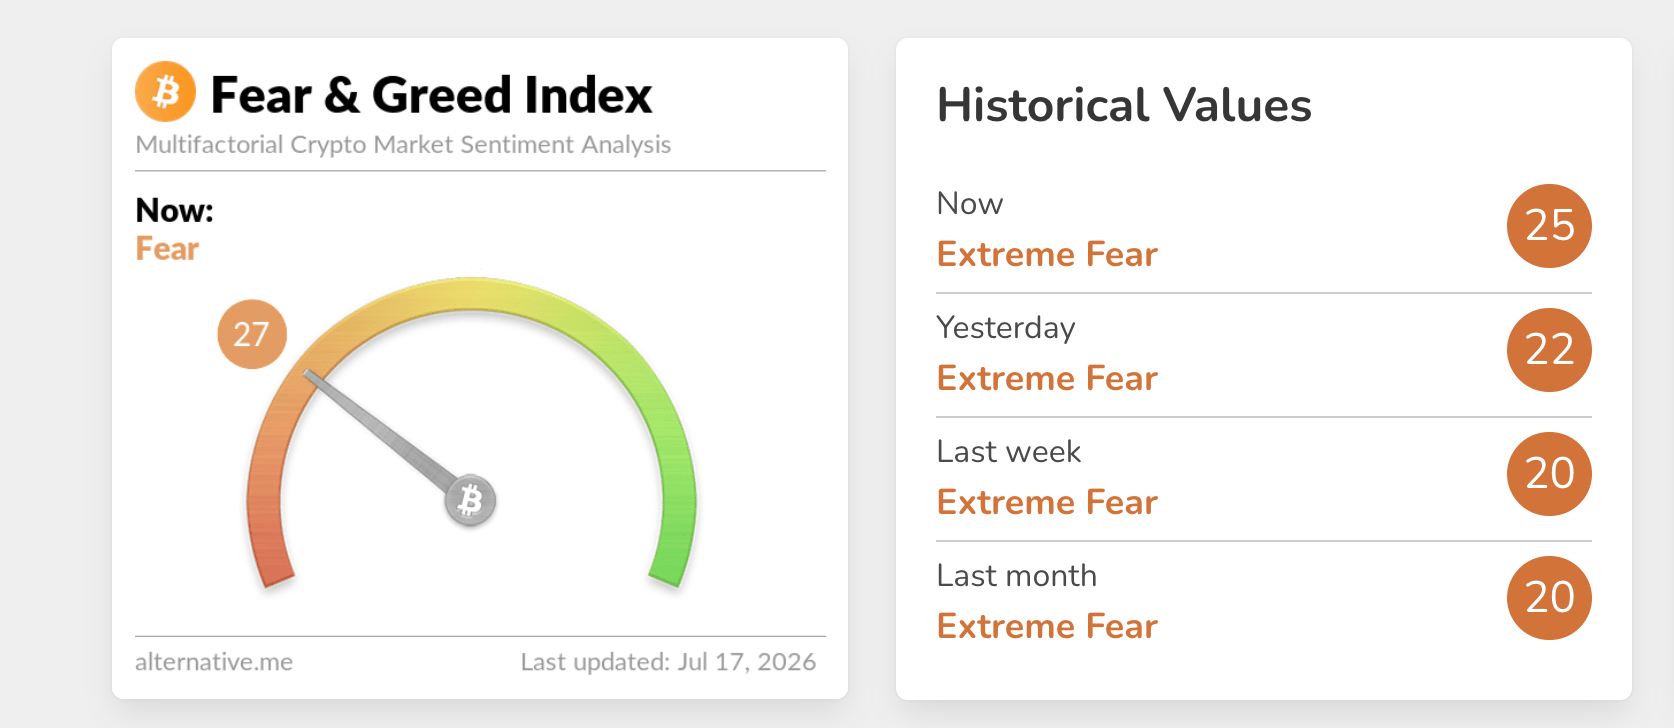
Meanwhile, sentiment remains relatively steady but subdued in the broader crypto market, as reflected in the Fear & Greed Index. The index is embedded in the Fear Territory at 27 on Friday, up slightly from 25 the day before. This stability can be attributed to macro signals of inflation easing in the world’s largest economy earlier in the week, which triggered a short-lived rally in risk assets including Bitcoin, Ethereum and XRP.
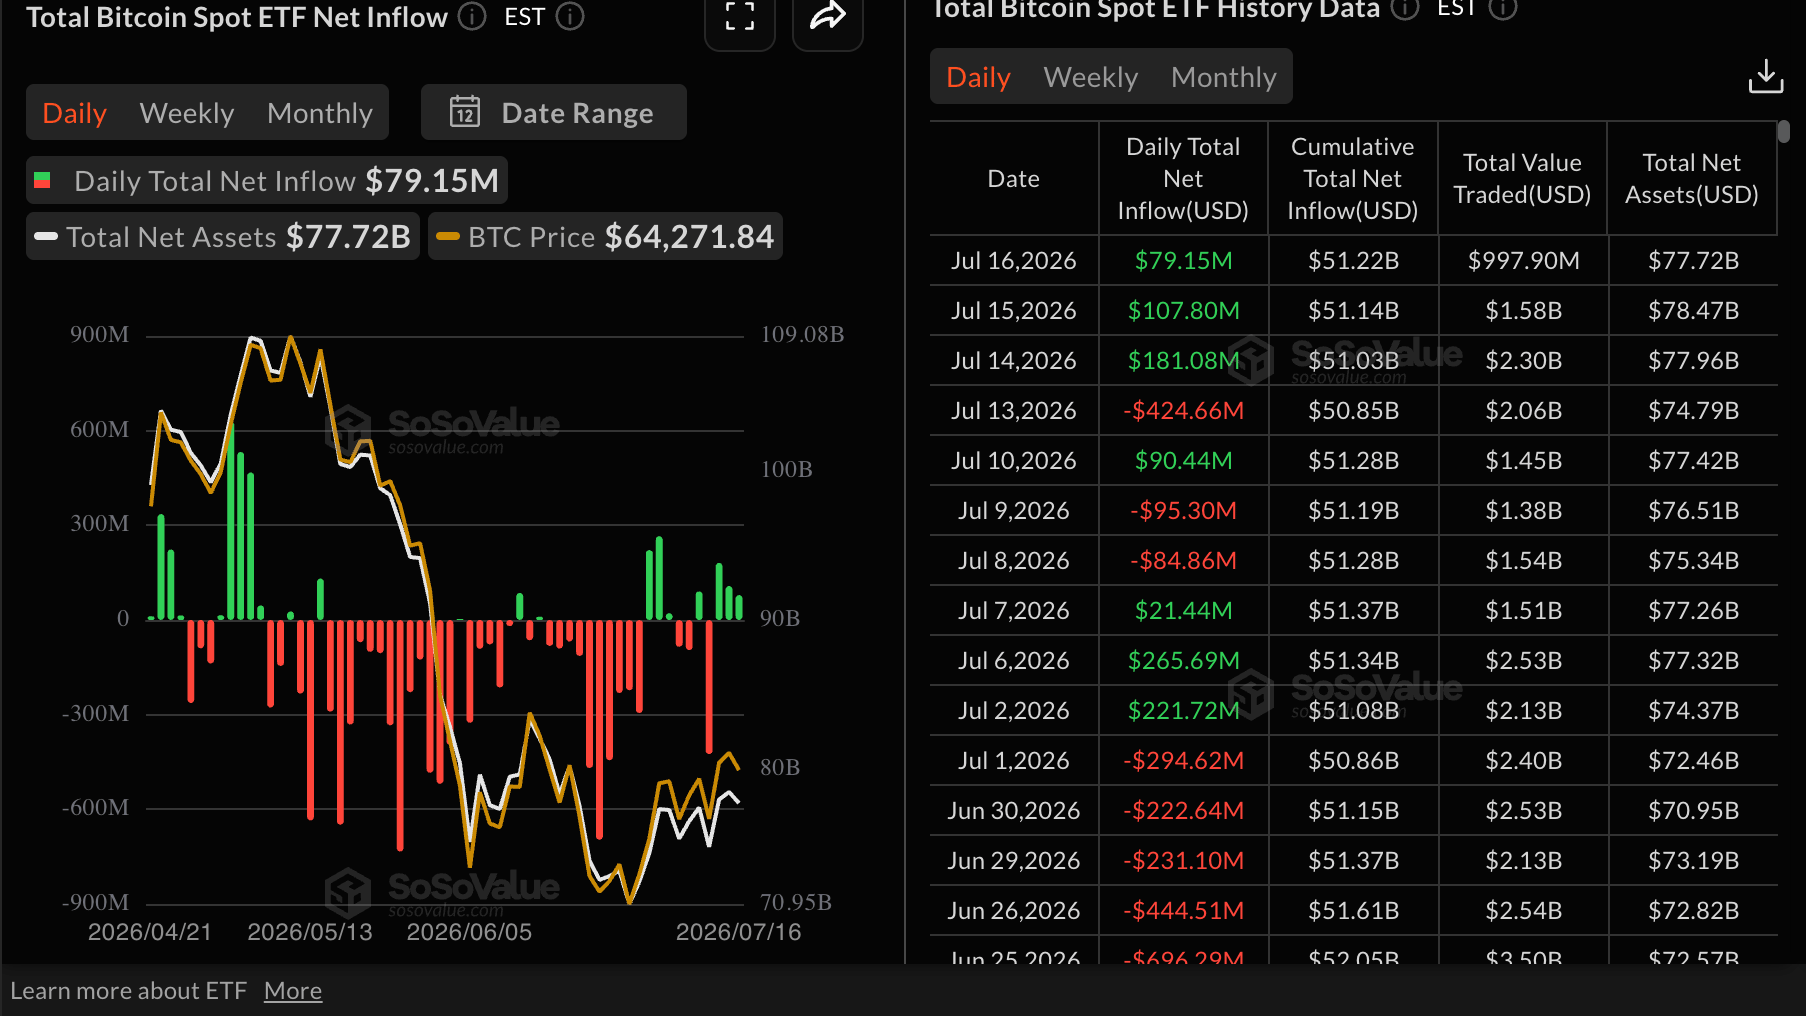
Meanwhile, Bitcoin spot Exchange-Traded Funds (ETFs) inflows persisted on Thursday at roughly $79 million, marking a notable decline from the $108 million posted on Wednesday and $181 million on Tuesday. If institutional appetite steadies in the coming weeks, it would absorb the war-triggered pressure, allowing for consolidation ahead of another breakout attempt above $65,000.
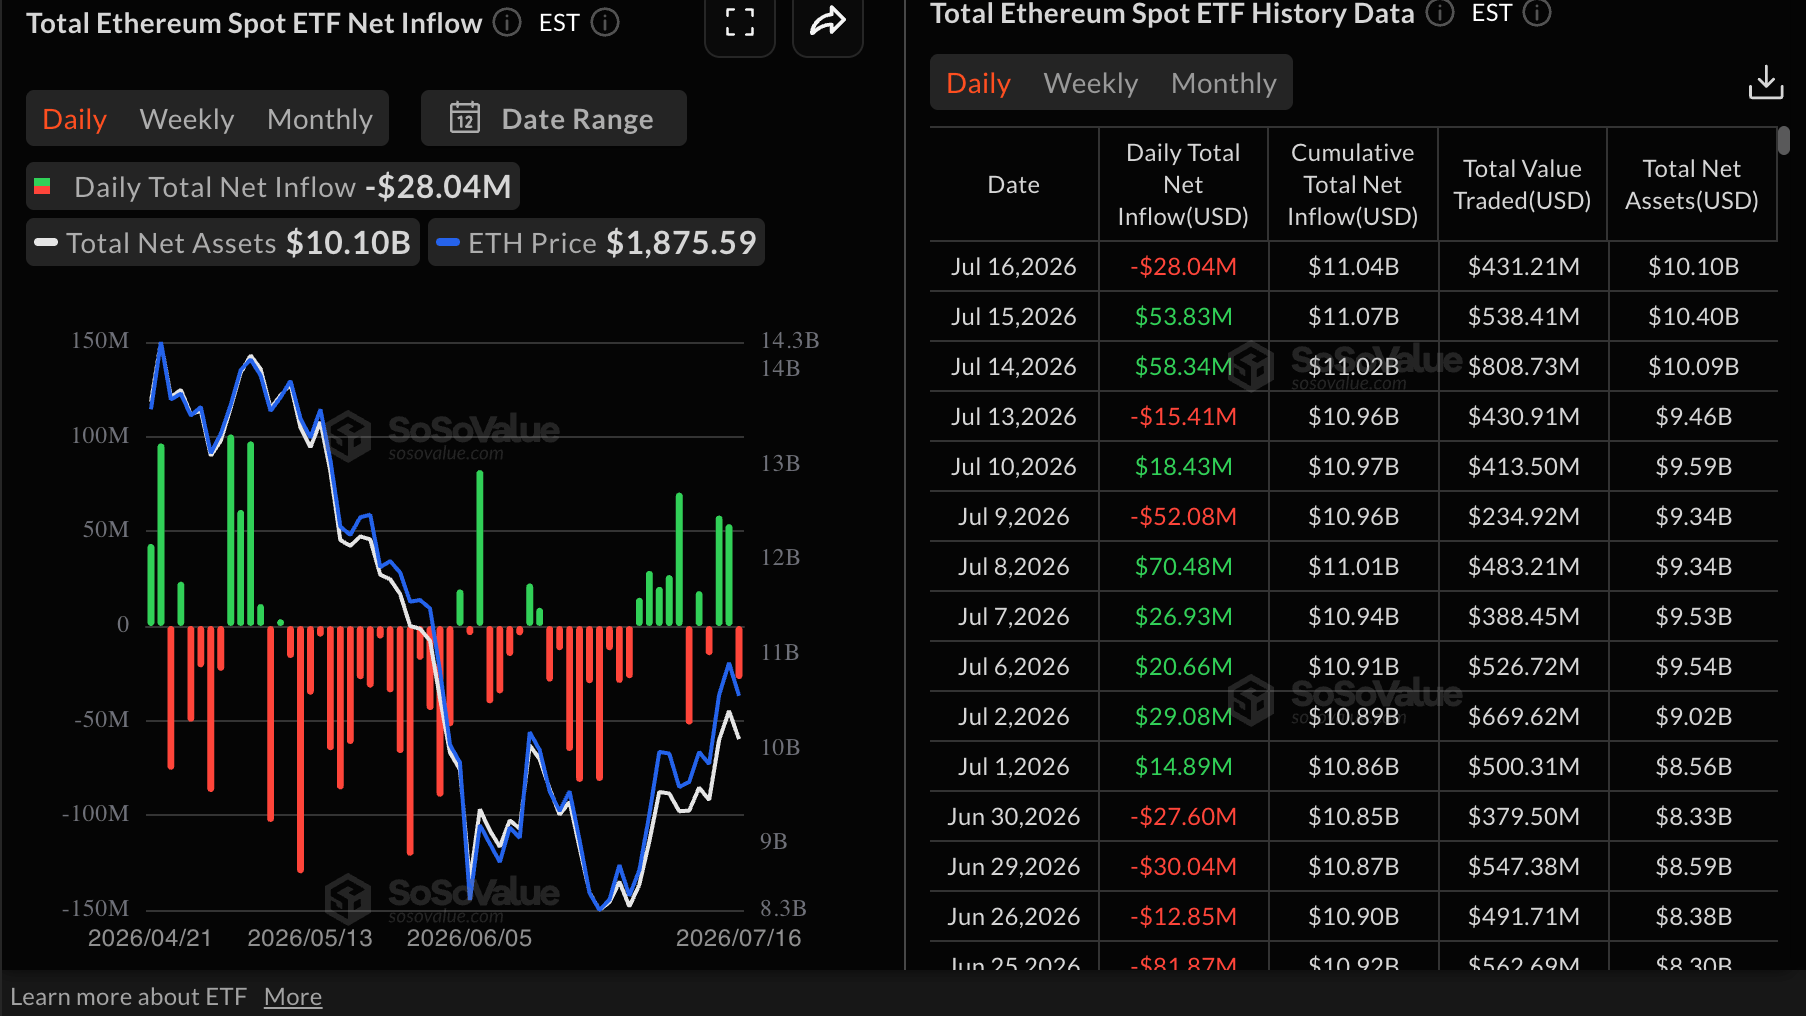
Investment into Ethereum spot ETFs turned risk-averse, with outflows of $28 million on Thursday. This broke two straight days of inflows, which totaled $54 million on Wednesday and $58 million on Tuesday. The outflows also align with Ethereum’s correction rejection from the weekly high at $1,947 and underscore the broader risk-off sentiment.
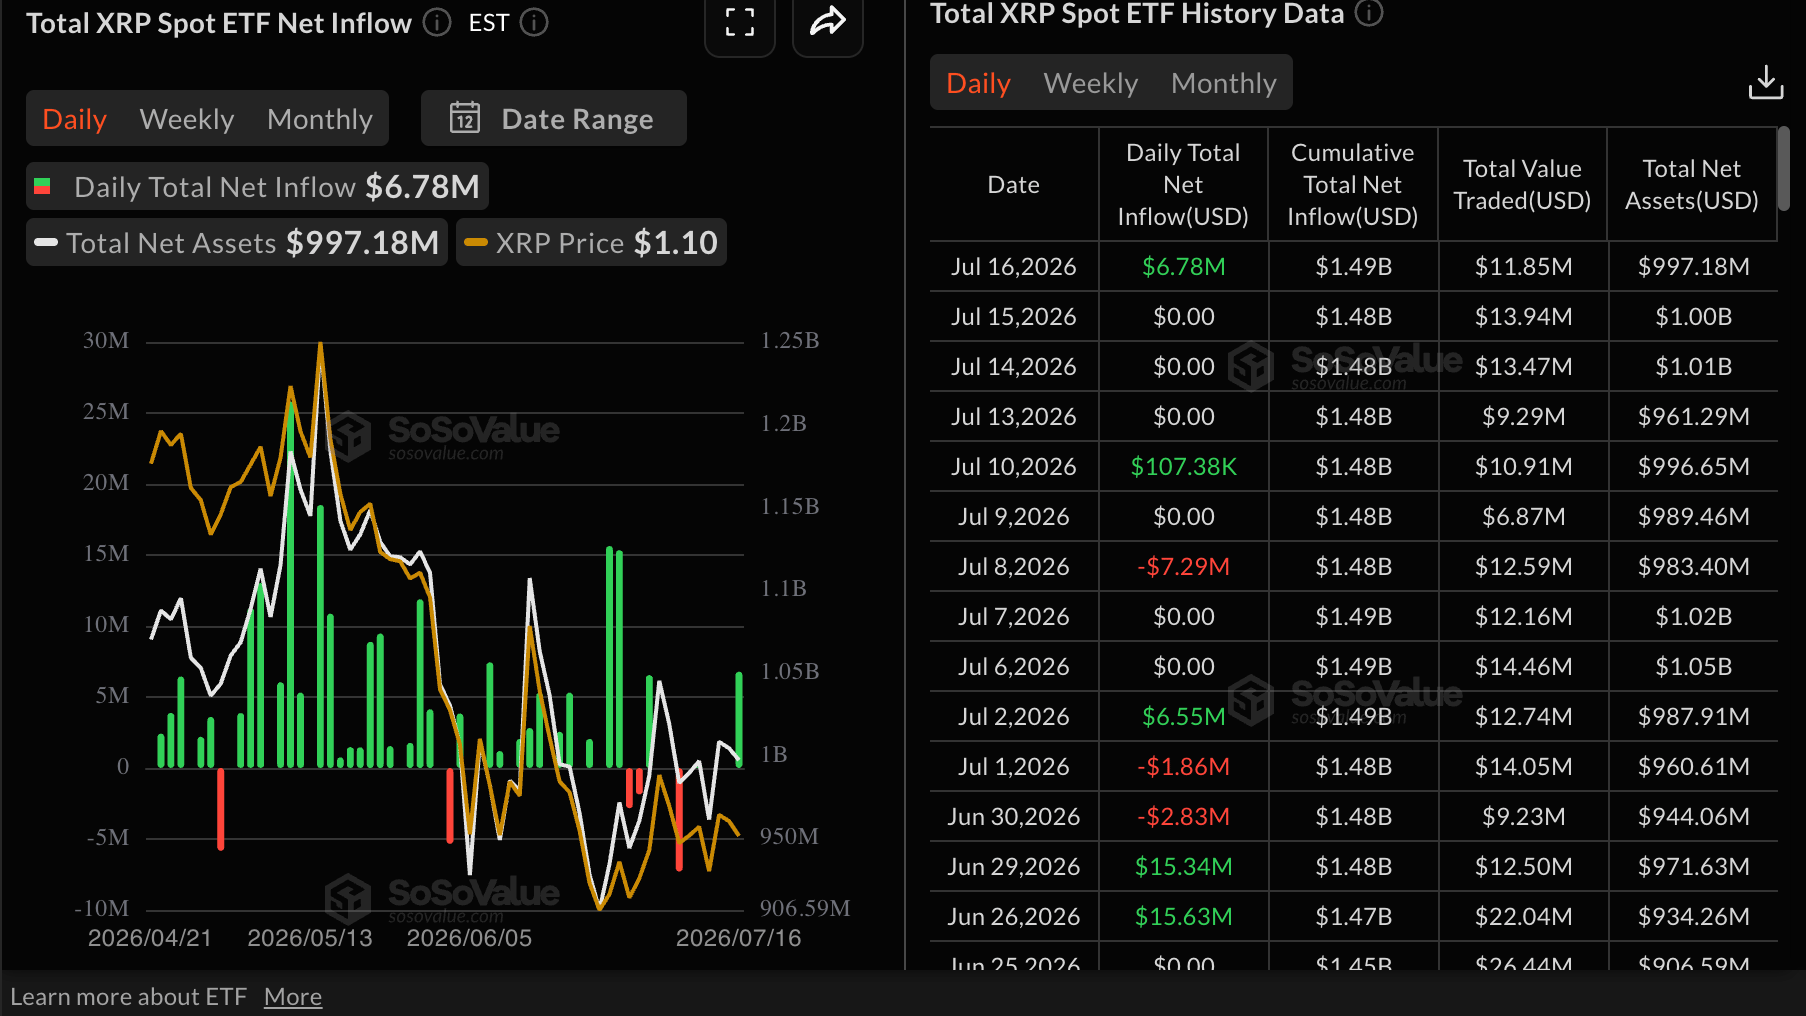
As for XRP, demand for spot ETFs returned on Thursday, attracting nearly $7 million in inflows, according to SoSoValue data. This positive turnaround comes after three days where activity remains muted. Still, cumulative inflows edged higher to $1.49 billion, with net assets averaging $997 million. Sustained demand for US-listed ETFs is needed to absorb the selling pressure in the spot market and support a steady rebound.
Price analysis: Bitcoin slides as technical weakness weighs
Bitcoin maintains a bearish bias as it holds below the 50-day, 100-day and 200-day Exponential Moving Averages (EMAs). The Parabolic SAR at $65,600 reinforces the overhead supply, while the Relative Strength Index (RSI) at 47 stays slightly below neutral, hinting at lacklustre buying pressure despite the modest positive reading in the Moving Average Convergence Divergence (MACD) histogram.
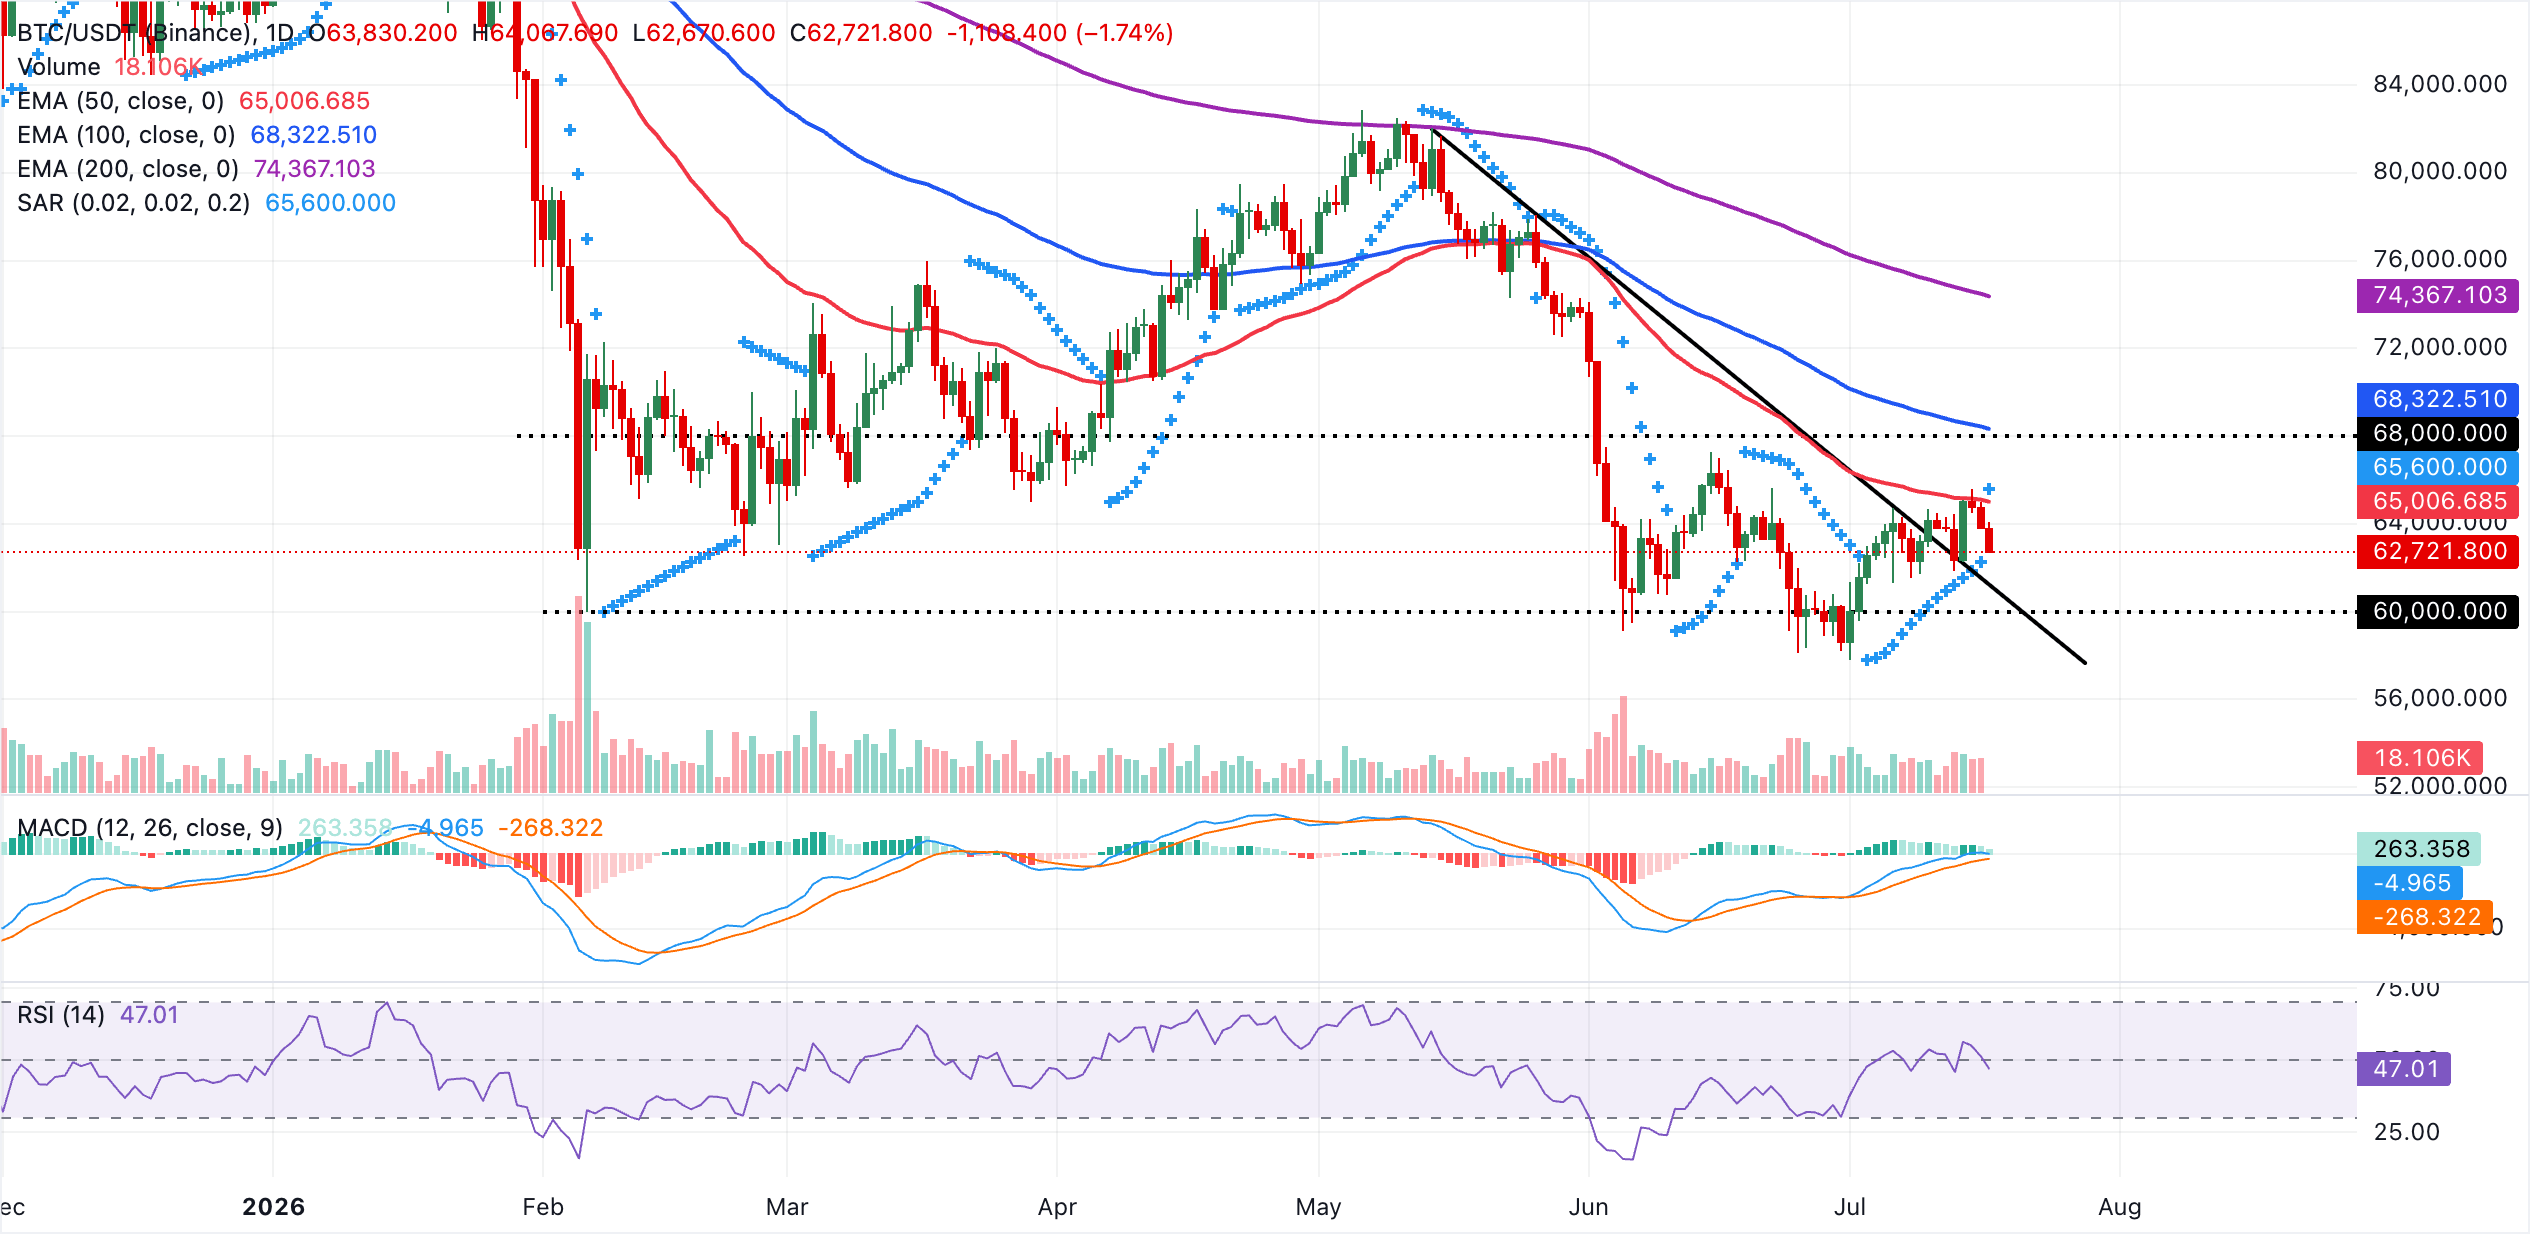
On the topside, immediate resistance lies at the 50-day EMA at $65,007, followed closely by the Parabolic SAR at $65,600, forming a near-term cap before the 100-day EMA at $68,323 and the longer-term 200-day EMA at $74,367. On the downside, the former downward trendline break around $61,106 acts as the nearest structural support, and a daily close back below this level would likely open the way to a deeper corrective phase. Any sustained rebound from the current level will need to reclaim the clustered resistance around $65,000 to ease the current bearish tone.
Altcoins outlook: Ethereum and XRP fall toward session support
Ethereum trades at $1,830, holding above the short-term 50-day EMA at $1,811 and the Parabolic SAR at $1,801, which together suggest a modestly supportive near-term tone despite the broader downtrend. However, the pair remains capped below the medium and long-term 100-day EMA at $1,942 and the 200-day EMA at $2,185, keeping the larger bias in check even as the RSI around 55 and a positive but easing MACD hint at fading upside momentum.
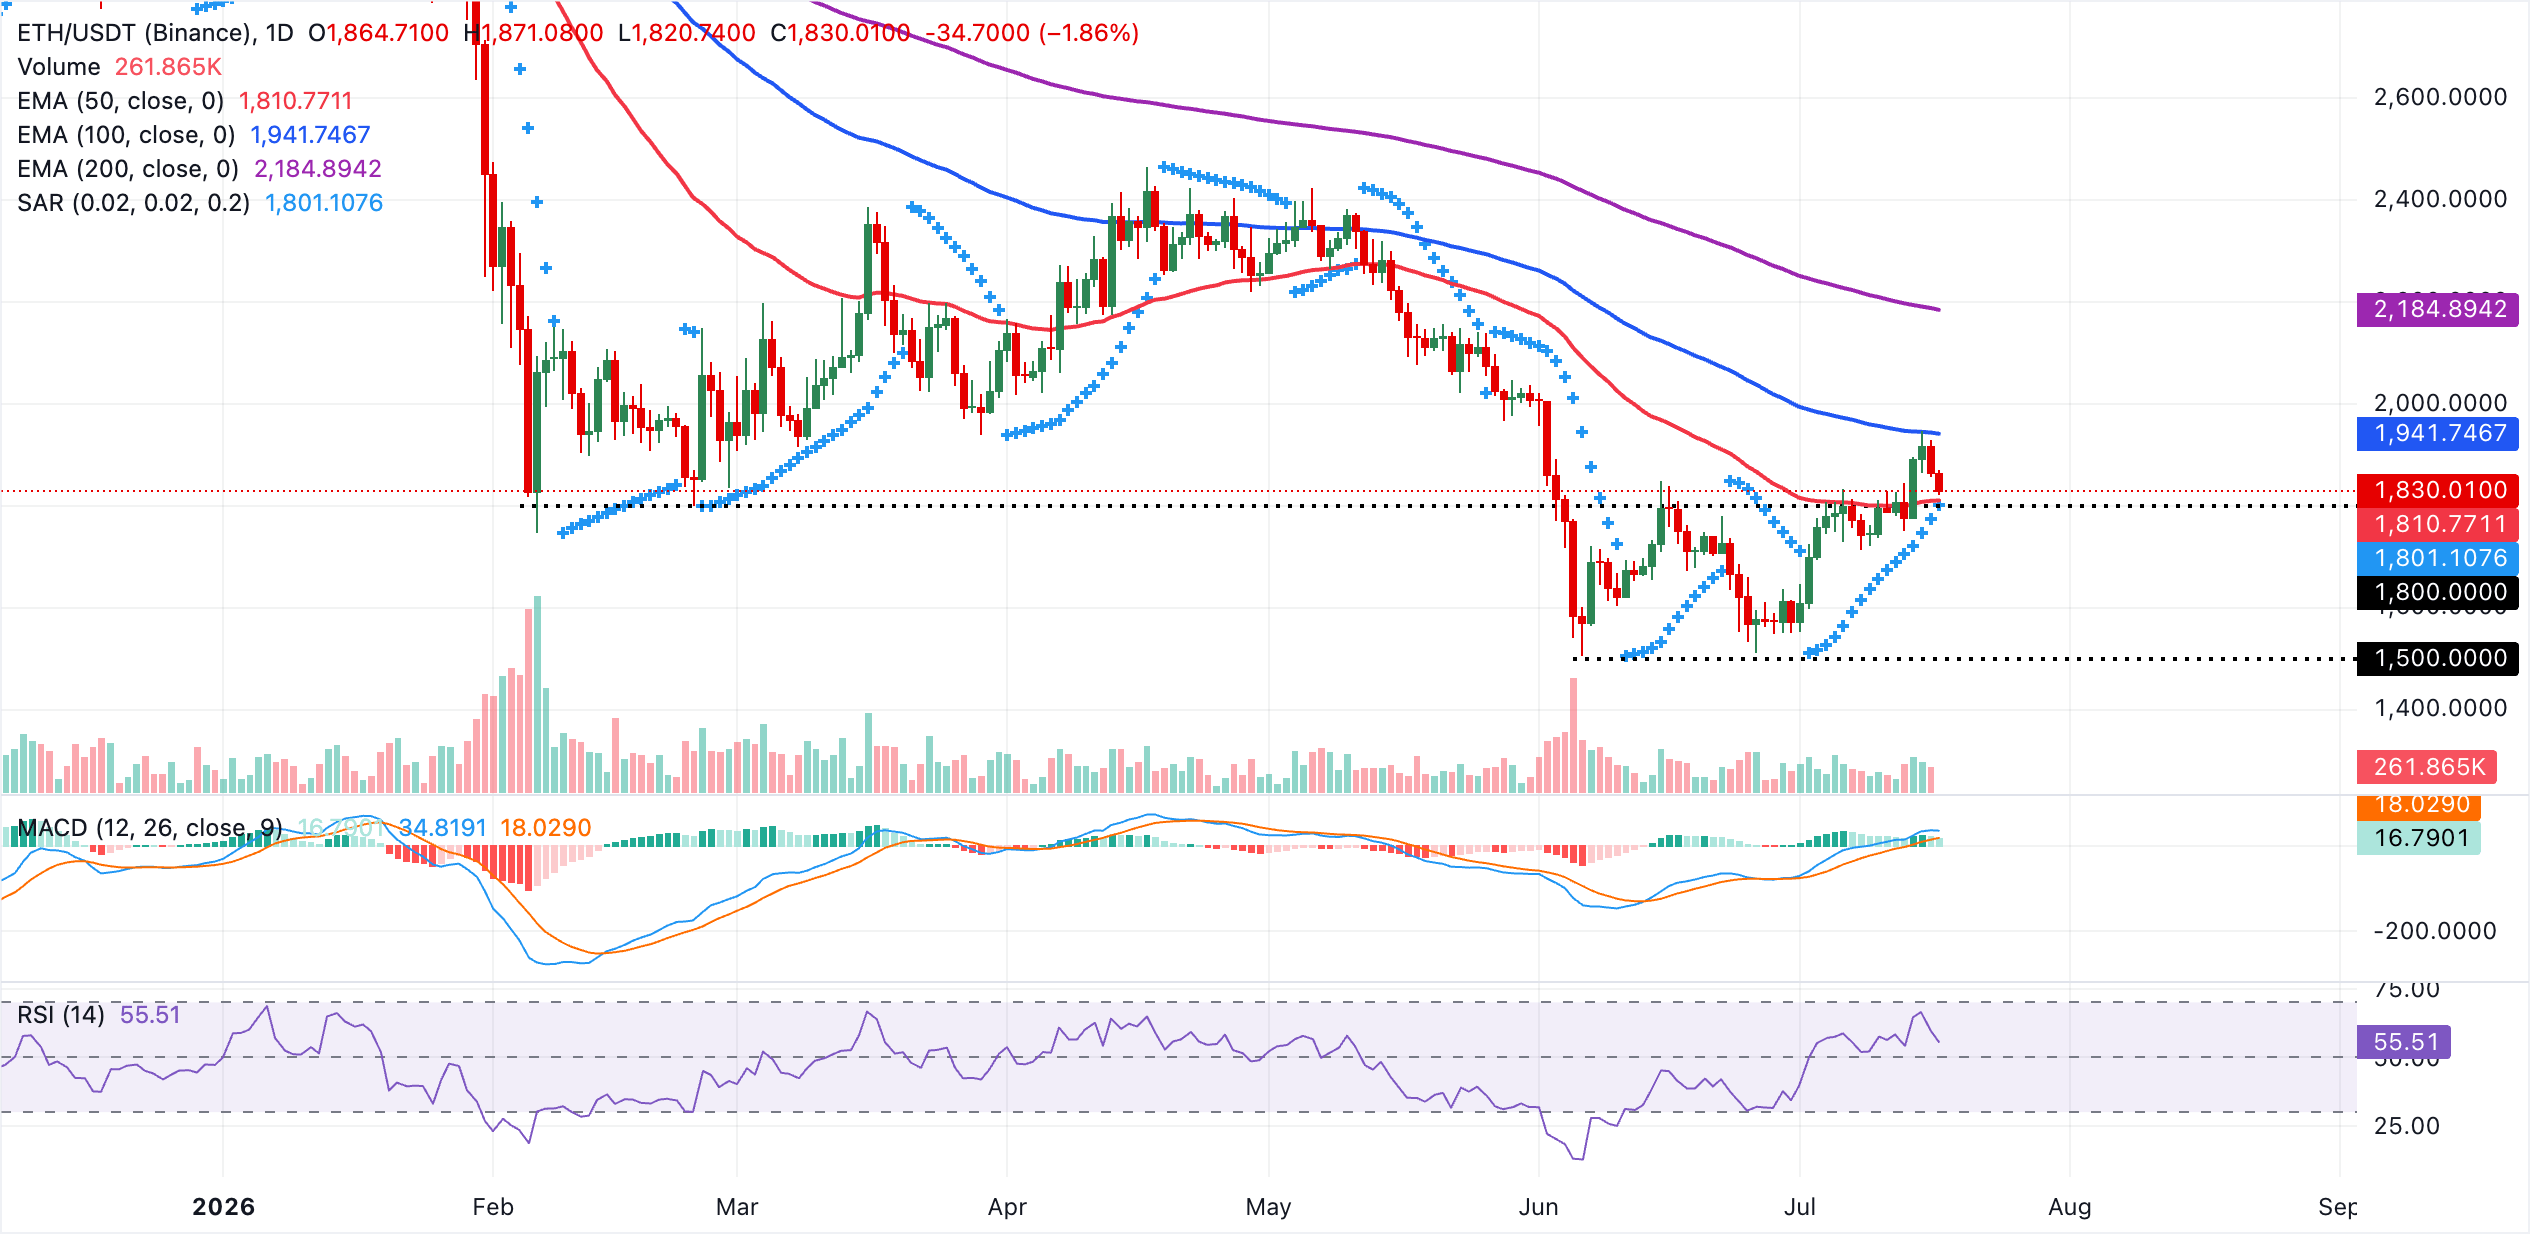
Immediate support is seen near the $1,830 area, with the 50-period EMA at $1,811 and the Parabolic SAR at $1,801 forming a compact demand zone that would need to hold to prevent a deeper pullback. On the topside, initial resistance emerges at the 100-day EMA at $1,942, ahead of the more substantial barrier at the 200-day EMA near $2,185. A sustained break above these overlapping EMA resistances would be needed to reassert a stronger bullish trend in the days ahead.
As for XRP, the token trades below the pivotal 41.10 level, extending a bearish bias. The spot price remains entrenched below the 50-day EMA, 100- day EMA and 200-day, respectively. The the Bollinger Bands middle layer at $1.10 and the broken downward resistance trendline’s break price at $1.12 cap the upside, suggesting rallies are quickly absorbed for now. A mildly positive MACD reading on the daily chart and a the RSI near 44, hint at only modest downside pressure.
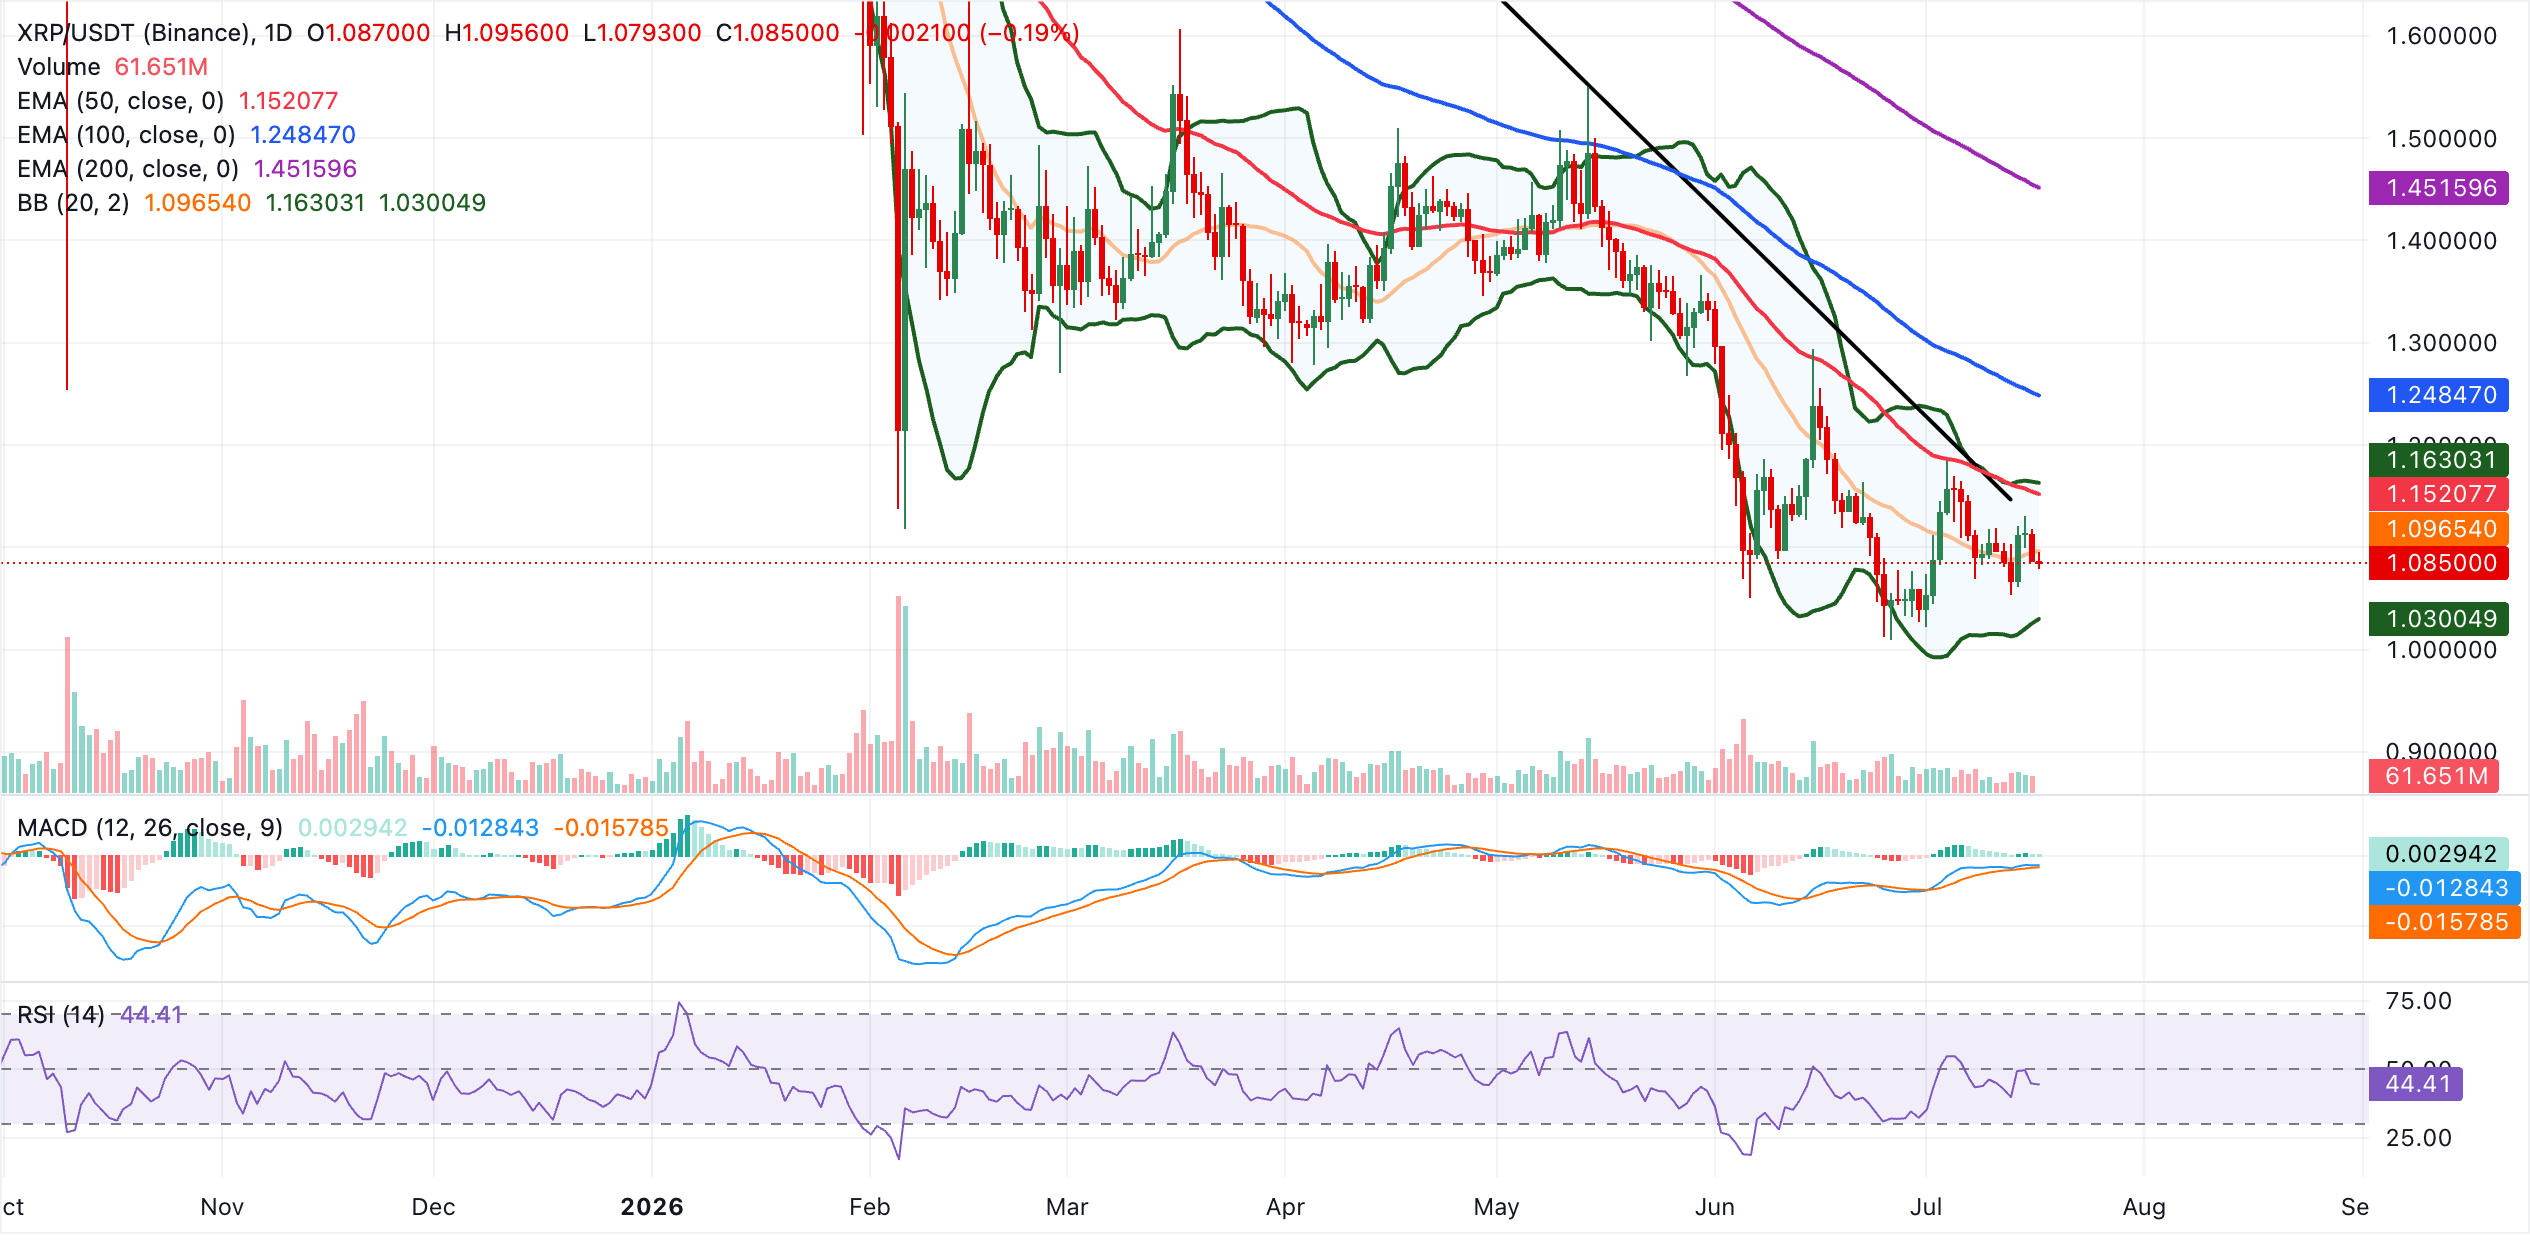
On the topside, initial resistance lies at the Bollinger middle layer near $1.10, followed by the former trendline break level at $1.12, while stronger supply is emerges at the 50-day EMA around $1.15. The Bollinger upper band at $1.16 comes before more distant barriers at the 100-day and 200-day EMAs at $1.25 and $1.45, respectively. On the downside, immediate support is lies at the Bollinger lower layer near $1.03. A sustained break beneath this area would likely reopen the path toward lower psychological levels, keeping the broader technical tone heavy as long as price holds below the clustered EMAs overhead.
(The technical analysis of this story was written with the help of an AI tool. Know more.)
Crypto ETF FAQs
An Exchange-Traded Fund (ETF) is an investment vehicle or an index that tracks the price of an underlying asset. ETFs can not only track a single asset, but a group of assets and sectors. For example, a Bitcoin ETF tracks Bitcoin’s price. ETF is a tool used by investors to gain exposure to a certain asset.
Yes. The first Bitcoin futures ETF in the US was approved by the US Securities & Exchange Commission in October 2021. A total of seven Bitcoin futures ETFs have been approved, with more than 20 still waiting for the regulator’s permission. The SEC says that the cryptocurrency industry is new and subject to manipulation, which is why it has been delaying crypto-related futures ETFs for the last few years.
Yes. The SEC approved in January 2024 the listing and trading of several Bitcoin spot Exchange-Traded Funds, opening the door to institutional capital and mainstream investors to trade the main crypto currency. The decision was hailed by the industry as a game changer.
The main advantage of crypto ETFs is the possibility of gaining exposure to a cryptocurrency without ownership, reducing the risk and cost of holding the asset. Other pros are a lower learning curve and higher security for investors since ETFs take charge of securing the underlying asset holdings. As for the main drawbacks, the main one is that as an investor you can’t have direct ownership of the asset, or, as they say in crypto, “not your keys, not your coins.” Other disadvantages are higher costs associated with holding crypto since ETFs charge fees for active management. Finally, even though investing in ETFs reduces the risk of holding an asset, price swings in the underlying cryptocurrency are likely to be reflected in the investment vehicle too.
추천 기사


