

Crypto Today: Bitcoin, Ethereum, XRP steady rebound as US and Iran conclude positive talks in Doha
- Bitcoin extends its rebound above $60,000 after Qatari mediators reported “positive progress" on indirect US-Iran talks in Doha.
- Ethereum rises for a second consecutive day, supported by marginal improvement in risk sentiment.
- XRP shows potential to extend its recovery, with MACD and RSI momentum indicators rising.
The cryptocurrency market broadly rises on Thursday, reflecting improvement in risk sentiment following an extended period of selling pressure. Bitcoin (BTC) is back above $60,000 after testing support at $58,000 earlier in the week. Ethereum (ETH) aligns with BTC’s positive short-term outlook, rising above $1,600. Similarly, Ripple (XRP) has steadied its rebound, trading above $1.06 amid strengthening momentum indicators.
Qatar reports positive progress in indirect US-Iran talks
Indirect peace talks between the United States (US) and Iran concluded on Wednesday. According to CNN, the Qatari mediators said that the negotiations made “positive progress” with issues related to the Memorandum of Understanding (MoU) and that both sides agreed to continue discussions.
At the same time, low-level technical talks between US and Iran officials are underway indirectly through Qatar and Pakistan mediators. US Vice President J.D. Vance said that discussions on the nuclear issue are expected to start soon, CNN reported.
Meanwhile, Iran has warned of an “immediate powerful response” to attacks by Israeli Forces, calling on the US to restrain its ally. This development comes in the wake of remarks from Israel’s defense minister, who declared that Iranian Supreme Leader Mojtaba Khamenei is now a direct target.
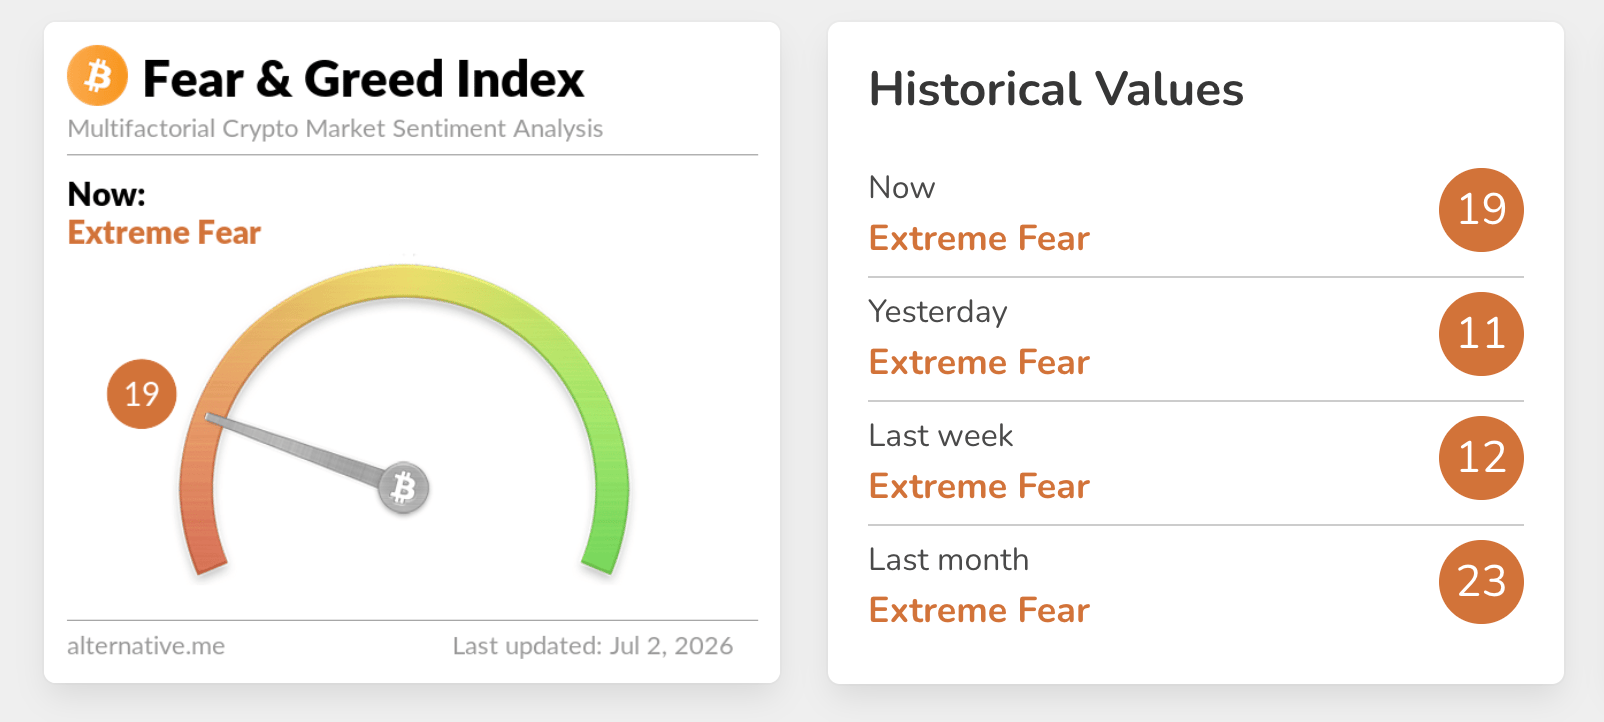
The crypto market has sprung up as risk-off sentiment marginally eases, with Bitcoin, Ethereum and XRP logging in the second straight day of gains. The crypto Fear & Greed Index continues to signal Extreme Fear, but a rise from 11 to 19 suggests an incremental shift in market sentiment. While the uptick is modest, it indicates that investors may be regaining a cautious appetite for risk, improving the outlook for a sustained crypto market rebound.
“What we are witnessing is not the end of Bitcoin's long-term bull cycle but rather a necessary repricing phase that mirrors the evolving global macroeconomic landscape, where cryptocurrencies have become far more sensitive to economic fundamentals than they were just a few years ago,” Simon-Peter Massabni, XS.com Head of Business Development, said in a comment.
Price analysis: Bitcoin tests its recovery potential
Bitcoin is edging higher above $60,000 after respecting support around $58,000, which prompted bulls to reengage. Although the overall technical structure is bearish, indicators signal a potential positive turnaround. The Moving Average Convergence Divergence (MACD) histogram has turned positive on the daily chart, hinting at a tentative recovery attempt, while the Relative Strength Index (RSI) near 39 still reflects subdued momentum rather than a decisive bullish shift.
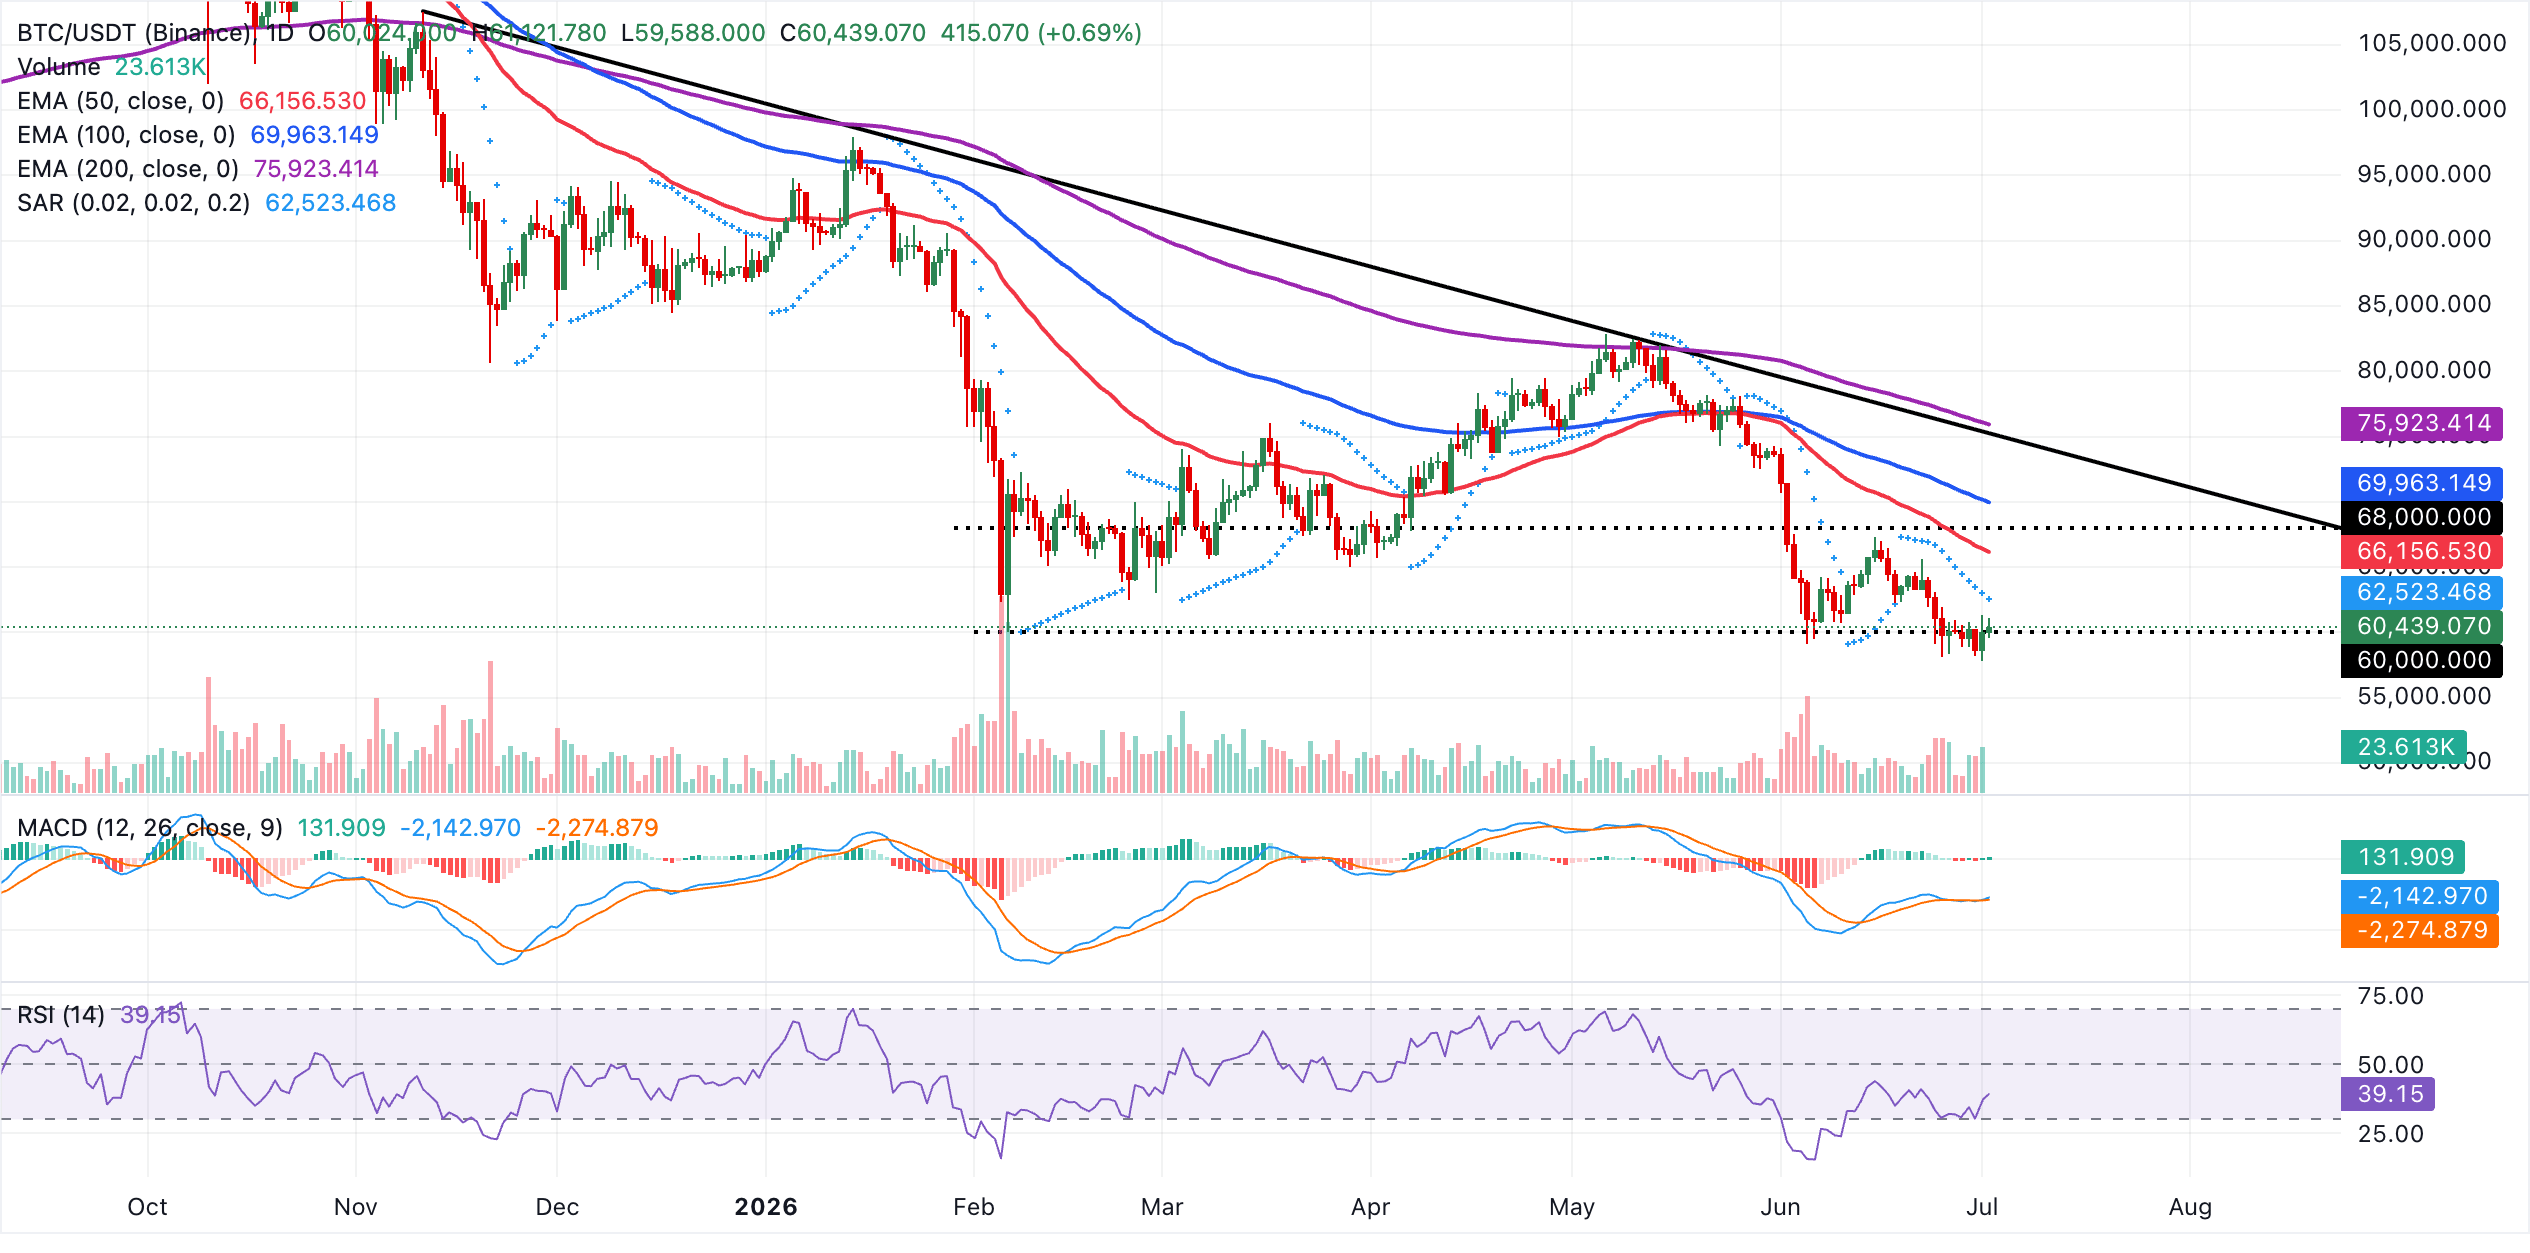
Overhead, the latest Parabolic SAR reading at $62,523 reinforces the notion that the rebound is unfolding within a broader downside context. Above this barrier, the 50-day Exponential Moving Average (EMA) near $66,157, caps the short-term trend. Higher up, the 100-day EMA at roughly $69,963 precedes a more significant hurdle at the downtrend resistance trendline around $75,208, with the 200-day EMA near $75,923 forming a dense structural zone that would need to be reclaimed to neutralize the prevailing bearish bias.
Altcoins technical outlook: Ethereum and XRP gain momentum
Ethereum trades at $1,623 following a brief rebound from the demand range between $1,500 and $1,600. Despite the upswing, ETH maintains a bearish near-term bias as the price holds well below the 50-day, 100-day and 200-day EMAs at $1,808, $1,987 and $2,256 respectively.
Meanwhile, the MACD histogram has turned positive on the daily chart, hinting at an attempt to stabilize losses rather than a decisive bullish reversal. The RSI around 41 on the same chart, reflects subdued demand despite recovering from near oversold conditions.
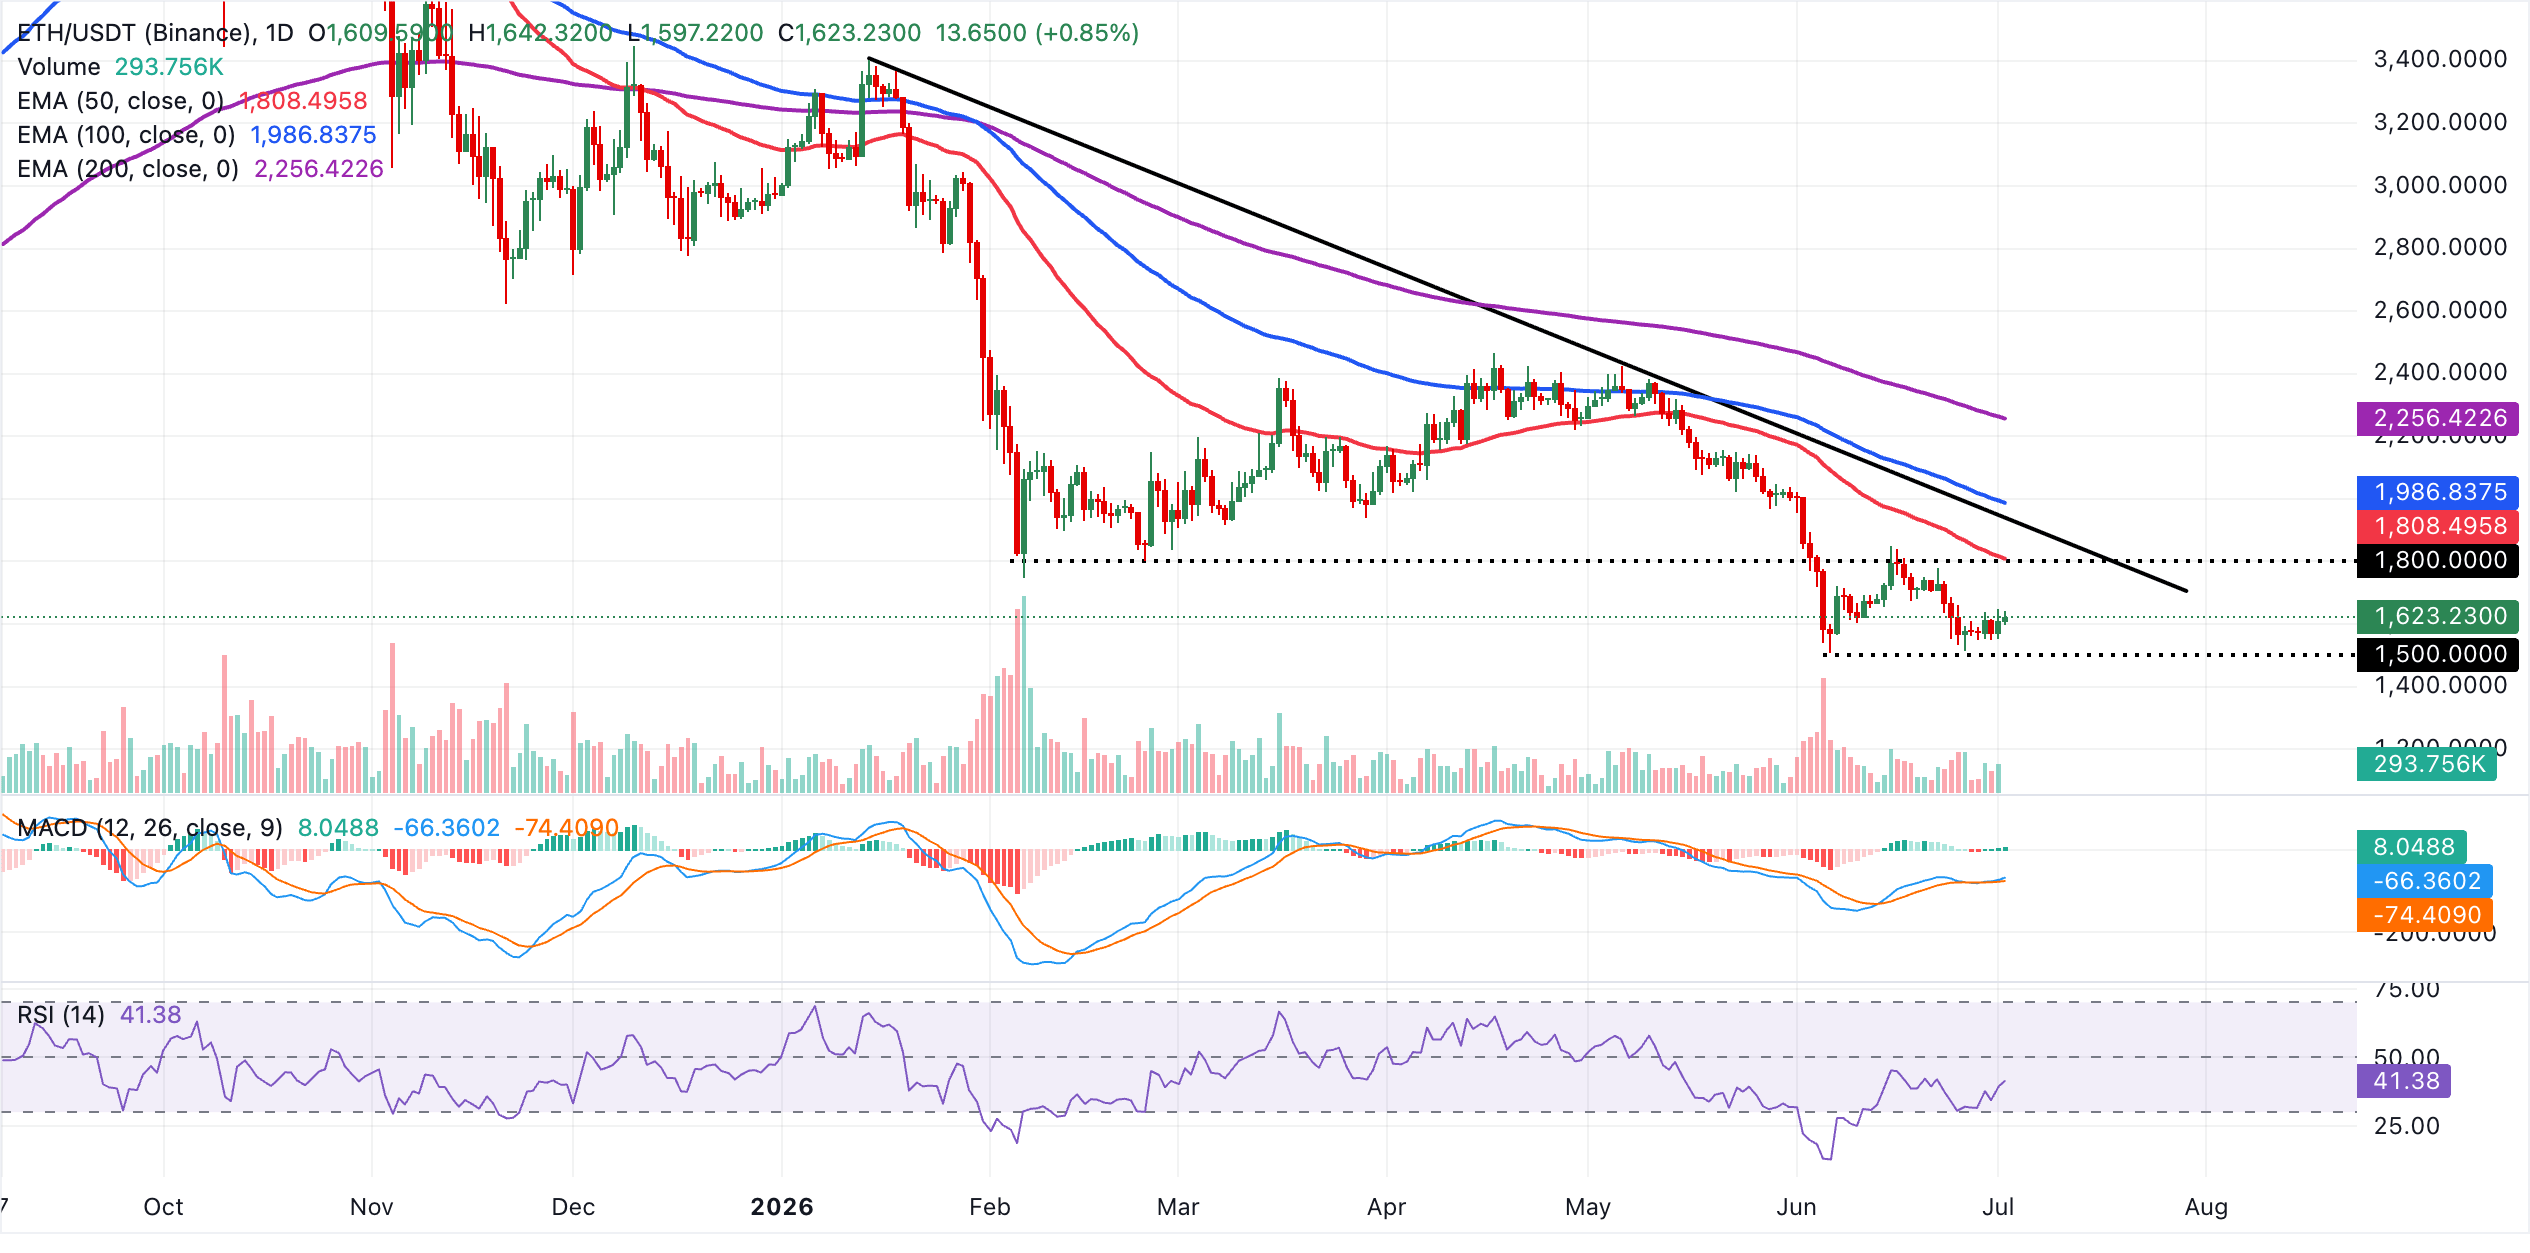
Initial resistance emerges at the 50-day EMA near $1,808, ahead of the break level of the descending trendline at about $1,936, where sellers could reassert control. Further up, the 100-day EMA at roughly $1,987 and the 200-day EMA near $2,256 form a broader supply zone that would need to be reclaimed to negate the current bearish setup and open the way for a more sustained recovery.
As for XRP, the price holds above $1.06, marking a mild increase from the immediate psychological support at $1.03. Despite the uptick in the price, the remittance token sustains a bearish near-term bias as it holds well below the key moving averages.
Momentum is mixed, with the MACD just above zero and slightly positive on the daily chart, hinting at modest stabilisation, while the RSI near 38 still reflects subdued buying interest rather than a decisive recovery.
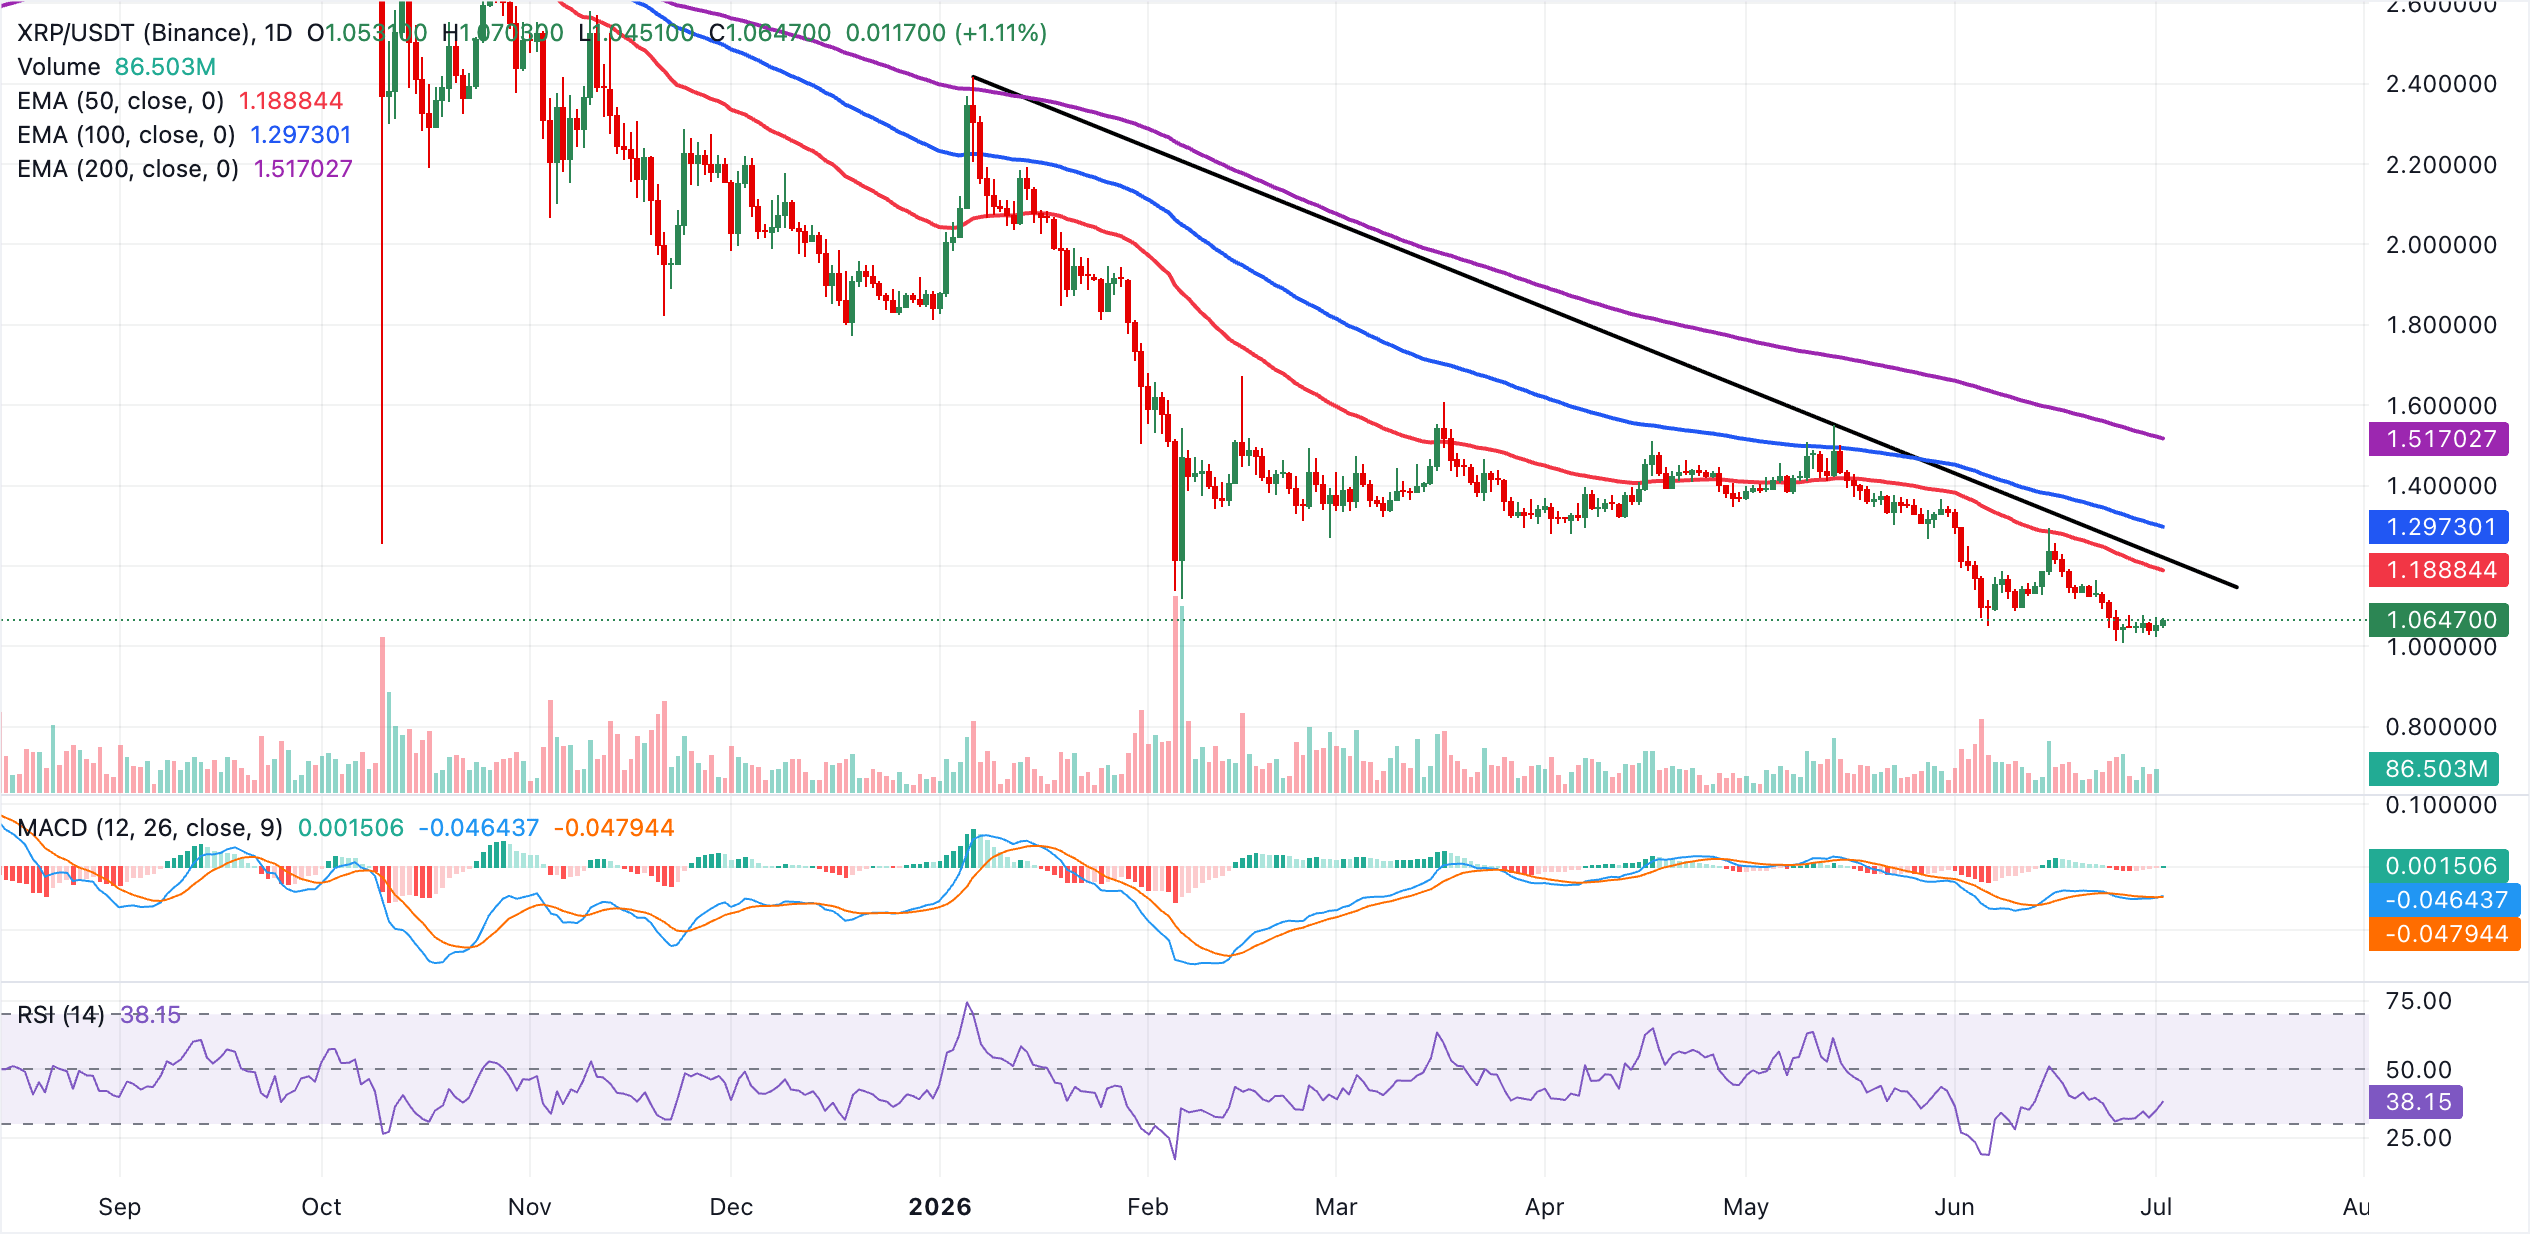
On the topside, immediate resistance lies at the 50-day EMA ($1.19), followed by the 100-day EMA at $1.30, where any advance would likely face renewed selling pressure. A sustained break above these barriers would be needed to challenge the higher structural cap at the 200-day EMA around $1.52 and to ease the prevailing bearish tone.
(The technical analysis of this story was written with the help of an AI tool.)
Bitcoin, altcoins, stablecoins FAQs
Bitcoin is the largest cryptocurrency by market capitalization, a virtual currency designed to serve as money. This form of payment cannot be controlled by any one person, group, or entity, which eliminates the need for third-party participation during financial transactions.
Altcoins are any cryptocurrency apart from Bitcoin, but some also regard Ethereum as a non-altcoin because it is from these two cryptocurrencies that forking happens. If this is true, then Litecoin is the first altcoin, forked from the Bitcoin protocol and, therefore, an “improved” version of it.
Stablecoins are cryptocurrencies designed to have a stable price, with their value backed by a reserve of the asset it represents. To achieve this, the value of any one stablecoin is pegged to a commodity or financial instrument, such as the US Dollar (USD), with its supply regulated by an algorithm or demand. The main goal of stablecoins is to provide an on/off-ramp for investors willing to trade and invest in cryptocurrencies. Stablecoins also allow investors to store value since cryptocurrencies, in general, are subject to volatility.
Bitcoin dominance is the ratio of Bitcoin's market capitalization to the total market capitalization of all cryptocurrencies combined. It provides a clear picture of Bitcoin’s interest among investors. A high BTC dominance typically happens before and during a bull run, in which investors resort to investing in relatively stable and high market capitalization cryptocurrency like Bitcoin. A drop in BTC dominance usually means that investors are moving their capital and/or profits to altcoins in a quest for higher returns, which usually triggers an explosion of altcoin rallies.
추천 기사


