

Ripple Price Forecast: XRP bulls aim for $1.20 breakout despite ETF outflows, fading retail interest
- XRP gains momentum, trading above $1.07 on Thursday, raising odds for a short-term breakout to $1.20.
- XRP shows a short-term recovery bias despite sustained spot ETF outflows and a persistent drawdown in futures Open Interest.
- XRP’s technical momentum indicators are showing early signs of strengthening, as the RSI rises toward its midline and the MACD upholds a bullish crossover.
Ripple (XRP) grinds higher on Thursday, trading above $1.07. This comes after the remittance token tested support at $1.03 amid heavy selling pressure that has dominated the crypto market in recent weeks.
Investors are showing fresh interest in risk assets amid reports that the just-concluded talks between the United States (US) and Iran yielded “positive progress” in Doha. According to Qatari mediators, progress was made on issues related to the Memorandum of Understanding (MoU), and both parties agreed to continue discussions.
XRP sustains capital outflows
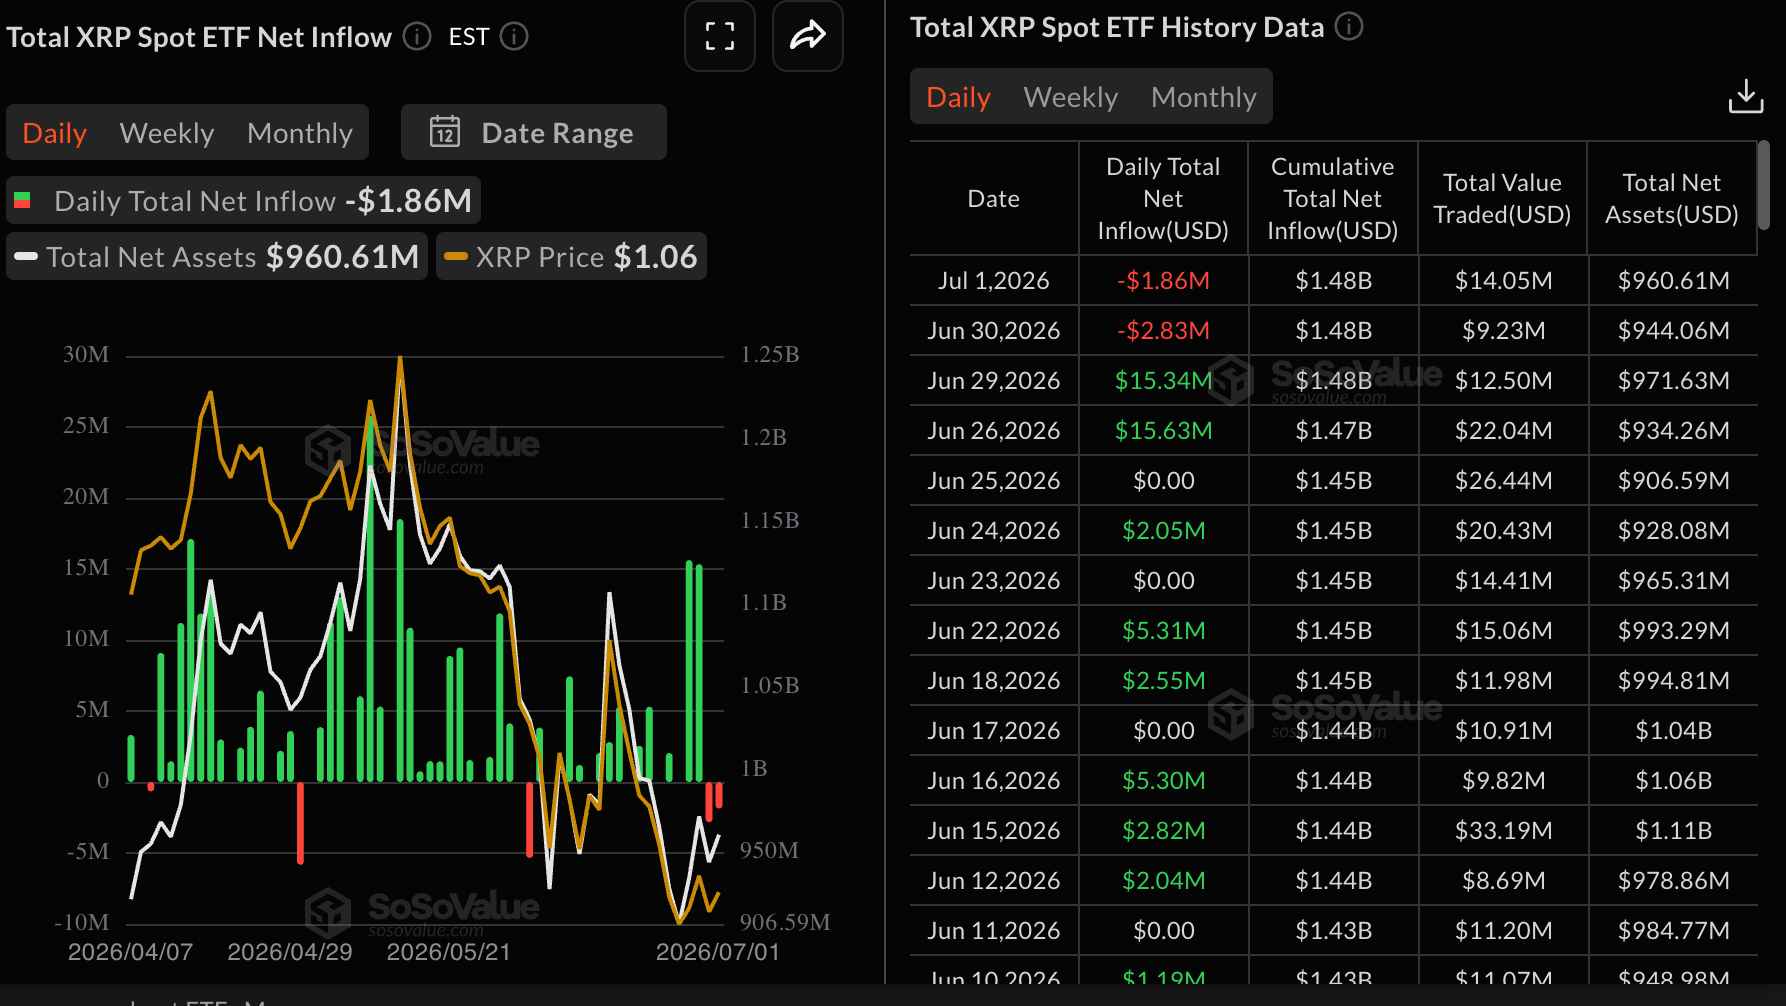
Institutional interest in XRP remains on the back foot, as evidenced by a two-day bearish streak. SoSoValue data show nearly $2 million in mild outflows on Wednesday, following roughly $3 million on Tuesday. Sustained outflow suggests that risk-averse sentiment is dominant, which may cap XRP’s ongoing rebound in the short term.
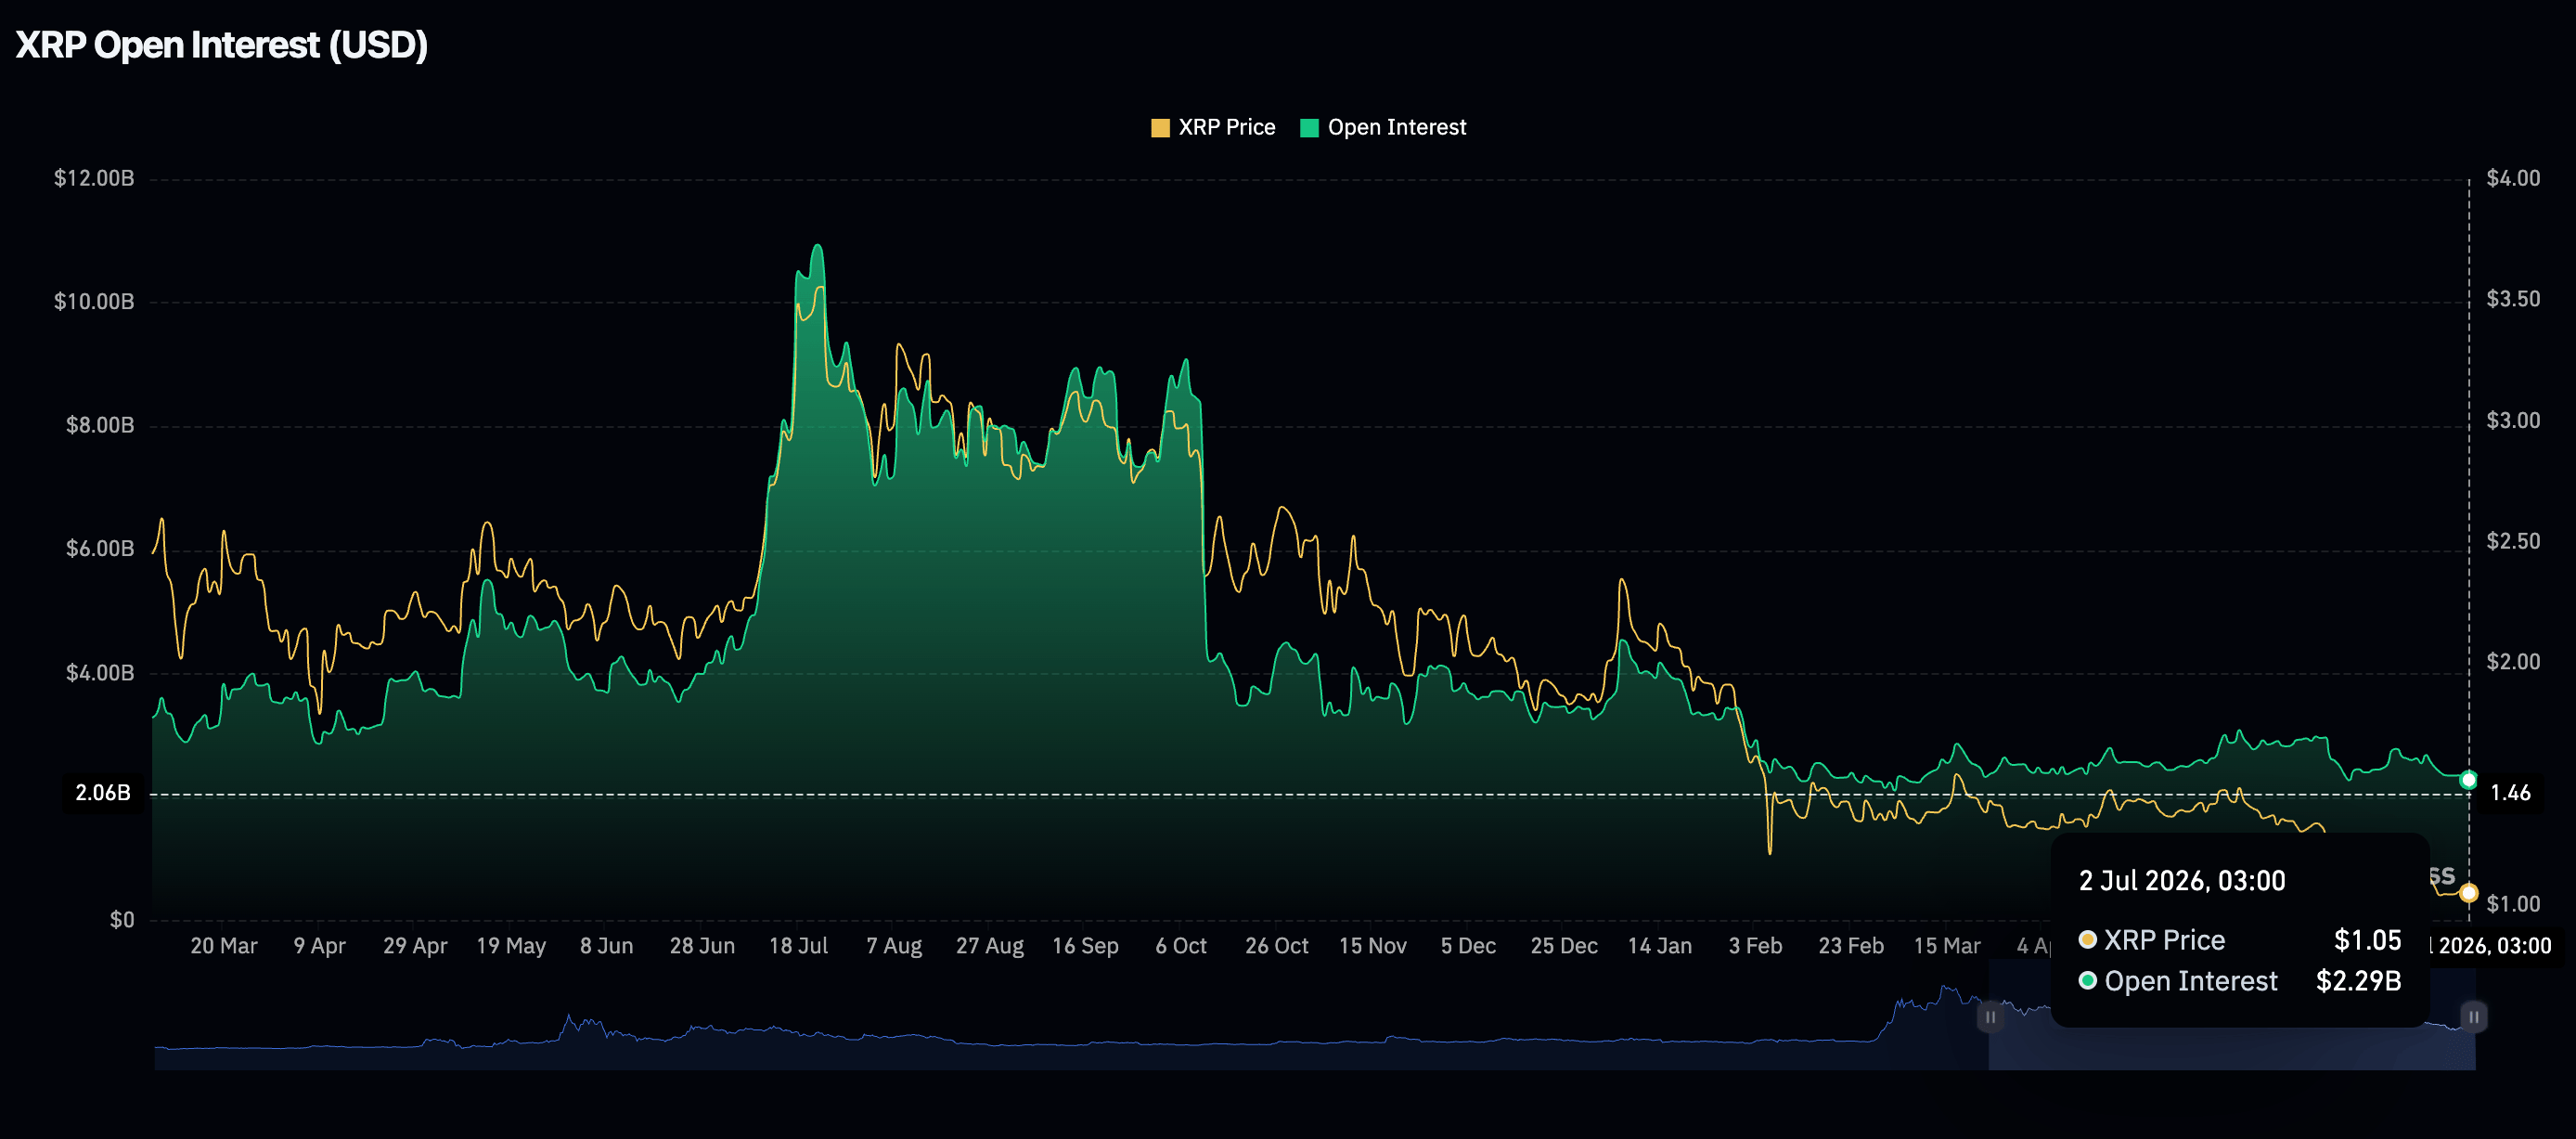
Retail demand continues to diminish, with futures Open Interest (OI) falling to $2.29 billion on Thursday, from $2.31 billion the day before. A broader scope cements a lack of investor confidence in XRP’s short to medium-term outlook. In other words, bears are willing to pay a premium to keep shorting XRP while bulls shun opening new long positions.
Price analysis: XRP builds momentum for short-term breakout
XRP trades at $1.07, extending its recovery from support testes at $1.03. Despite the upswing, the token appears to maintain a bearish near-term bias as the price remains below the key Exponential Moving Averages (EMAs). The 50-day EMA at $1.19, the 100-period EMA at $1.30 and the 200-day EMA at $1.52 all sit overhead as dynamic resistance, reinforcing the broader downside structure.
XRP also hovers beneath the Bollinger Bands' middle boundary at $1.11, while the potential trendline break area around $1.22 adds another cap on recovery attempts.
Momentum is mixed, with the Relative Strength Index (RSI) above 40 on the daily chart still below the neutral 50 line even as the Moving Average Convergence Divergence (MACD) histogram turns marginally positive, hinting at a modest improvement in short-term pressure.
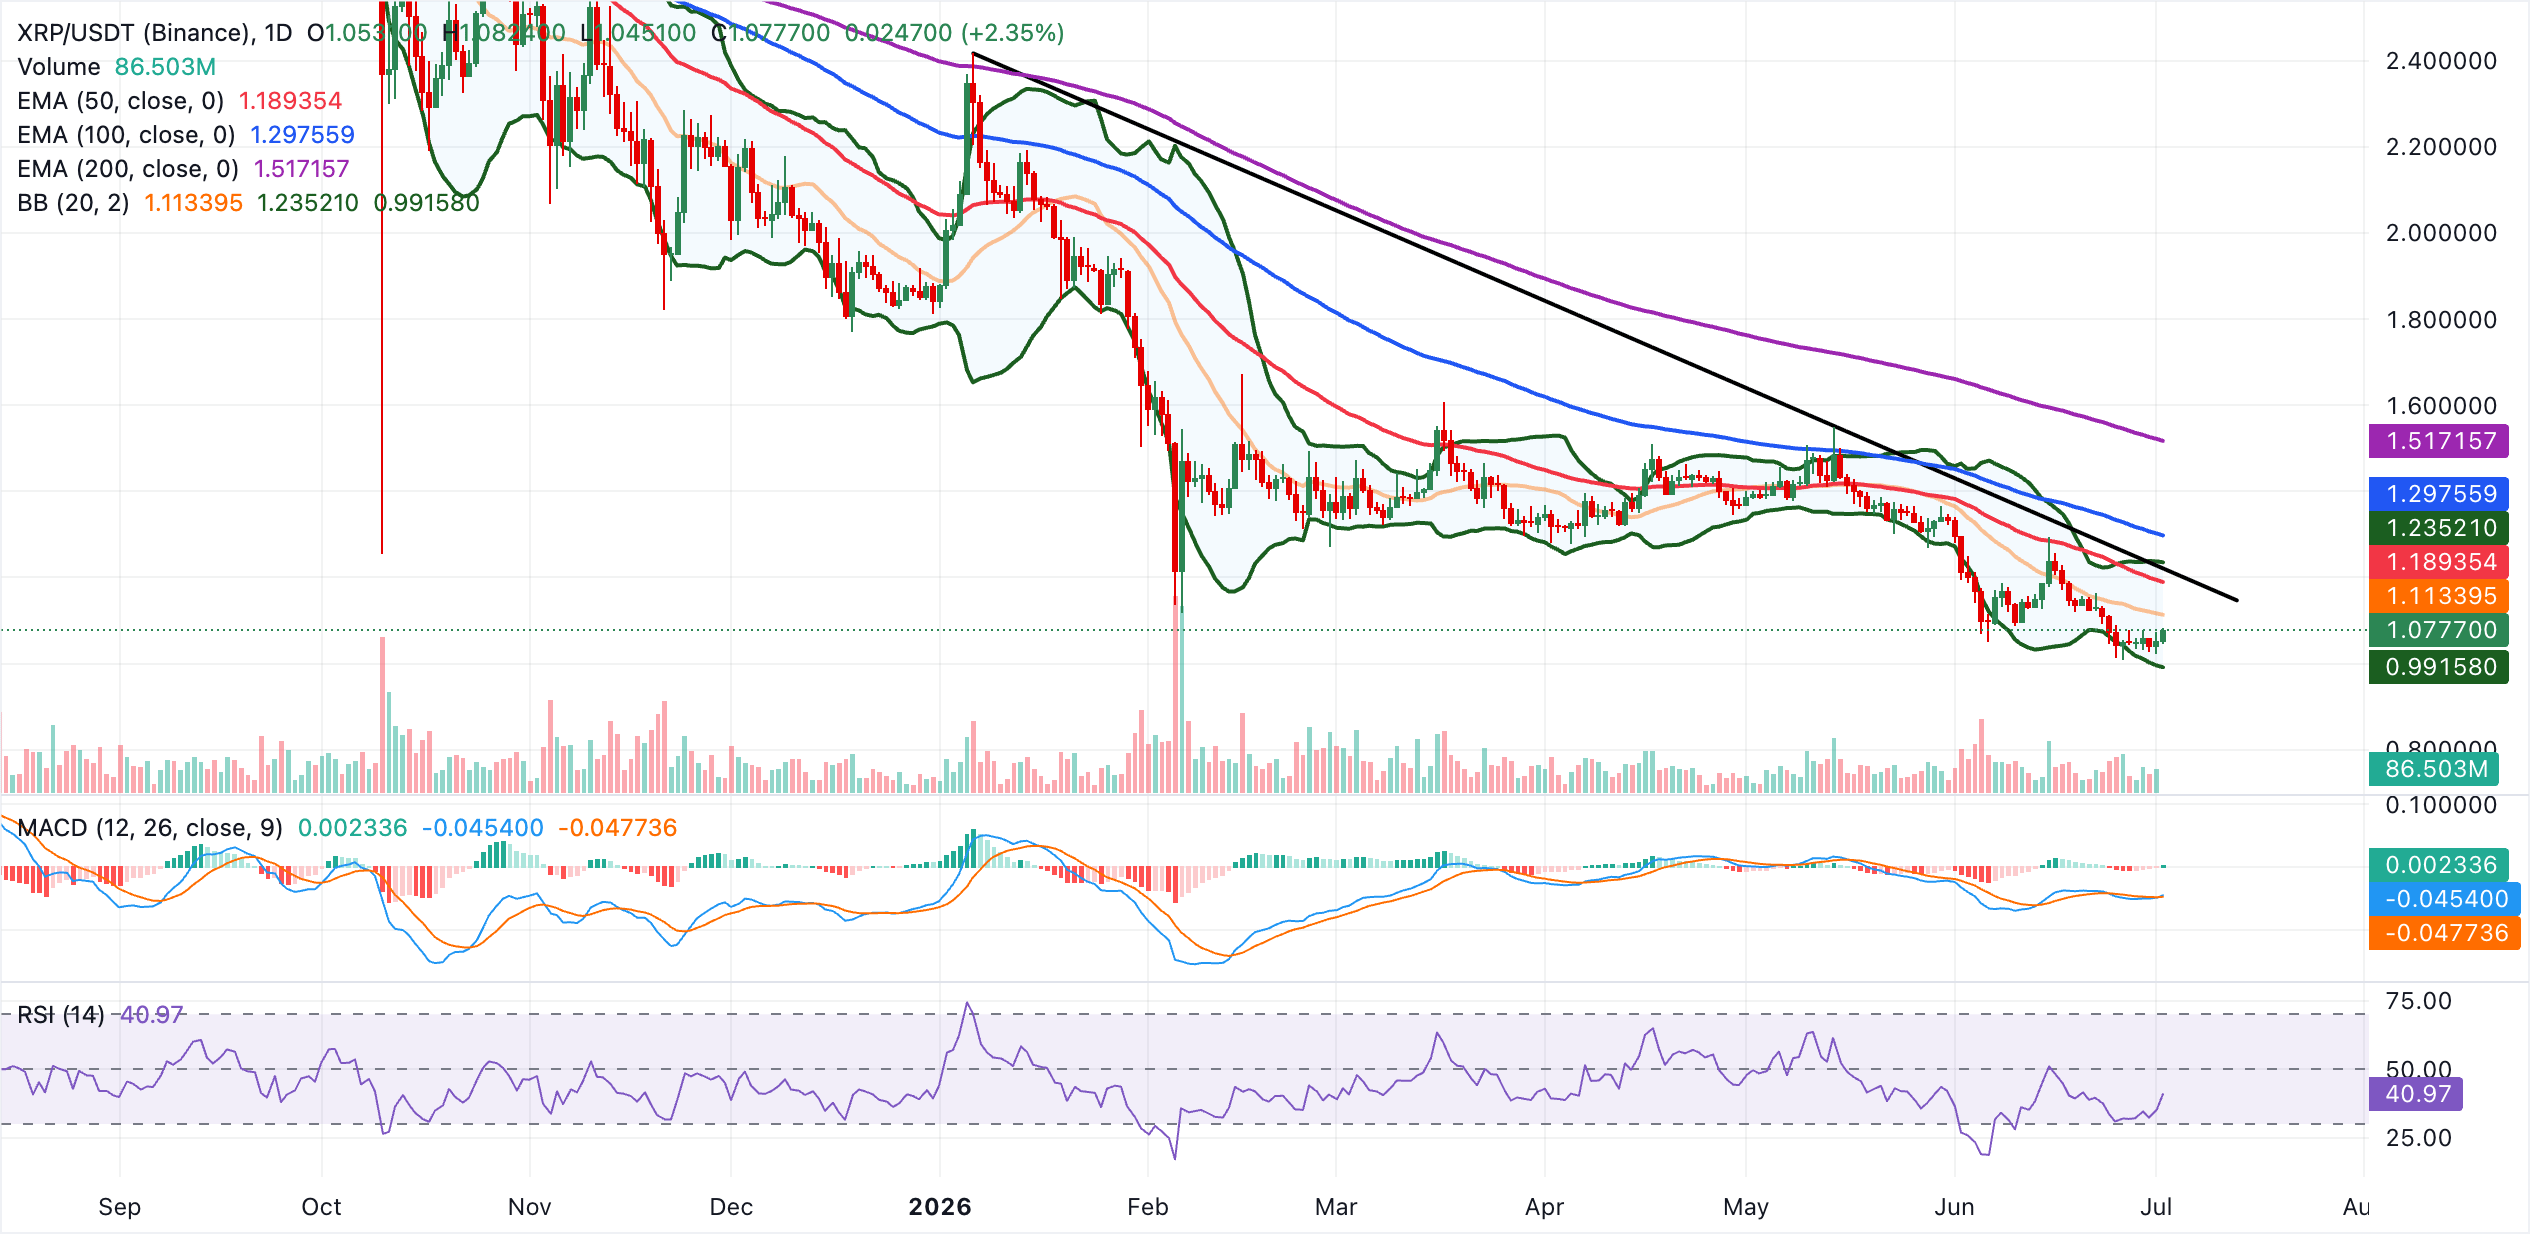
Initial resistance lies at the Bollinger middle band at $1.11, followed by the 50-day EMA near $1.19 and the downward trendline region around $1.22. A stronger bullish extension would need a daily close above the Bollinger upper band at $1.24 to target the 100-day EMA at $1.30, with the 200-day EMA at $1.52 acting as a more distant structural ceiling.
On the flip side, the Bollinger lower band at $0.99 stands as the next notable support likely to attract fresh interest from buyers.
(The technical analysis of this story was written with the help of an AI tool.)
Crypto ETF FAQs
An Exchange-Traded Fund (ETF) is an investment vehicle or an index that tracks the price of an underlying asset. ETFs can not only track a single asset, but a group of assets and sectors. For example, a Bitcoin ETF tracks Bitcoin’s price. ETF is a tool used by investors to gain exposure to a certain asset.
Yes. The first Bitcoin futures ETF in the US was approved by the US Securities & Exchange Commission in October 2021. A total of seven Bitcoin futures ETFs have been approved, with more than 20 still waiting for the regulator’s permission. The SEC says that the cryptocurrency industry is new and subject to manipulation, which is why it has been delaying crypto-related futures ETFs for the last few years.
Yes. The SEC approved in January 2024 the listing and trading of several Bitcoin spot Exchange-Traded Funds, opening the door to institutional capital and mainstream investors to trade the main crypto currency. The decision was hailed by the industry as a game changer.
The main advantage of crypto ETFs is the possibility of gaining exposure to a cryptocurrency without ownership, reducing the risk and cost of holding the asset. Other pros are a lower learning curve and higher security for investors since ETFs take charge of securing the underlying asset holdings. As for the main drawbacks, the main one is that as an investor you can’t have direct ownership of the asset, or, as they say in crypto, “not your keys, not your coins.” Other disadvantages are higher costs associated with holding crypto since ETFs charge fees for active management. Finally, even though investing in ETFs reduces the risk of holding an asset, price swings in the underlying cryptocurrency are likely to be reflected in the investment vehicle too.
추천 기사


