

Ripple Price Forecast: What seven straight weeks of ETF inflows mean as XRP recovers above $1.15
- XRP steadies its recovery, trading above $1.15 on Monday, aligning with a broadly rising crypto market.
- XRP spot ETFs log seven consecutive weeks of inflows, suggesting steady institutional interest despite sticky risk-off sentiment.
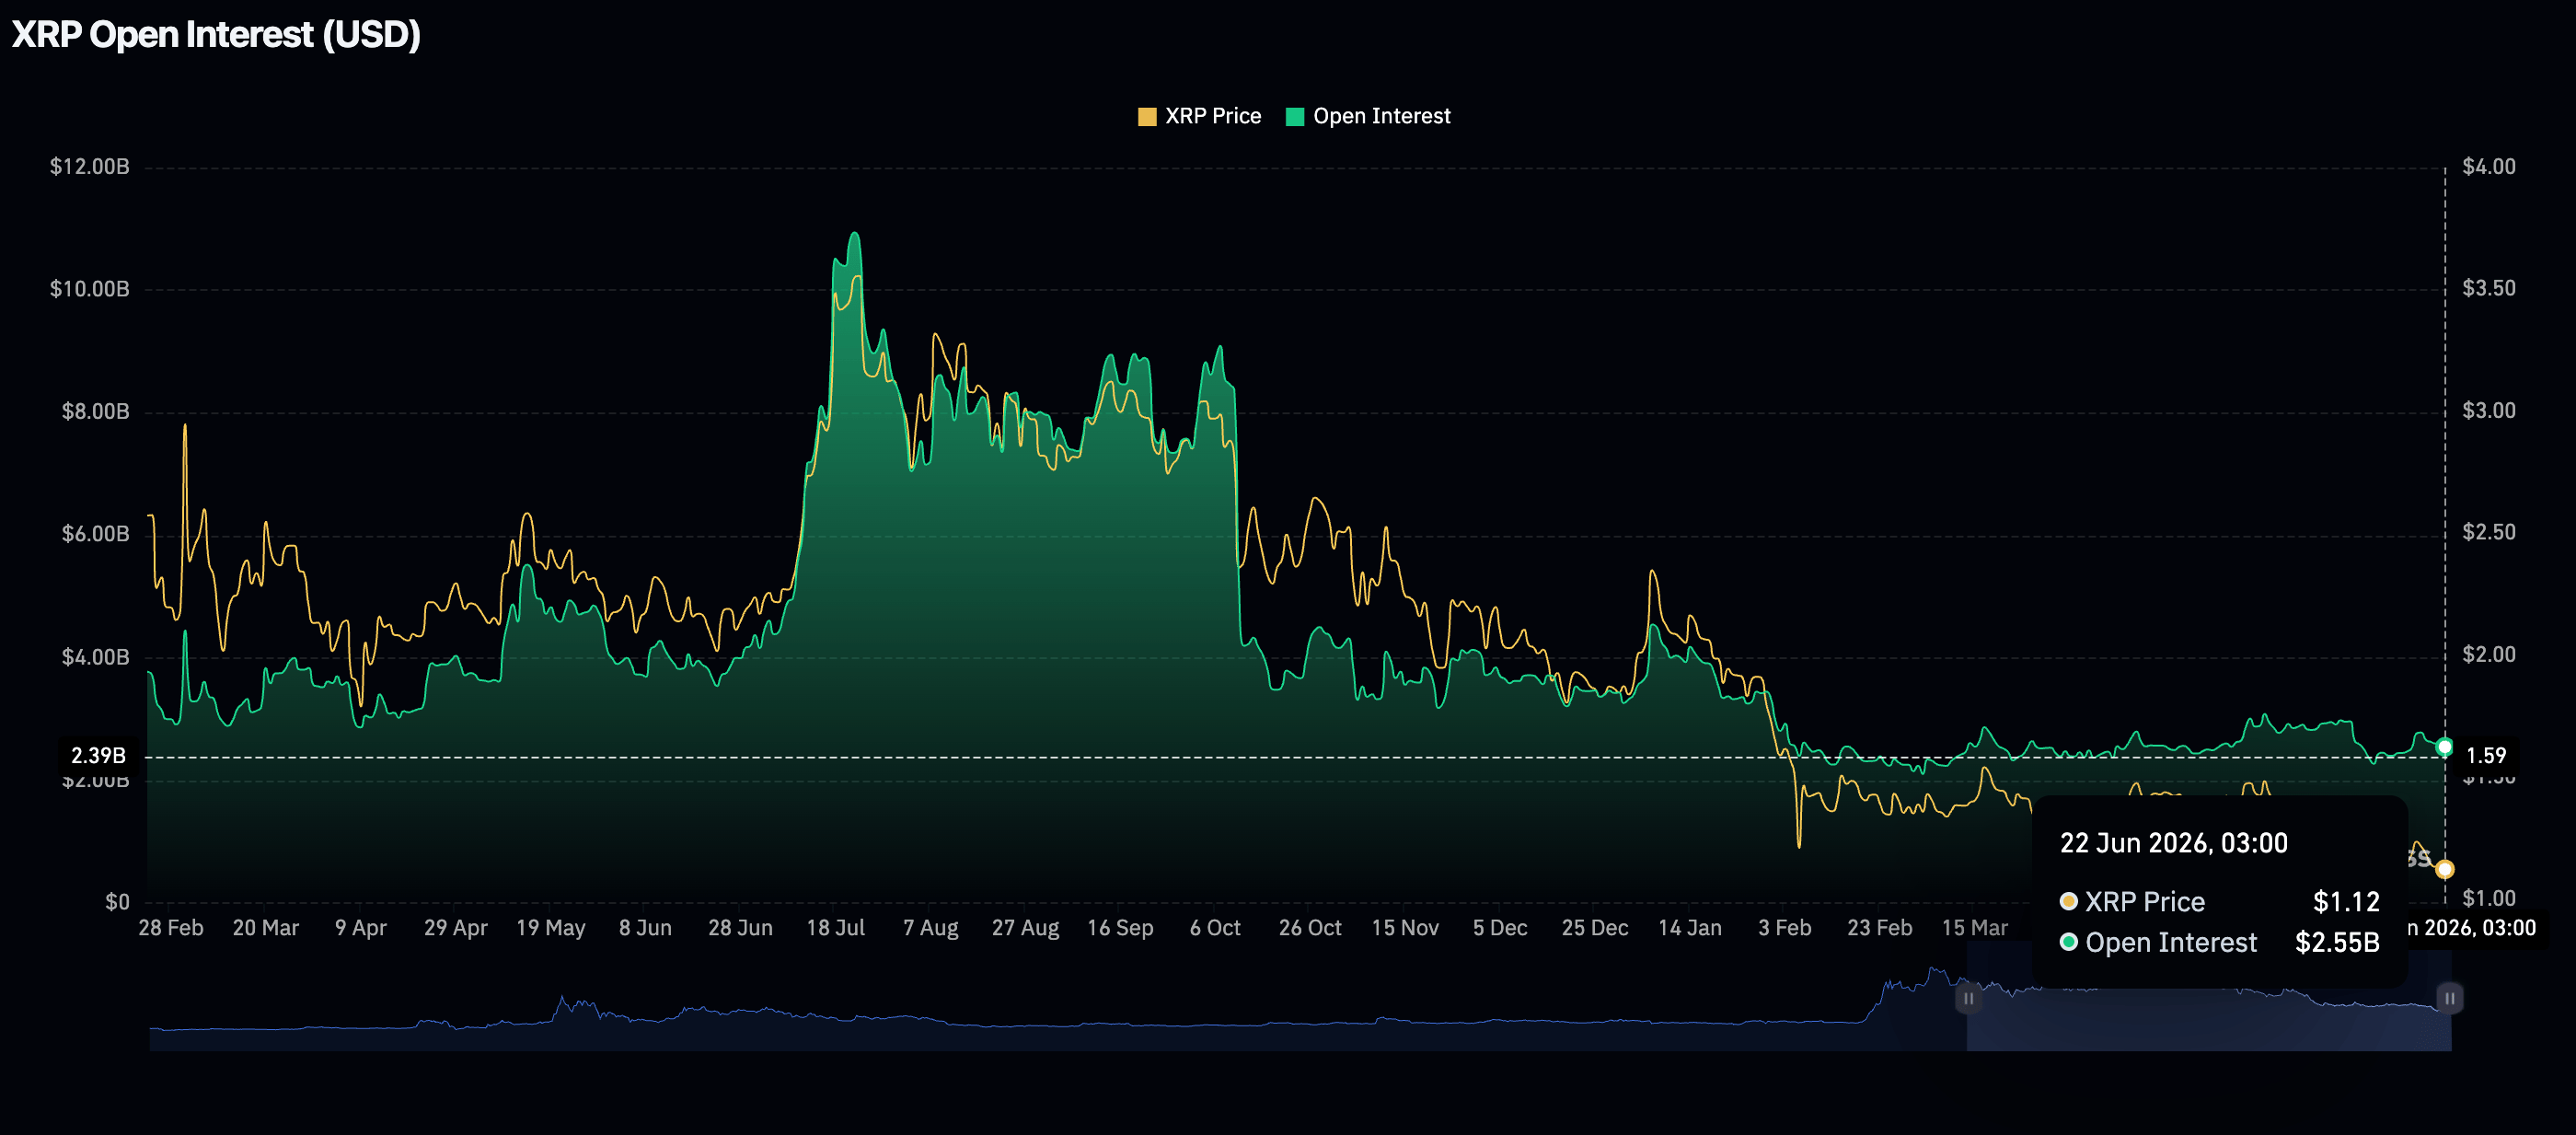
- Subdued retail demand, with futures Open Interest fading to $2.55 billion and a weak technical structure, could limit XRP’s recovery outlook.
Ripple (XRP) gains momentum on Monday, trading above $1.15 as the crypto market widely recovers. This recovery comes amid easing geopolitical tensions in the Middle East, following reports that the United States (US) and Iran made progress in the first round of talks aimed at achieving a lasting peace agreement.
Despite the two nations agreeing on an initial framework targeting a final agreement within 60 days, Israel’s attacks on Lebanon could complicate the existing ceasefire.
Meanwhile, US President Donald Trump has warned Iran to “stop their highly paid PROXIES in Lebanon from causing trouble.” Trump added that “if they don’t, we’ll hit Iran very hard again, just like we did last week, only harder!!!”
XRP attracts steady institutional interest
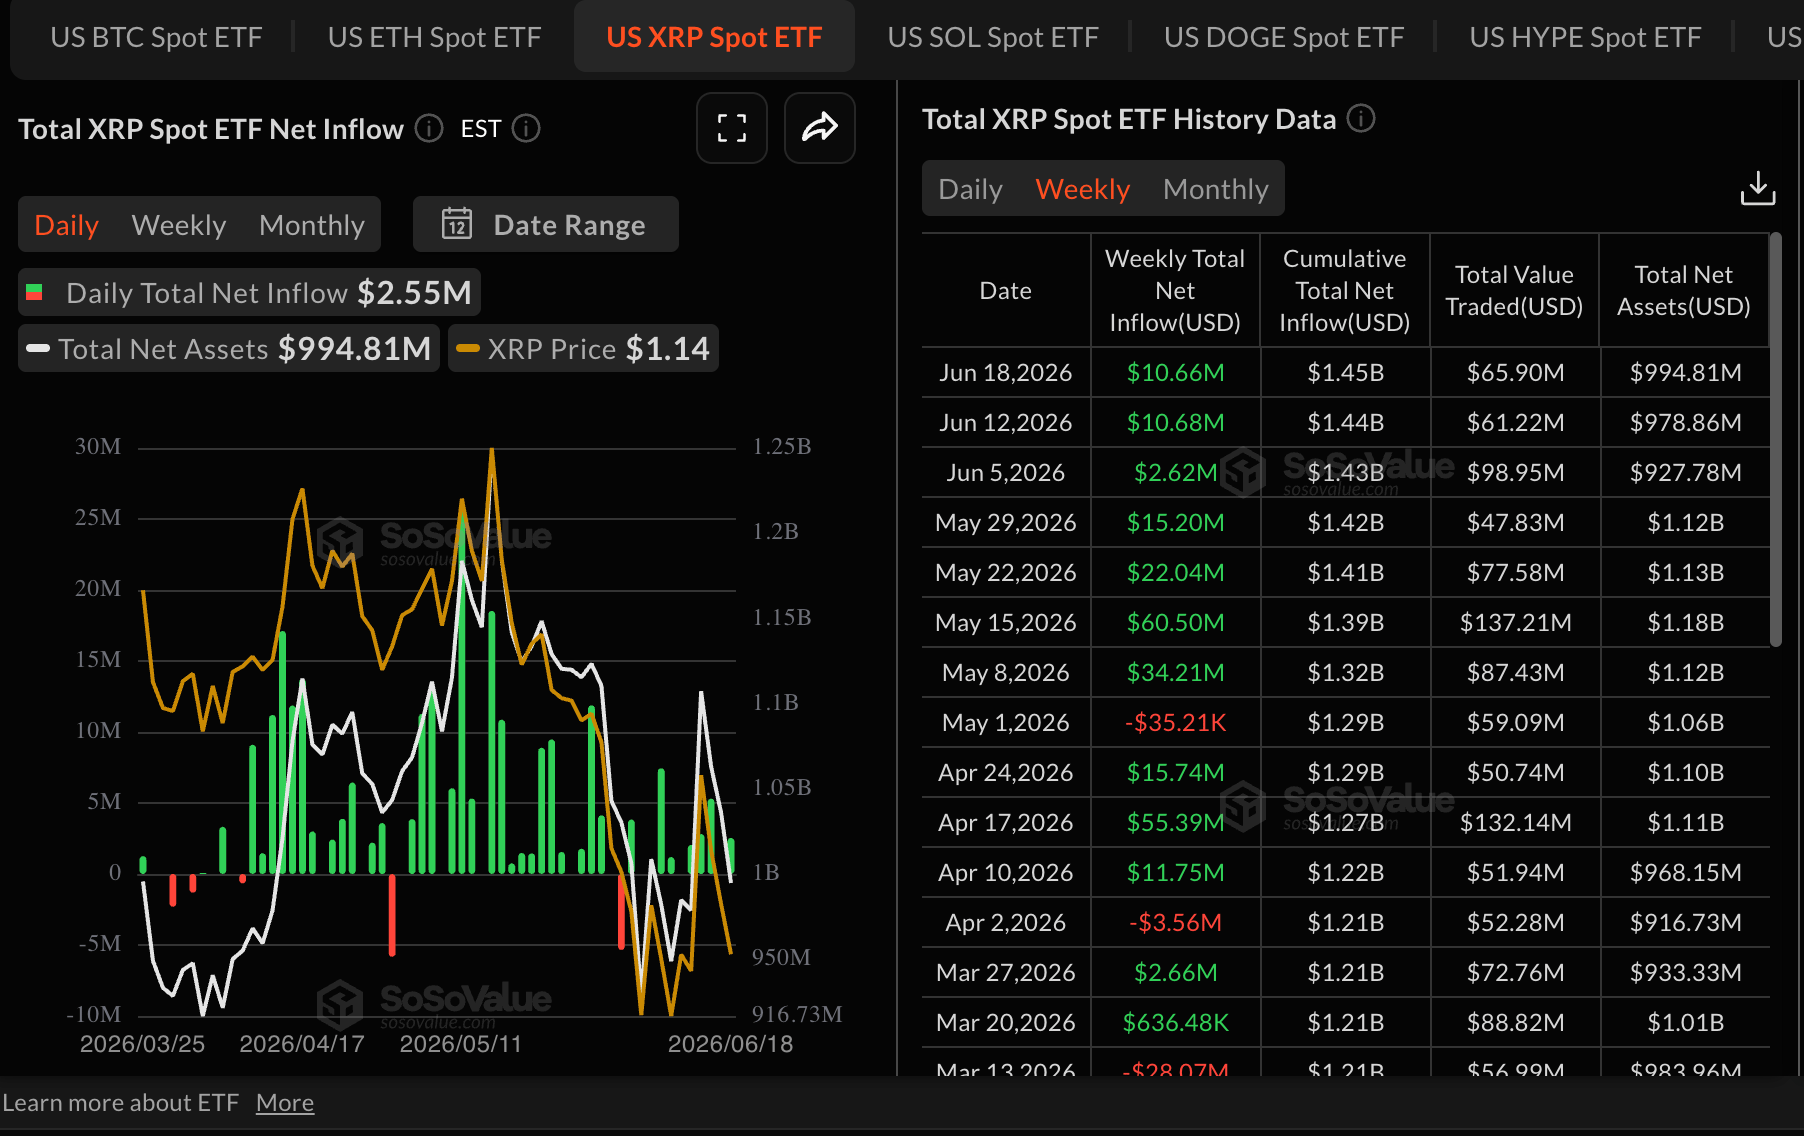
Institutional investors looking to gain exposure to cryptocurrencies through spot Exchange-Traded Funds (ETFs) have consistently increased their allocations to XRP in recent weeks. According to SoSoValue, XRP ETFs have now recorded seven straight weeks of net inflows.
Inflows amounted to $11 million last week. Cumulative inflows stand at $1.45 billion, while net assets under management average $995 million.
While inflows have been moderate, the persistent demand for US-listed XRP spot ETFs signals that institutional investors maintain a constructive outlook on XRP’s near to mid-term recovery potential.
“Focus remains on regulation, payments adoption, and broader altcoin sentiment. The Federal Reserve (Fed) is signalling higher interest rates for longer, which has larger implications for investor confidence,” said Anil Oncu, Bitpace CEO.
An expanded scope of the XRP derivatives market paints a grim picture, given futures Open Interest (OI) has faded to $2.55 billion on Monday, down from $2.63 billion the previous day. The subdued OI pales in comparison to the record $10.94 billion reached in July and undermines risk-on sentiment. Market participants remain hesitant to initiate new long positions.
Oncu adds that investors are finding it difficult to price risk assets confidently as “Liquidity stays tighter, and with uncertainty remaining around the future path of interest rates.”
Price analysis: XRP gains momentum as bulls tighten grip
XRP is maintaining a strong position above the recently recaptured $1.15 support level, signaling robust buy-the-dip activity among investors. Nevertheless, persistent bearish momentum prevails, with the spot price continuing to trade significantly below major moving averages. The nearest dynamic cap aligns with the 50-day Exponential Moving Average (EMA) around $1.25, while additional overhead layers sit at the 100-day EMA near $1.35 and the longer-term 200-day EMA close to $1.57.
A descending trendline resistance, projected from prior highs and intersecting ahead of $1.50, reinforces the broader downside bias, even as the Moving Average Convergence Divergence (MACD) histogram remains marginally positive on the daily chart. At the same time, the Relative Strength Index (RSI) improves toward the mid-40s on the same chart, hinting more at consolidation than at a decisive bullish reversal.
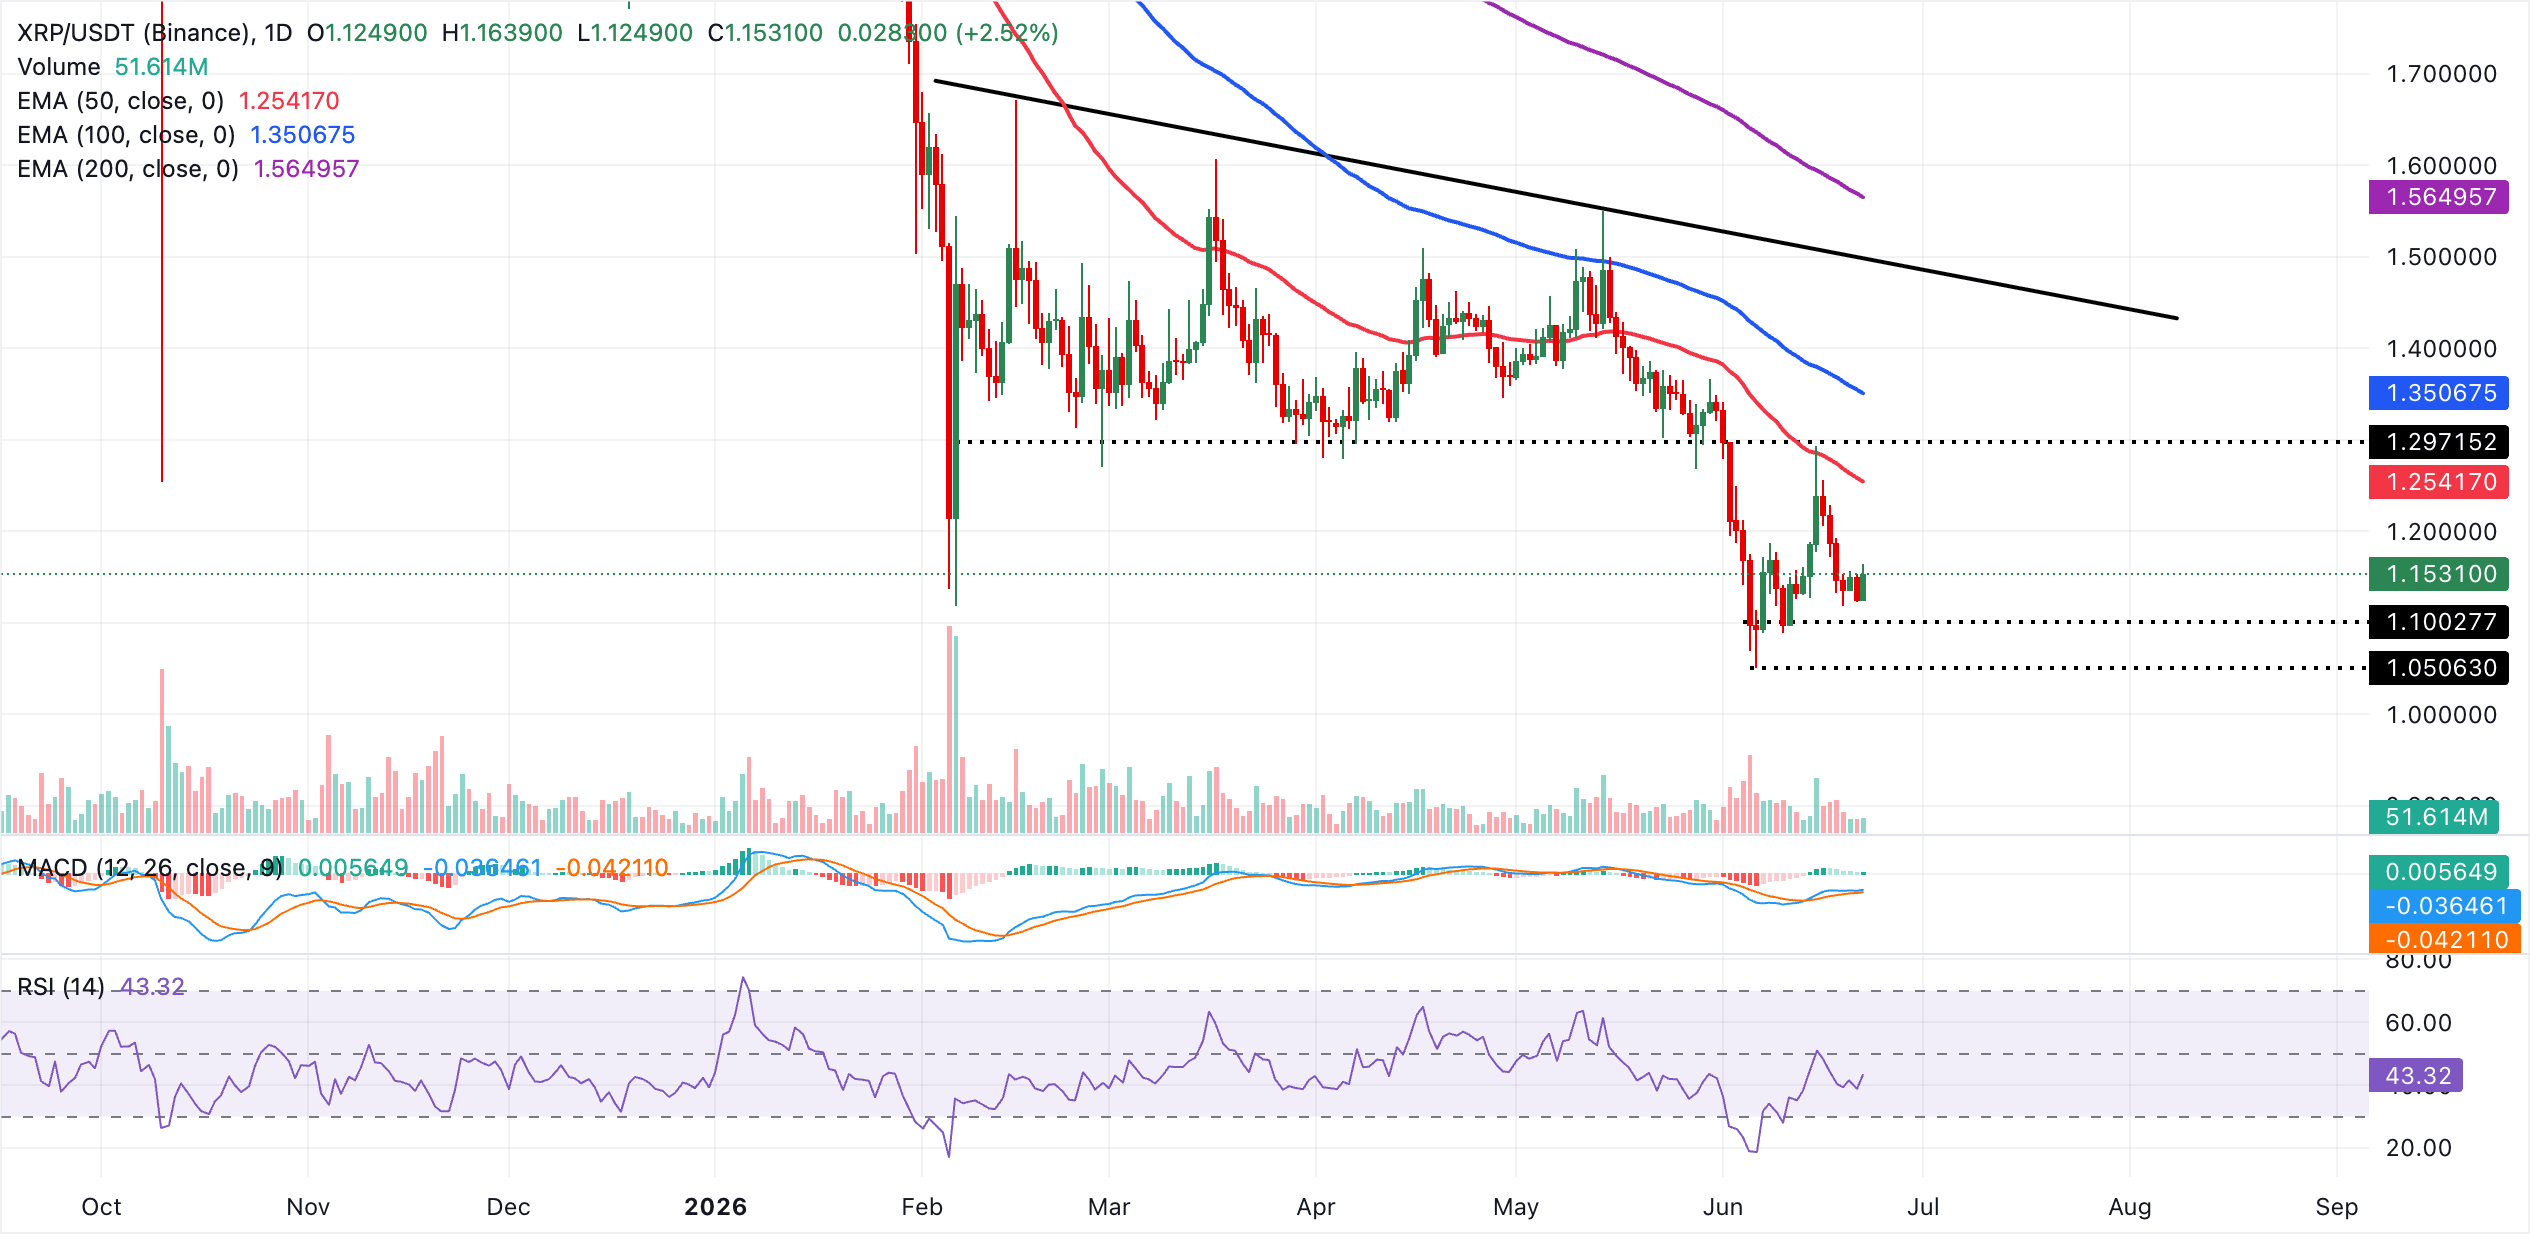
On the topside, bulls would first need to challenge the 50-day EMA at $1.25, with a daily close above that level opening the way toward the 100-day EMA at $1.35 and then the downtrend resistance zone around $1.50. A sustained break of that trendline would be required to expose the more distant 200-day EMA at $1.57 and shift the broader structure into a more constructive phase. Until then, rallies are likely to be treated as corrective within the prevailing bearish framework.
(The technical analysis of this story was written with the help of an AI tool.)
Crypto ETF FAQs
An Exchange-Traded Fund (ETF) is an investment vehicle or an index that tracks the price of an underlying asset. ETFs can not only track a single asset, but a group of assets and sectors. For example, a Bitcoin ETF tracks Bitcoin’s price. ETF is a tool used by investors to gain exposure to a certain asset.
Yes. The first Bitcoin futures ETF in the US was approved by the US Securities & Exchange Commission in October 2021. A total of seven Bitcoin futures ETFs have been approved, with more than 20 still waiting for the regulator’s permission. The SEC says that the cryptocurrency industry is new and subject to manipulation, which is why it has been delaying crypto-related futures ETFs for the last few years.
Yes. The SEC approved in January 2024 the listing and trading of several Bitcoin spot Exchange-Traded Funds, opening the door to institutional capital and mainstream investors to trade the main crypto currency. The decision was hailed by the industry as a game changer.
The main advantage of crypto ETFs is the possibility of gaining exposure to a cryptocurrency without ownership, reducing the risk and cost of holding the asset. Other pros are a lower learning curve and higher security for investors since ETFs take charge of securing the underlying asset holdings. As for the main drawbacks, the main one is that as an investor you can’t have direct ownership of the asset, or, as they say in crypto, “not your keys, not your coins.” Other disadvantages are higher costs associated with holding crypto since ETFs charge fees for active management. Finally, even though investing in ETFs reduces the risk of holding an asset, price swings in the underlying cryptocurrency are likely to be reflected in the investment vehicle too.
추천 기사


