


Crypto Today: Bitcoin, Ethereum, XRP rise slightly as US-Iran peace talks make progress
- Bitcoin holds above $64,000 amid progress towards a lasting US-Iran peace deal during first round of talks in Switzerland.
- Ethereum eyes a short-term breakout above $1,800 but remains largely constrained below major moving averages.
- XRP remains above $1.13 support, lethargically moving upward amid a broadly bearish trend.
Cryptocurrency prices are broadly rising on Monday, with Bitcoin (BTC) reclaiming support above $64,000. Ethereum (ETH) holds above $1,700 as bulls target a short-term breakout above $1,800. Meanwhile, Ripple (XRP) is back above $1.13 after testing the $1.12 support level.
Crypto market sentiment lags despite progress in US-Iran peace talks
The United States (US) and Iran commenced the first round of negotiations in Switzerland over the weekend to secure a lasting peace agreement. Both parties have reportedly agreed on a preliminary framework under which the US would grant a waiver to ease sanctions on Iranian oil exports, a key prerequisite for advancing nuclear discussions.
US and Iranian officials, joined by Qatari mediators, met on Sunday to advance diplomatic efforts in the Middle East region. Notably, US Vice President JD Vance downplayed the impact of recent Israeli strikes in Lebanon, emphasizing that negotiations are yielding tangible results toward de-escalation.
Mediators described the talks as making "encouraging progress," with both sides agreeing to a "roadmap" targeting a final agreement within 60 days, an outcome that could further ease geopolitical risk across crypto markets.
However, US President Donald Trump stated in a post on Truth Social that “Iran must immediately stop their highly paid PROXIES in Lebanon from causing trouble. If they don't, we'll hit Iran very hard again, just like we did last week, only harder!!!”
On the other hand, Iranian negotiators abruptly paused the high-stakes discussions following a series of verbal threats from President Trump. Despite a subtle broader rebound, global markets remain on edge while cryptocurrencies grapple with low interest.
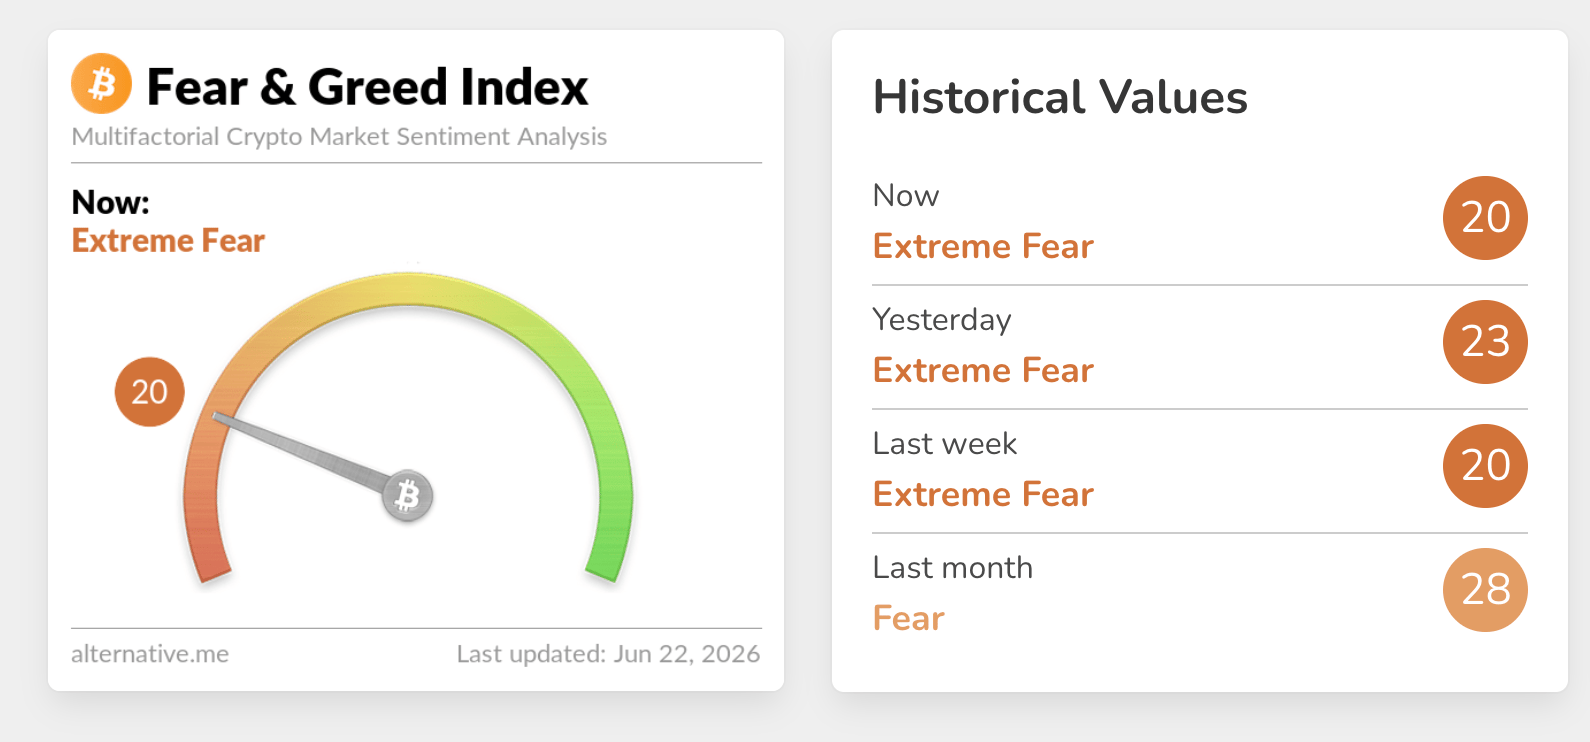
Sentiment is stuck in the Extreme Fear territory, as reflected in the Fear & Greed Index, which holds at 20 on Monday, down from 23 the previous day. In comparison, this metric averaged 28 in May, undermining appetite for risk assets. Persistent risk-off mood could weigh on the dominant bearish outlook.
Price analysis: Bitcoin reclaims key short-term support
Bitcoin trades above $64,202 amid a weak momentum rebound from last week's lows of $62,272. That said, the Crypto King holds a bearish near‑term bias as the price remains below the 50-day, 100-day and 200-day Exponential Moving Averages (EMAs).
The 50-day EMA at roughly $69,093, the 100-day EMA near $72,120 and the 200-day EMA around $77,631 line up as a layered cap above the market, suggesting rallies are likely to face supply while the Relative Strength Index (RSI) hovers in the low-40s on the daily chart.
A positive Moving Average Convergence Divergence (MACD) histogram hints that downside momentum is not aggressive, but it does little to change the overarching capped structure while spot trades under these key trend averages.
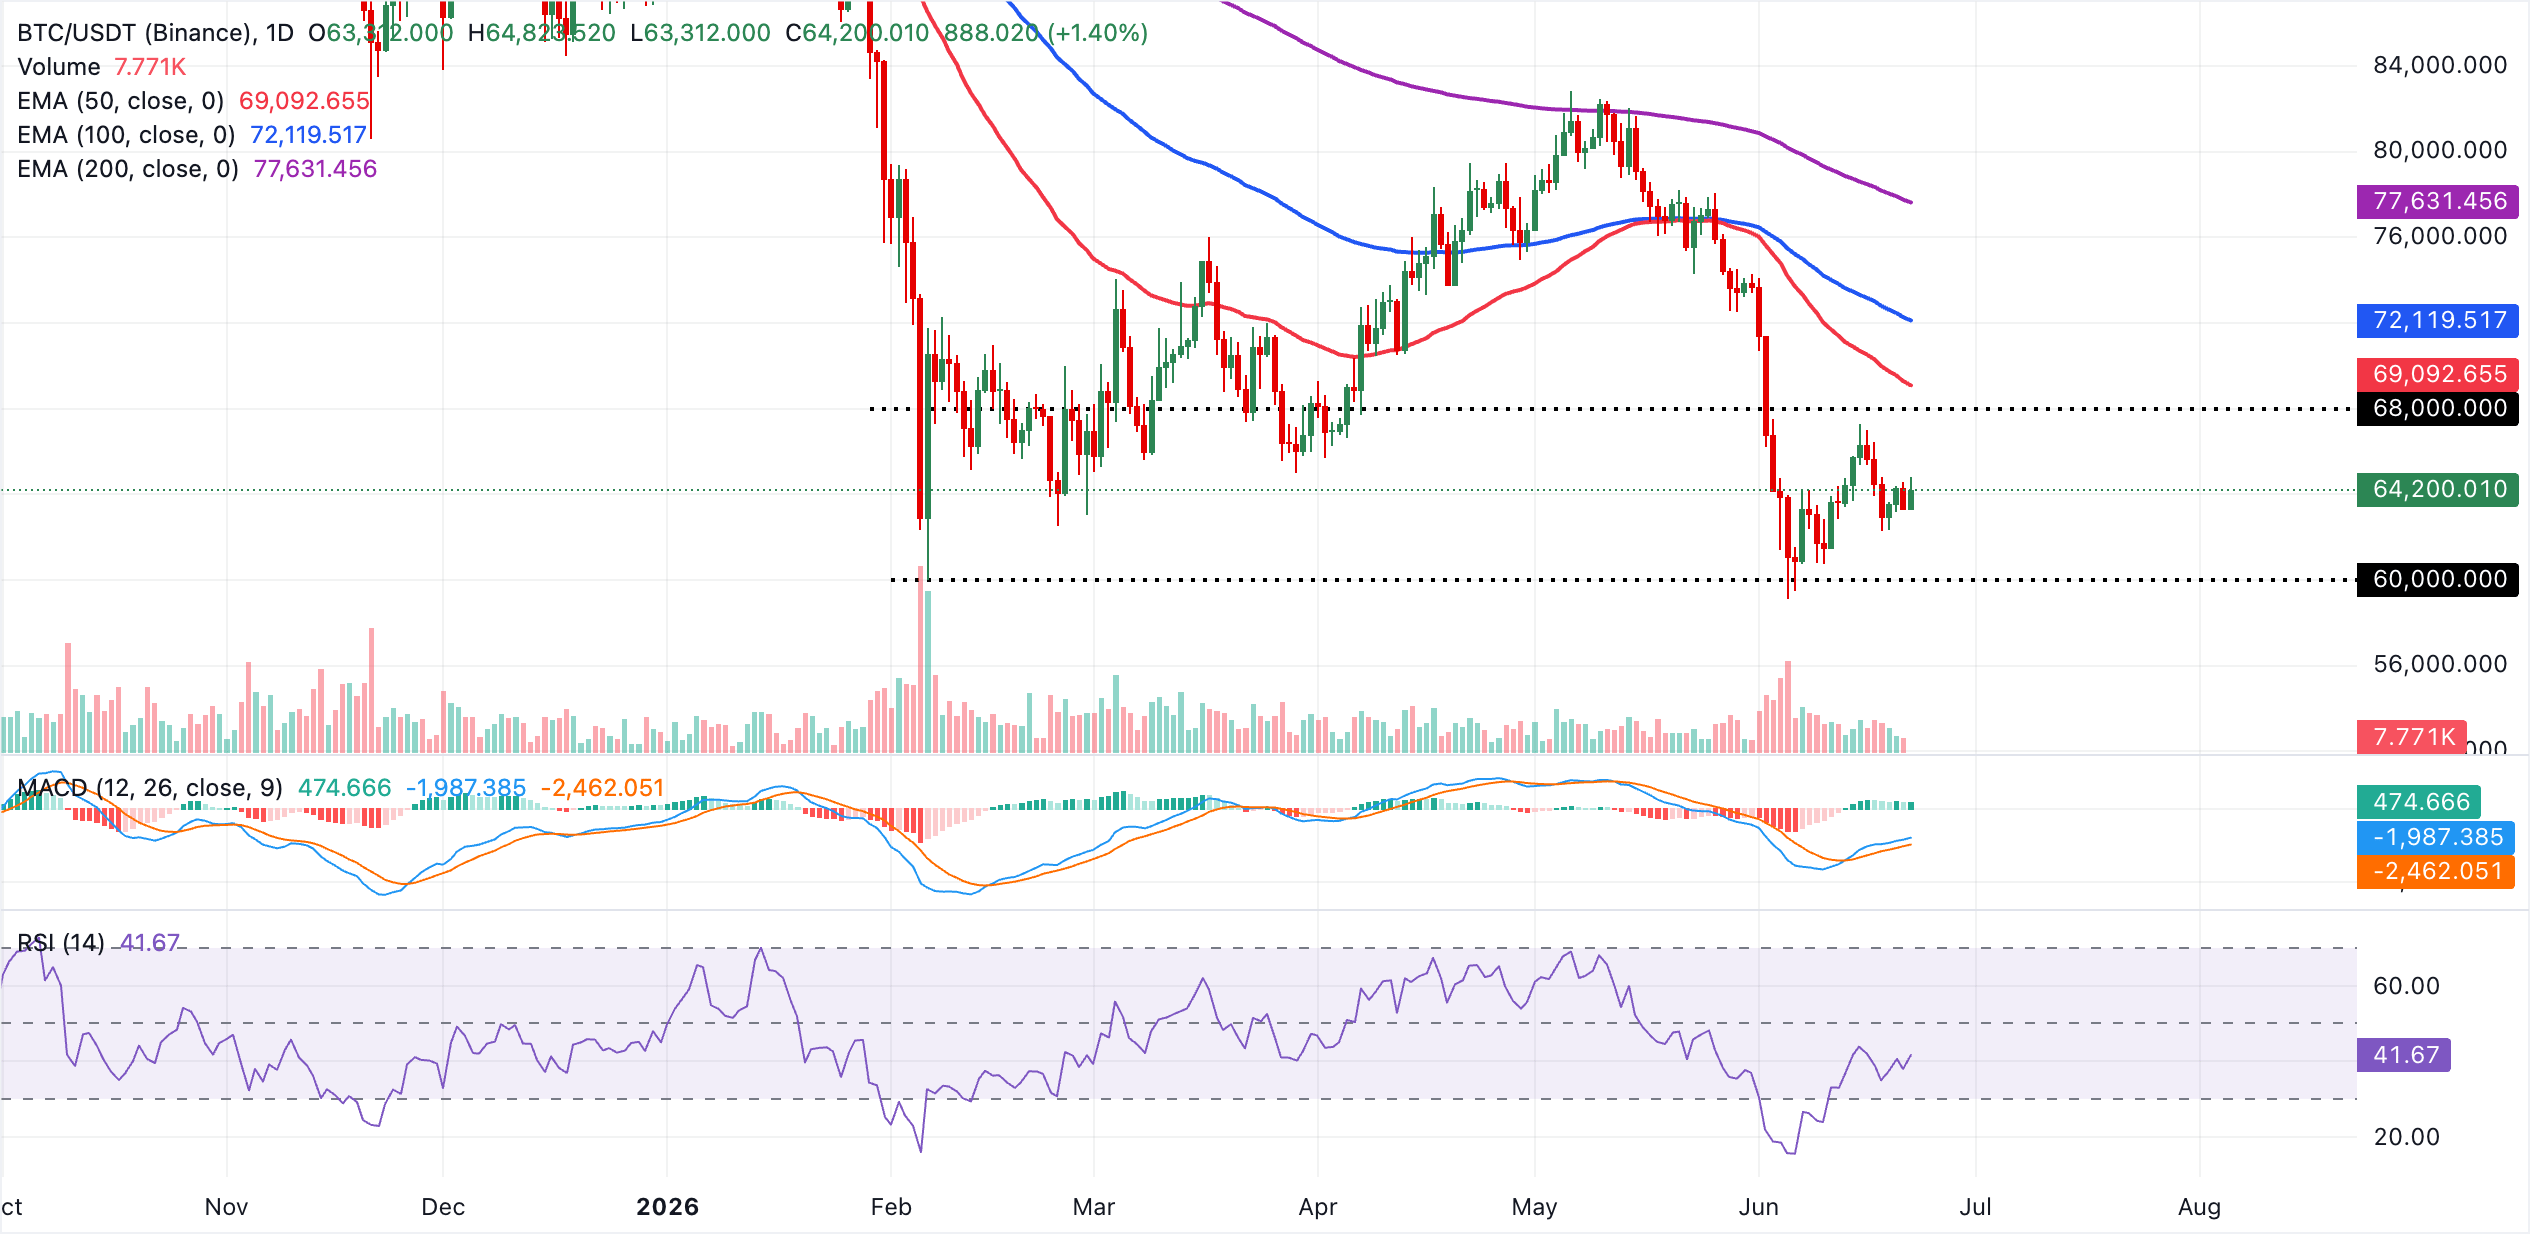
On the topside, immediate resistance lies at the 50-day EMA around $69,093, with further barriers at the 100-day EMA near $72,120 and the 200-day EMA close to $77,631, forming a broad supply band that would need to be reclaimed to ease the current bearish tone. With no nearby structural supports highlighted by the available indicators, buyers would seek to reengage at key psychological areas, including last week's lows of $62,272 and $60,000.
Altcoins technical outlook: Ethereum and XRP test rebound strength
Ethereum trades at $1,745 as bulls extend a mild recovery from the previous week lows at $1,672. The pair remains under broader downside pressure as the spot price holds below the clustered moving averages, with the 50-day EMA near $1,912, the 100-day EMA around $2,073, and the 200-day EMA close to $2,344, all reinforcing a capped bias.
A descending resistance trendline, now coming in just above price near $1,750, continues to frame the recovery as a mere bounce within a broader downtrend. Momentum signals are mixed with the RSI below the midline, while the MACD histogram in the positive region, hinting that any rebound could be corrective rather than a trend change.
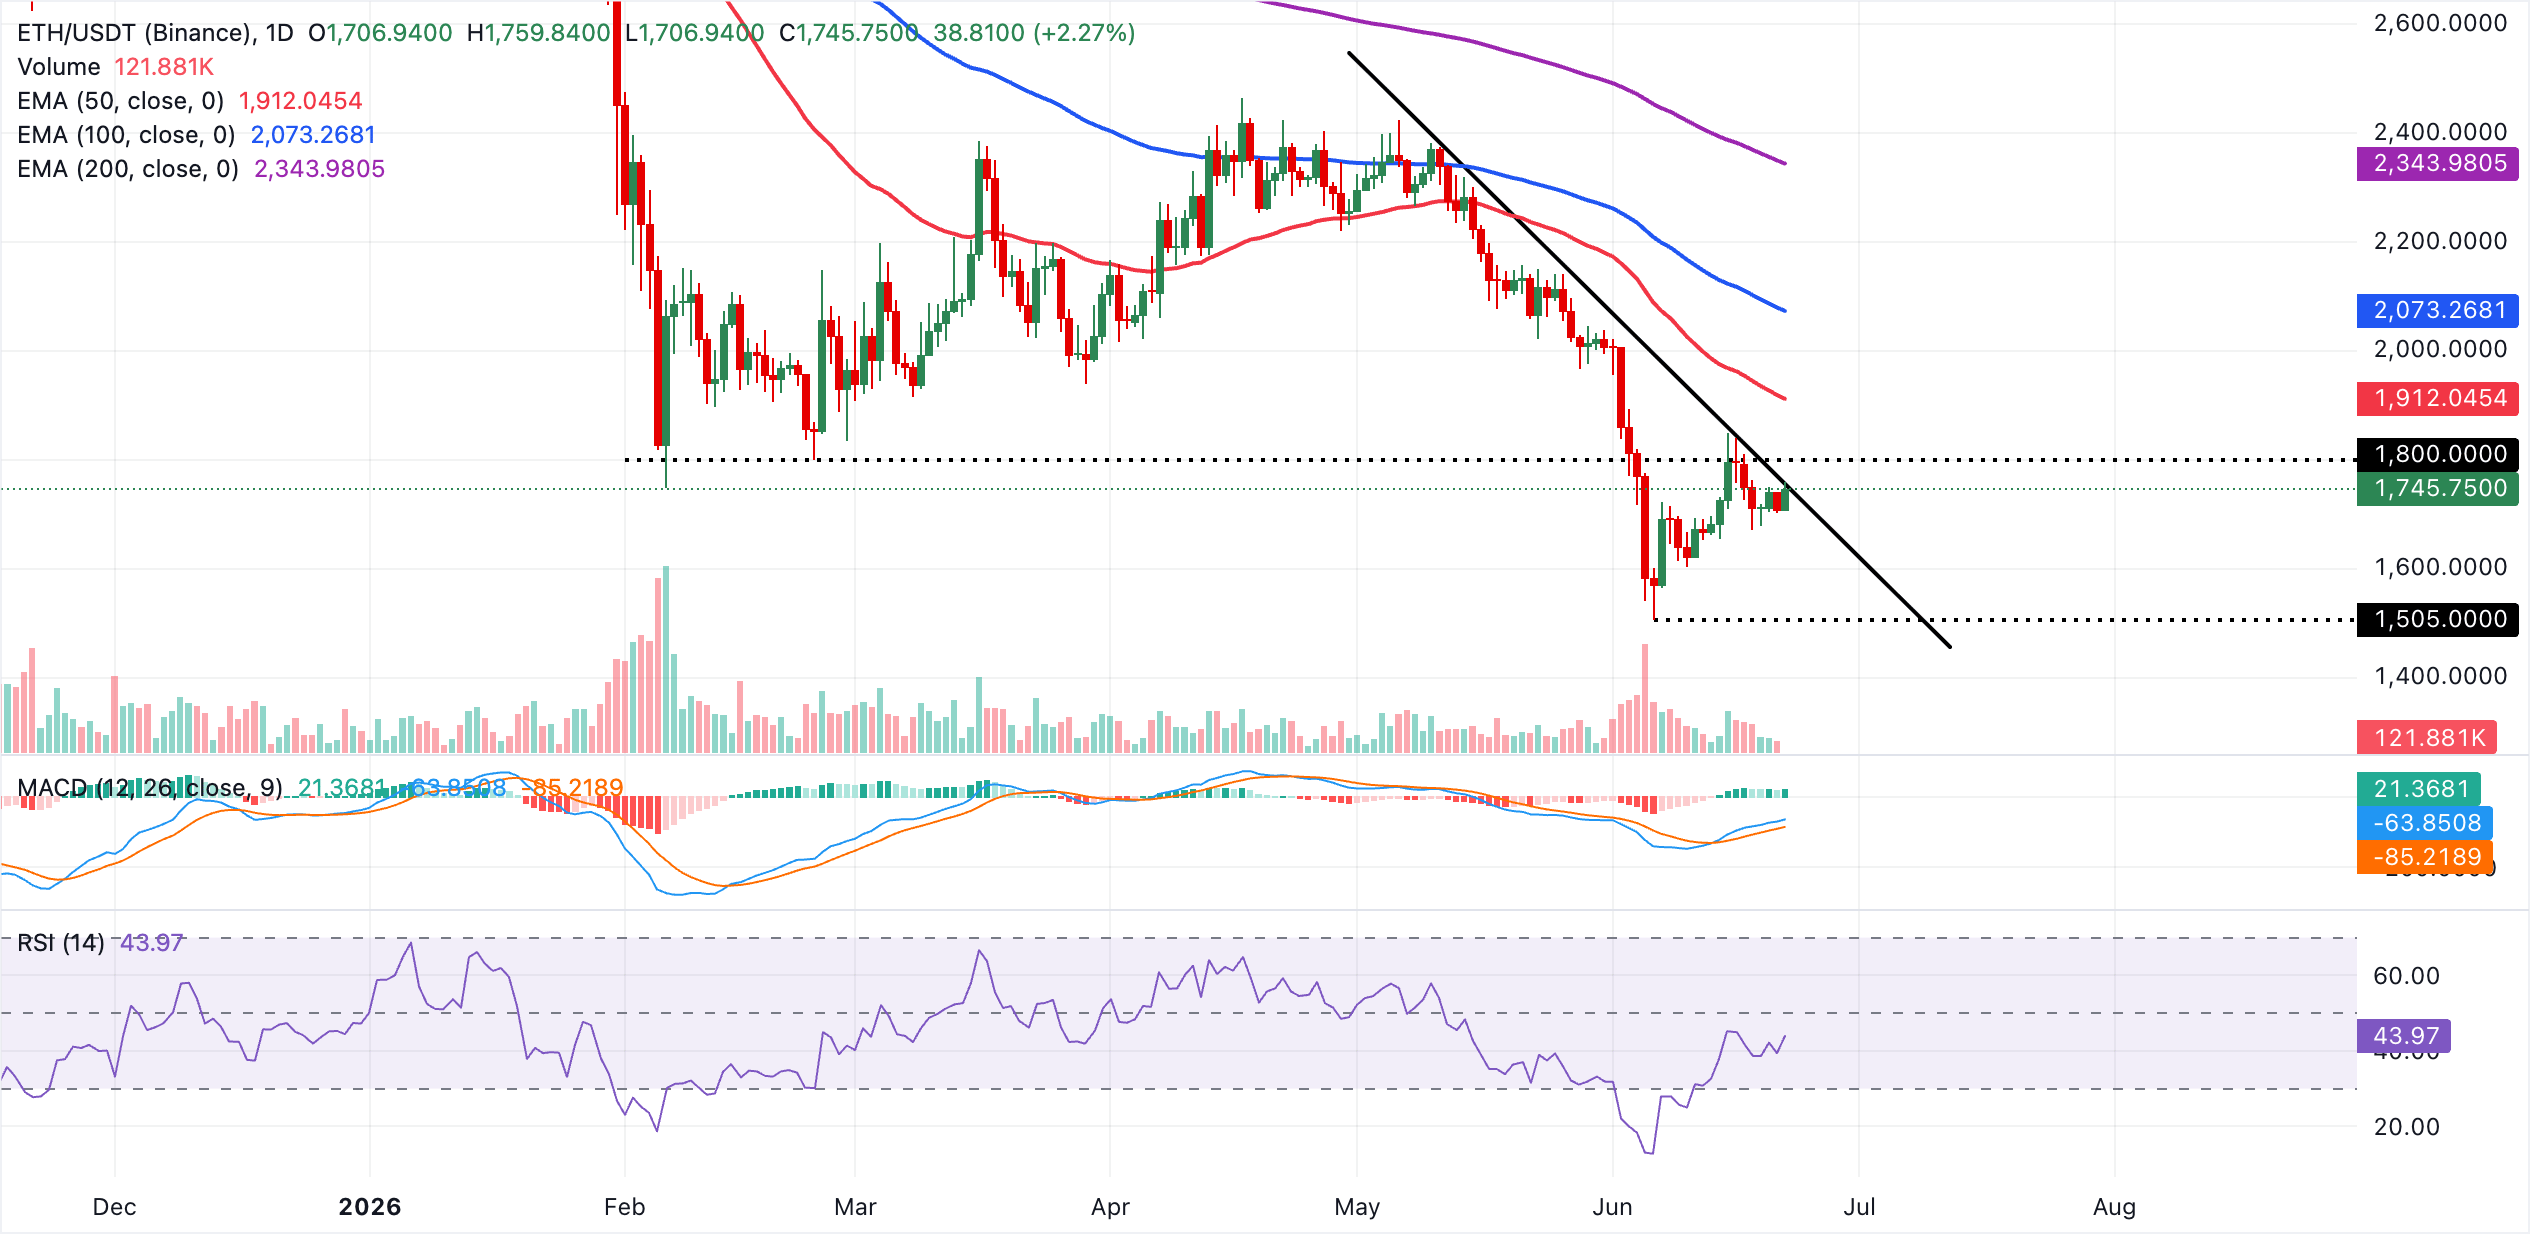
On the topside, immediate resistance is aligned at the downtrend line near $1,750. A daily close above this zone would open the way toward the 50-day EMA around $1,912 as the next hurdle, followed by the 100-day EMA near $2,073 and the 200-day EMA closer to $2,344. Traders should watch recent swing lows and psychological round numbers on the chart for potential demand, but the prevailing structure suggests that rallies are likely to be sold while ETH trades beneath the stacked EMAs.
XRP, on the other hand, trades above $1.13, keeping a bearish near-term bias as price holds well below key moving averages. The 50-day EMA at $1.25, the 100-day EMA at $1.35 and the 200-day EMA near $1.56 all sit overhead, suggesting that any rebound is likely to encounter supply at progressively lower levels.
The RSI around 40 on the daily chart points to subdued momentum within a broader downside structure defined by the persistent downward resistance trendline.
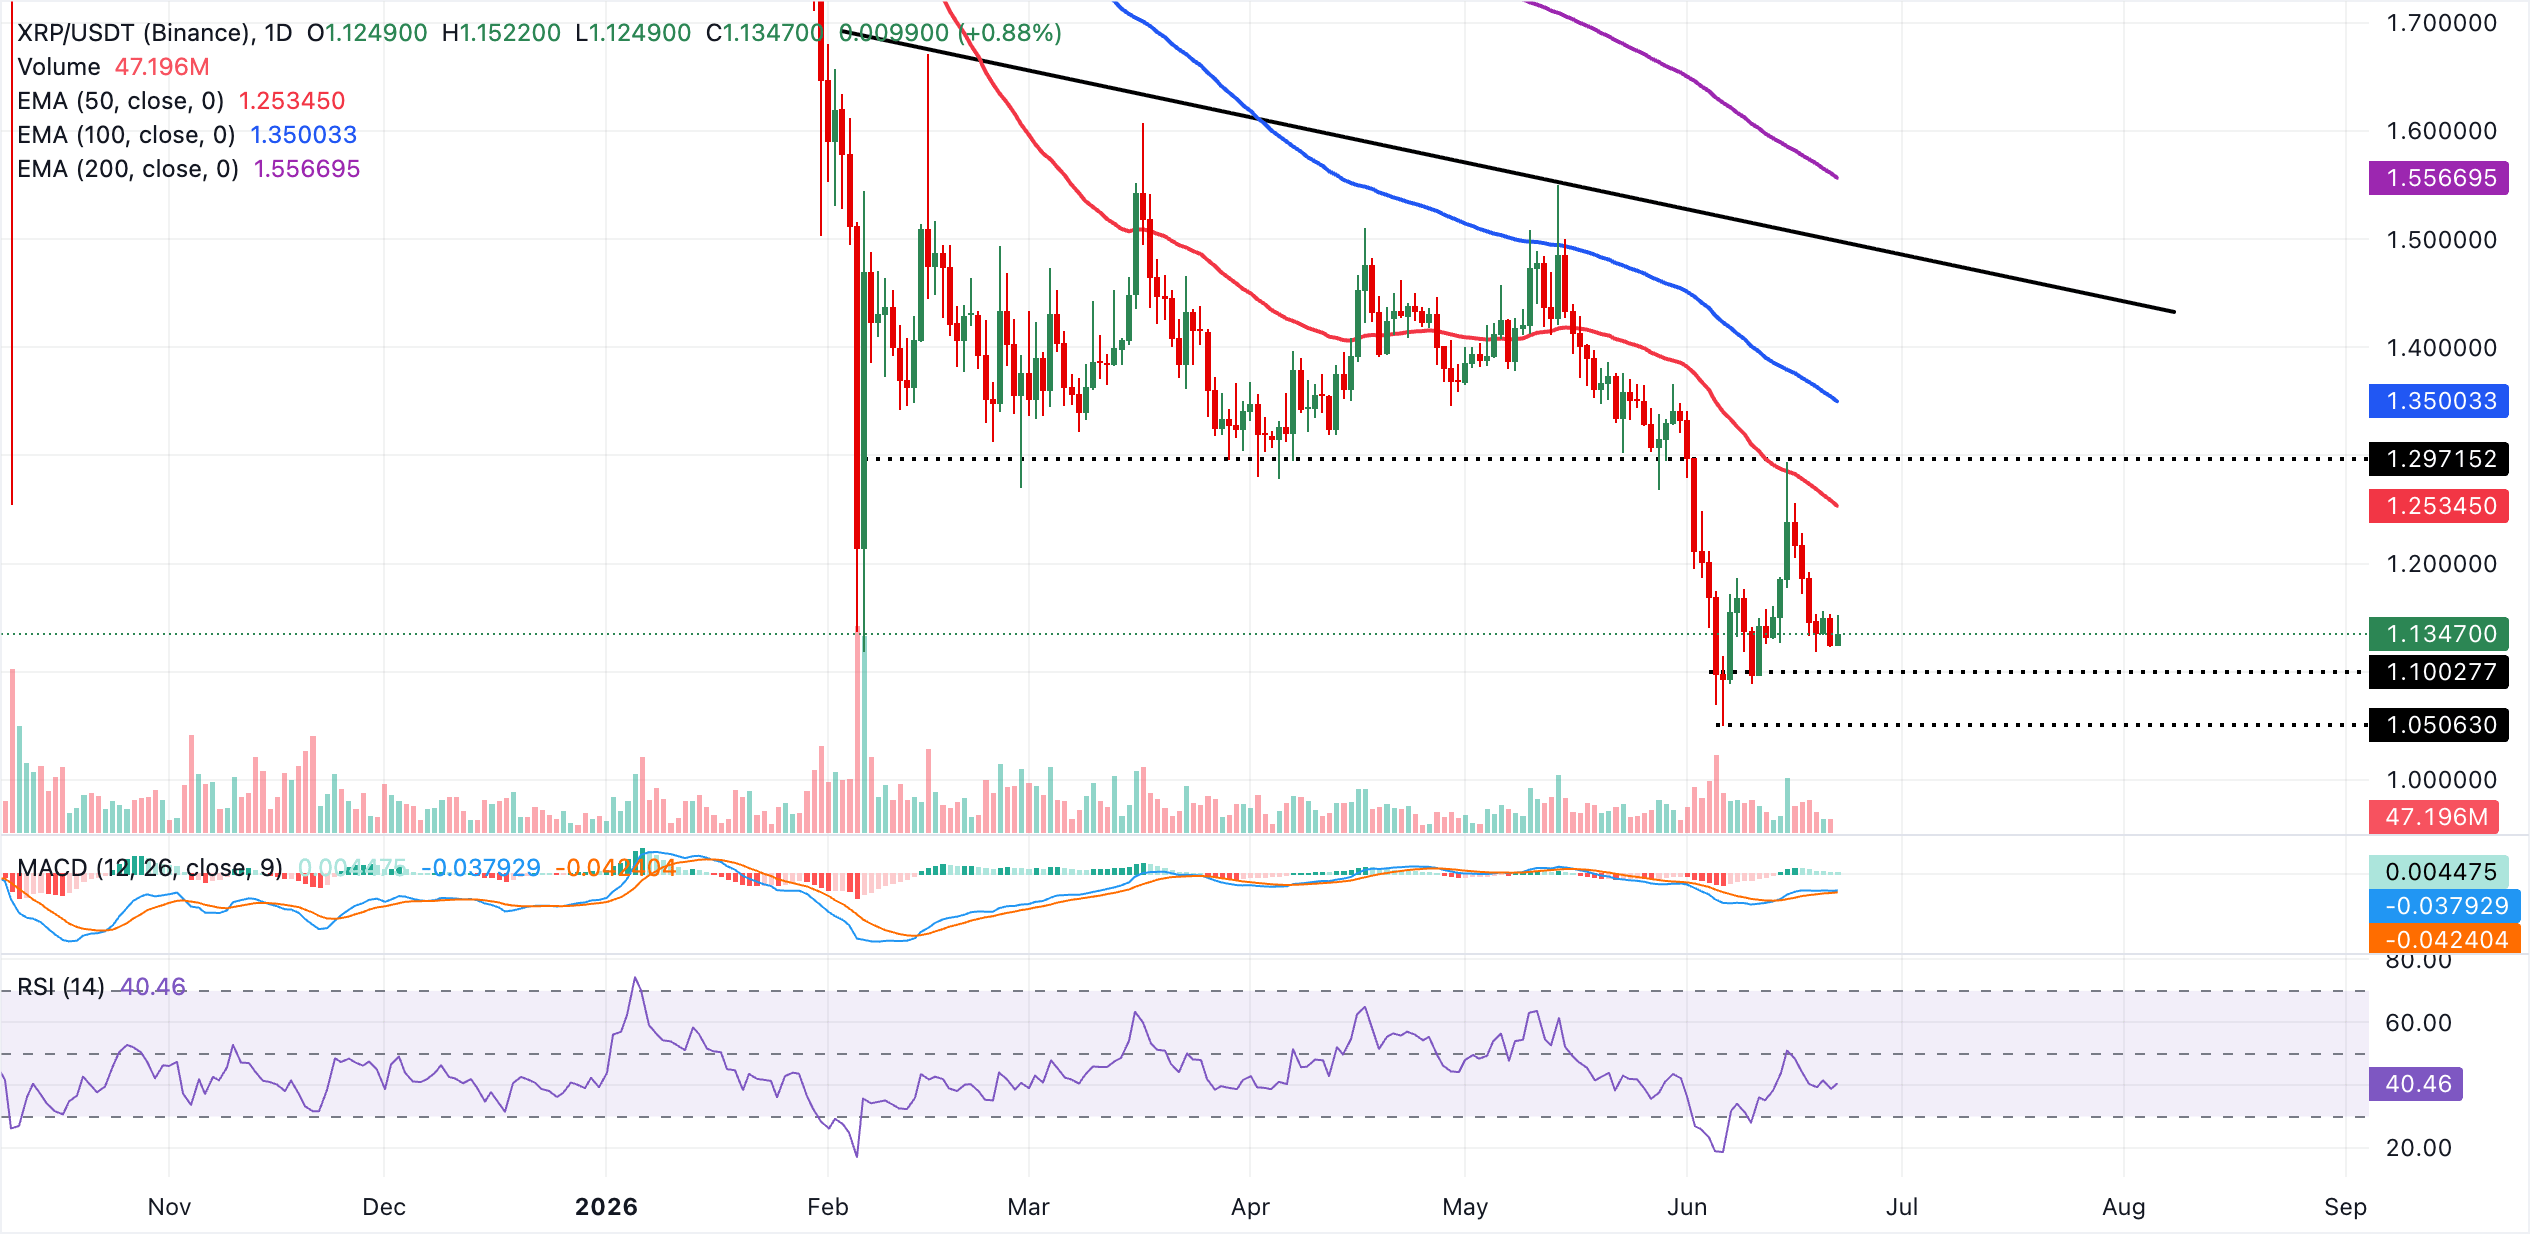
On the topside, initial resistance lies at the 50-day EMA around $1.25, with further barriers at the 100-day EMA near $1.35 and the 200-day EMA around $1.56, collectively reinforcing the broader downward trendline as a dominant capping structure. Unless buyers can reclaim these successive EMA layers, the pair is likely to remain vulnerable to further downside probes, with the absence of clearly defined nearby moving average supports on the daily chart leaving XRP dependent on horizontal demand zones and prior swing lows at $1.10 and $1.05.
(The technical analysis of this story was written with the help of an AI tool.)
Bitcoin, altcoins, stablecoins FAQs
Bitcoin is the largest cryptocurrency by market capitalization, a virtual currency designed to serve as money. This form of payment cannot be controlled by any one person, group, or entity, which eliminates the need for third-party participation during financial transactions.
Altcoins are any cryptocurrency apart from Bitcoin, but some also regard Ethereum as a non-altcoin because it is from these two cryptocurrencies that forking happens. If this is true, then Litecoin is the first altcoin, forked from the Bitcoin protocol and, therefore, an “improved” version of it.
Stablecoins are cryptocurrencies designed to have a stable price, with their value backed by a reserve of the asset it represents. To achieve this, the value of any one stablecoin is pegged to a commodity or financial instrument, such as the US Dollar (USD), with its supply regulated by an algorithm or demand. The main goal of stablecoins is to provide an on/off-ramp for investors willing to trade and invest in cryptocurrencies. Stablecoins also allow investors to store value since cryptocurrencies, in general, are subject to volatility.
Bitcoin dominance is the ratio of Bitcoin's market capitalization to the total market capitalization of all cryptocurrencies combined. It provides a clear picture of Bitcoin’s interest among investors. A high BTC dominance typically happens before and during a bull run, in which investors resort to investing in relatively stable and high market capitalization cryptocurrency like Bitcoin. A drop in BTC dominance usually means that investors are moving their capital and/or profits to altcoins in a quest for higher returns, which usually triggers an explosion of altcoin rallies.
추천 기사


