

Is Shiba Inu dead or just in a crisis? The data behind SHIB's 95% crash
Shiba Inu (SHIB), the dog-themed meme coin that became one of the biggest success stories in crypto and turned early buyers into crypto millionaires, is facing tough times. Its price has fallen more than 32% so far this year, and it is down 95% from its all-time high in 2021. Is SHIB simply another fading meme coin, or is the market overlooking a possible recovery story?
-1782118836078.png)
Why is SHIB crashing?
There are several reasons behind SHIB’s prolonged decline, with the fading trend for meme coins being the major one. When Dogecoin (DOGE), the first major meme coin, was introduced in 2013, the sector was driven largely by speculation, viral social media trends, and retail investor hype. This momentum intensified during the 2020-2021 crypto bull market, fueling explosive gains across meme tokens, including Shiba Inu.
However, as the cryptocurrency market matures, investor focus has shifted from mere speculation to projects with greater utility and real-world applications. Many meme coins have struggled to sustain long-term interest due to their limited use cases beyond speculative trading, leading to declines.
Despite the collapse, Shiba Inu remains far from irrelevant, with a market capitalization still hovering between $2.8 billion and $3 billion, among the largest cryptocurrencies by market value.
Unlike other meme coins, which do not have their own blockchain and instead rely on Ethereum’s infrastructure, the SHIB ecosystem has expanded to include a Decentralized Exchange (DEX) called ShibaSwap and a Layer 2 network called Shibarium, providing some utility to the token. Shiba Inu has shifted from a pure meme token to a more utility-focused project, though much of its value still comes from community hype and speculation, which has not supported its price.
The fall was further fueled by the Iran-US war, which began earlier this year, triggering broad risk-off sentiment. High-risk assets like meme coins and altcoins were hit hardest as investors fled to safer havens such as the US Dollar (USD) and US Treasuries.
Moreover, Bitcoin (BTC) correlation added more steam to the bears. SHIB, like most cryptos, remains highly correlated with BTC. With BTC dropping sharply by over 50% from its all-time high back in October, 2025, this further amplified SHIB’s fall.
Like other asset classes, cryptocurrencies are highly sensitive to liquidity conditions. Generally, when investors identify more attractive opportunities, capital often rotates away from higher-risk assets such as cryptocurrencies. Many analysts believe that crypto investors have moved their funds from crypto to reallocate toward upcoming blockbuster Initial Public Offerings (IPOs) such as SpaceX, Anthropic and OpenAI. This shift in investor capital has weighed on the broader cryptocurrency market, contributing to downside pressure on Shiba Inu.
Technical outlook: Primary trend remains bearish
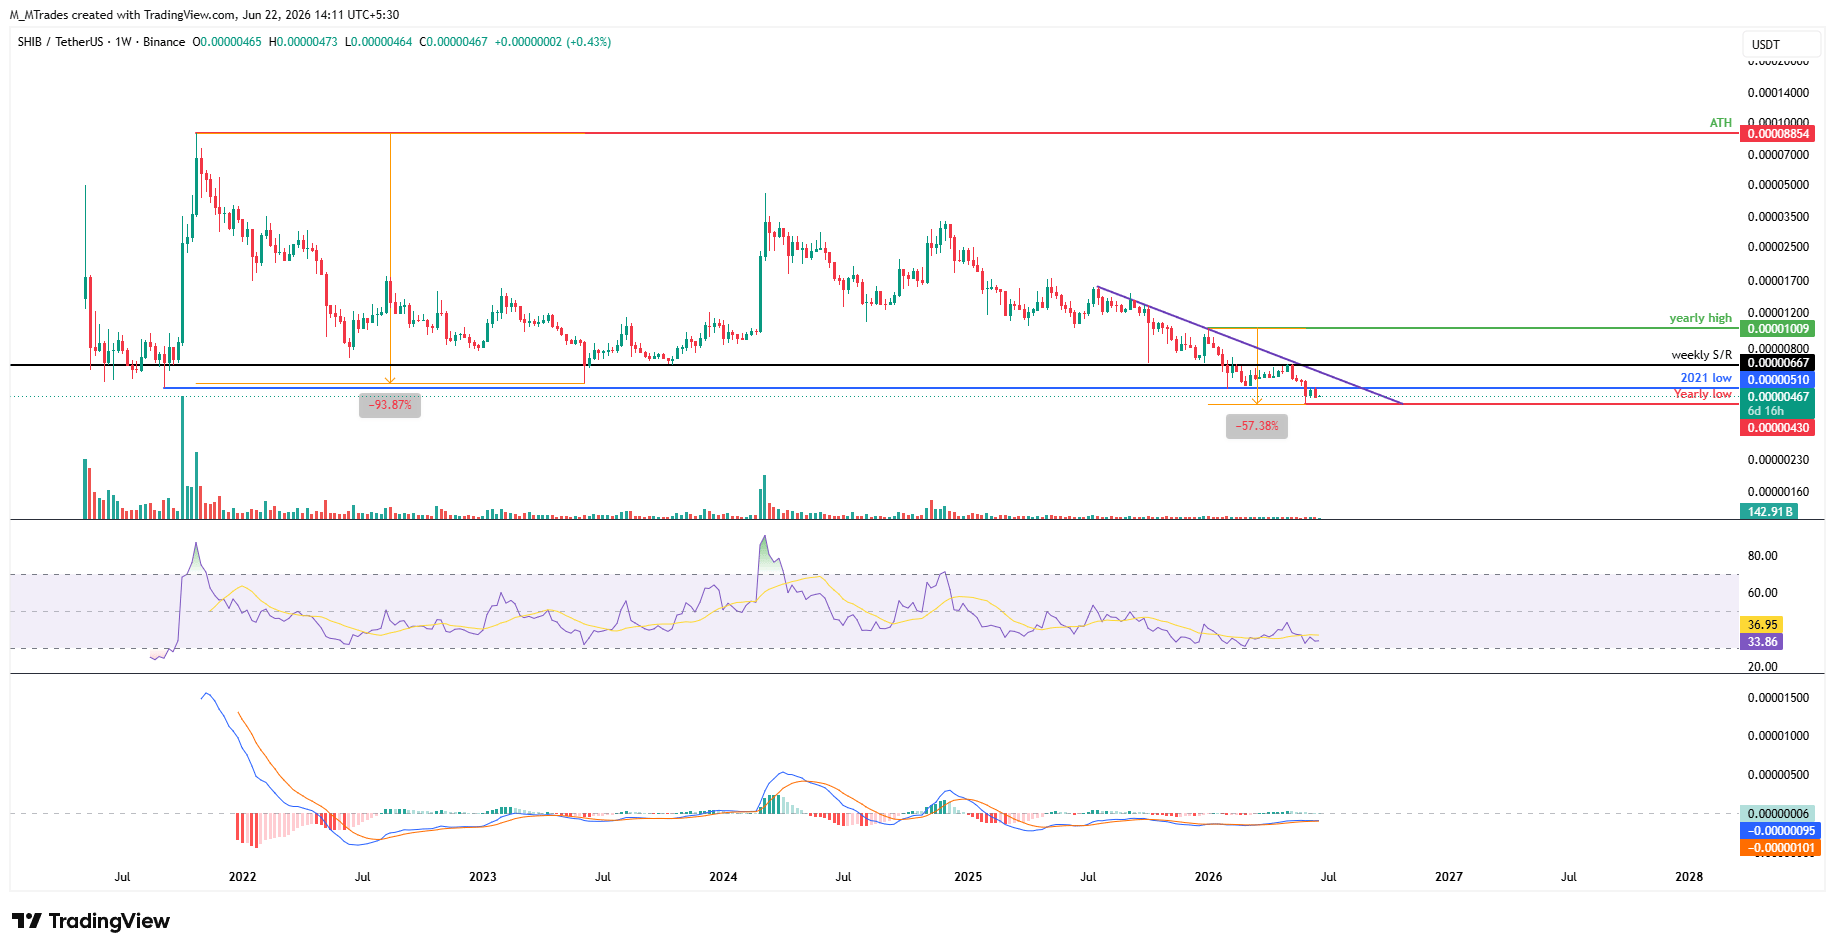
On the weekly chart, Shiba Inu continues to trade near the yearly low of $0.0000430, reached in early June. The long-term price action suggests that the bears are still in control, having corrected over 57% from its 2026 yearly high of $0.0000100.
The Relative Strength Index (RSI) on the weekly chart suggests weak momentum but not yet a deeply oversold condition, indicating more room for correction. The Moving Average Convergence Divergence (MACD) on the same chart showed a bullish crossover at the end of March, but the falling histogram bars indicate a mild recovery from a primary downward trend.
If SHIB continues its correction, it could extend the decline toward $0.0000430. A weekly close below this could extend deeper correction toward the key psychological level $0.0000300.
Unless selling pressure eases, as signaled by improving RSI and MACD indicators, followed by bulls reclaiming the key weekly resistance at $0.00000667. SHIB is likely to remain under bearish pressure.
On-chain perspective: Weak-burning activity and adoption
The CryptoQuant chart below shows that SHIB burns are not accelerating in a sustained way; the burned supply remains near zero, with occasional spikes. This indicates that the burn-driven scarcity remained weak, which doesn’t contribute to lift SHIB prices.

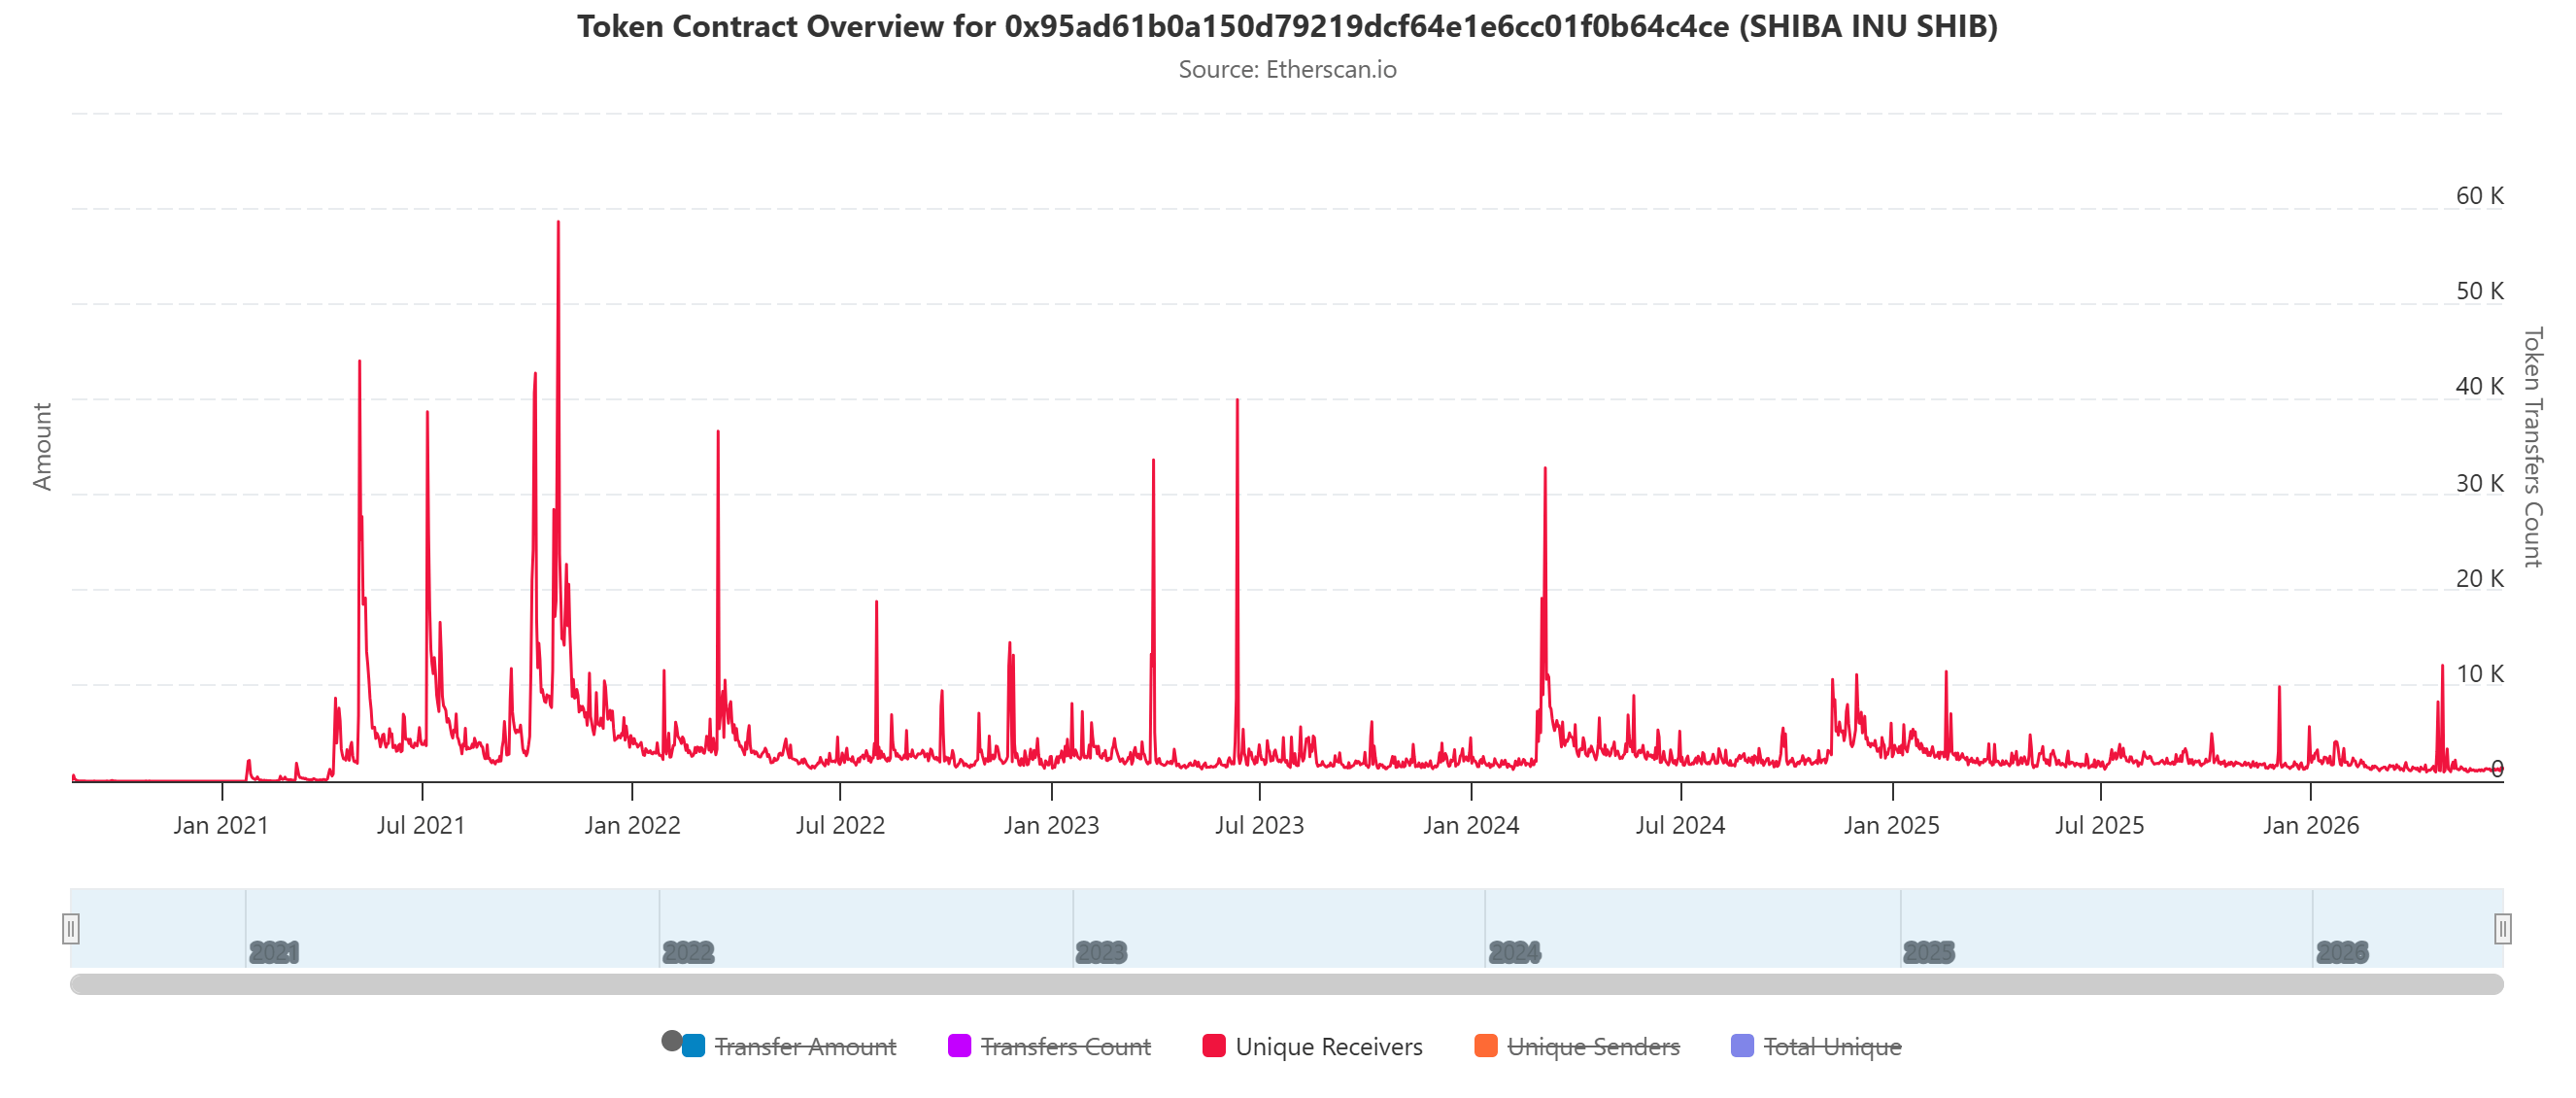
The data below from Etherscan.io shows that SHIB’s Unique Receivers metric has generally trended lower, with occasional bursts in 2023 to 2026, indicating periodic waves of renewed interest rather than sustained growth. In addition, the relatively subdued activity in recent months suggests that while new users continue to join the network, adoption remains well below the levels seen during the previous market cycle (the meme coin’s launch).
What should traders expect?
From a broader perspective, SHIB’s short-term price trend remains bearish, suggesting that the token may not have established a definitive market bottom. However, this does not necessarily mark the end of the Shiba Inu story. As in previous crypto bear market cycles, meme coins have historically experienced the steepest drawdowns before consolidating and then recovering.
SHIB’s long-term outlook looks more constructive than in previous cycles. The meme coin, which began as a purely speculative trading asset, has evolved into a utility-driven ecosystem. SHIB’s developer team continues to expand its ecosystem through initiatives such as ShibaSwap and the Shibarium Layer-2 network, aiming to enhance scalability, wider adoption and additional use cases beyond speculative trading.
On the institutional front, SHIB has also gained recognition despite the absence of a dedicated spot Exchange Traded Funds (ETFs), like Dogecoin. The US Securities and Exchange Commission (SEC) approved the T. Rowe Price Active Crypto ETF (TKNZ) in June, which will allow exposure to 15 cryptocurrencies, including SHIB, in what could become a key test for the token’s institutional acceptance.
In the medium-term, SHIB’s performance will remain closely tied to broader market conditions and the adoption of its ecosystem. Without stronger network growth, increased utility, massive burning activity and a sustained recovery in the crypto market, the token could continue to consolidate or even revisit lower price levels before establishing a more durable uptrend.
Crypto ETF FAQs
An Exchange-Traded Fund (ETF) is an investment vehicle or an index that tracks the price of an underlying asset. ETFs can not only track a single asset, but a group of assets and sectors. For example, a Bitcoin ETF tracks Bitcoin’s price. ETF is a tool used by investors to gain exposure to a certain asset.
Yes. The first Bitcoin futures ETF in the US was approved by the US Securities & Exchange Commission in October 2021. A total of seven Bitcoin futures ETFs have been approved, with more than 20 still waiting for the regulator’s permission. The SEC says that the cryptocurrency industry is new and subject to manipulation, which is why it has been delaying crypto-related futures ETFs for the last few years.
Yes. The SEC approved in January 2024 the listing and trading of several Bitcoin spot Exchange-Traded Funds, opening the door to institutional capital and mainstream investors to trade the main crypto currency. The decision was hailed by the industry as a game changer.
The main advantage of crypto ETFs is the possibility of gaining exposure to a cryptocurrency without ownership, reducing the risk and cost of holding the asset. Other pros are a lower learning curve and higher security for investors since ETFs take charge of securing the underlying asset holdings. As for the main drawbacks, the main one is that as an investor you can’t have direct ownership of the asset, or, as they say in crypto, “not your keys, not your coins.” Other disadvantages are higher costs associated with holding crypto since ETFs charge fees for active management. Finally, even though investing in ETFs reduces the risk of holding an asset, price swings in the underlying cryptocurrency are likely to be reflected in the investment vehicle too.
추천 기사


