


Zcash Price Forecast: ZEC extends gains, targets $500 as retail demand and momentum strengthen
- Zcash rallies, trading near $470 on Tuesday, as growing retail demand supports the recovery.
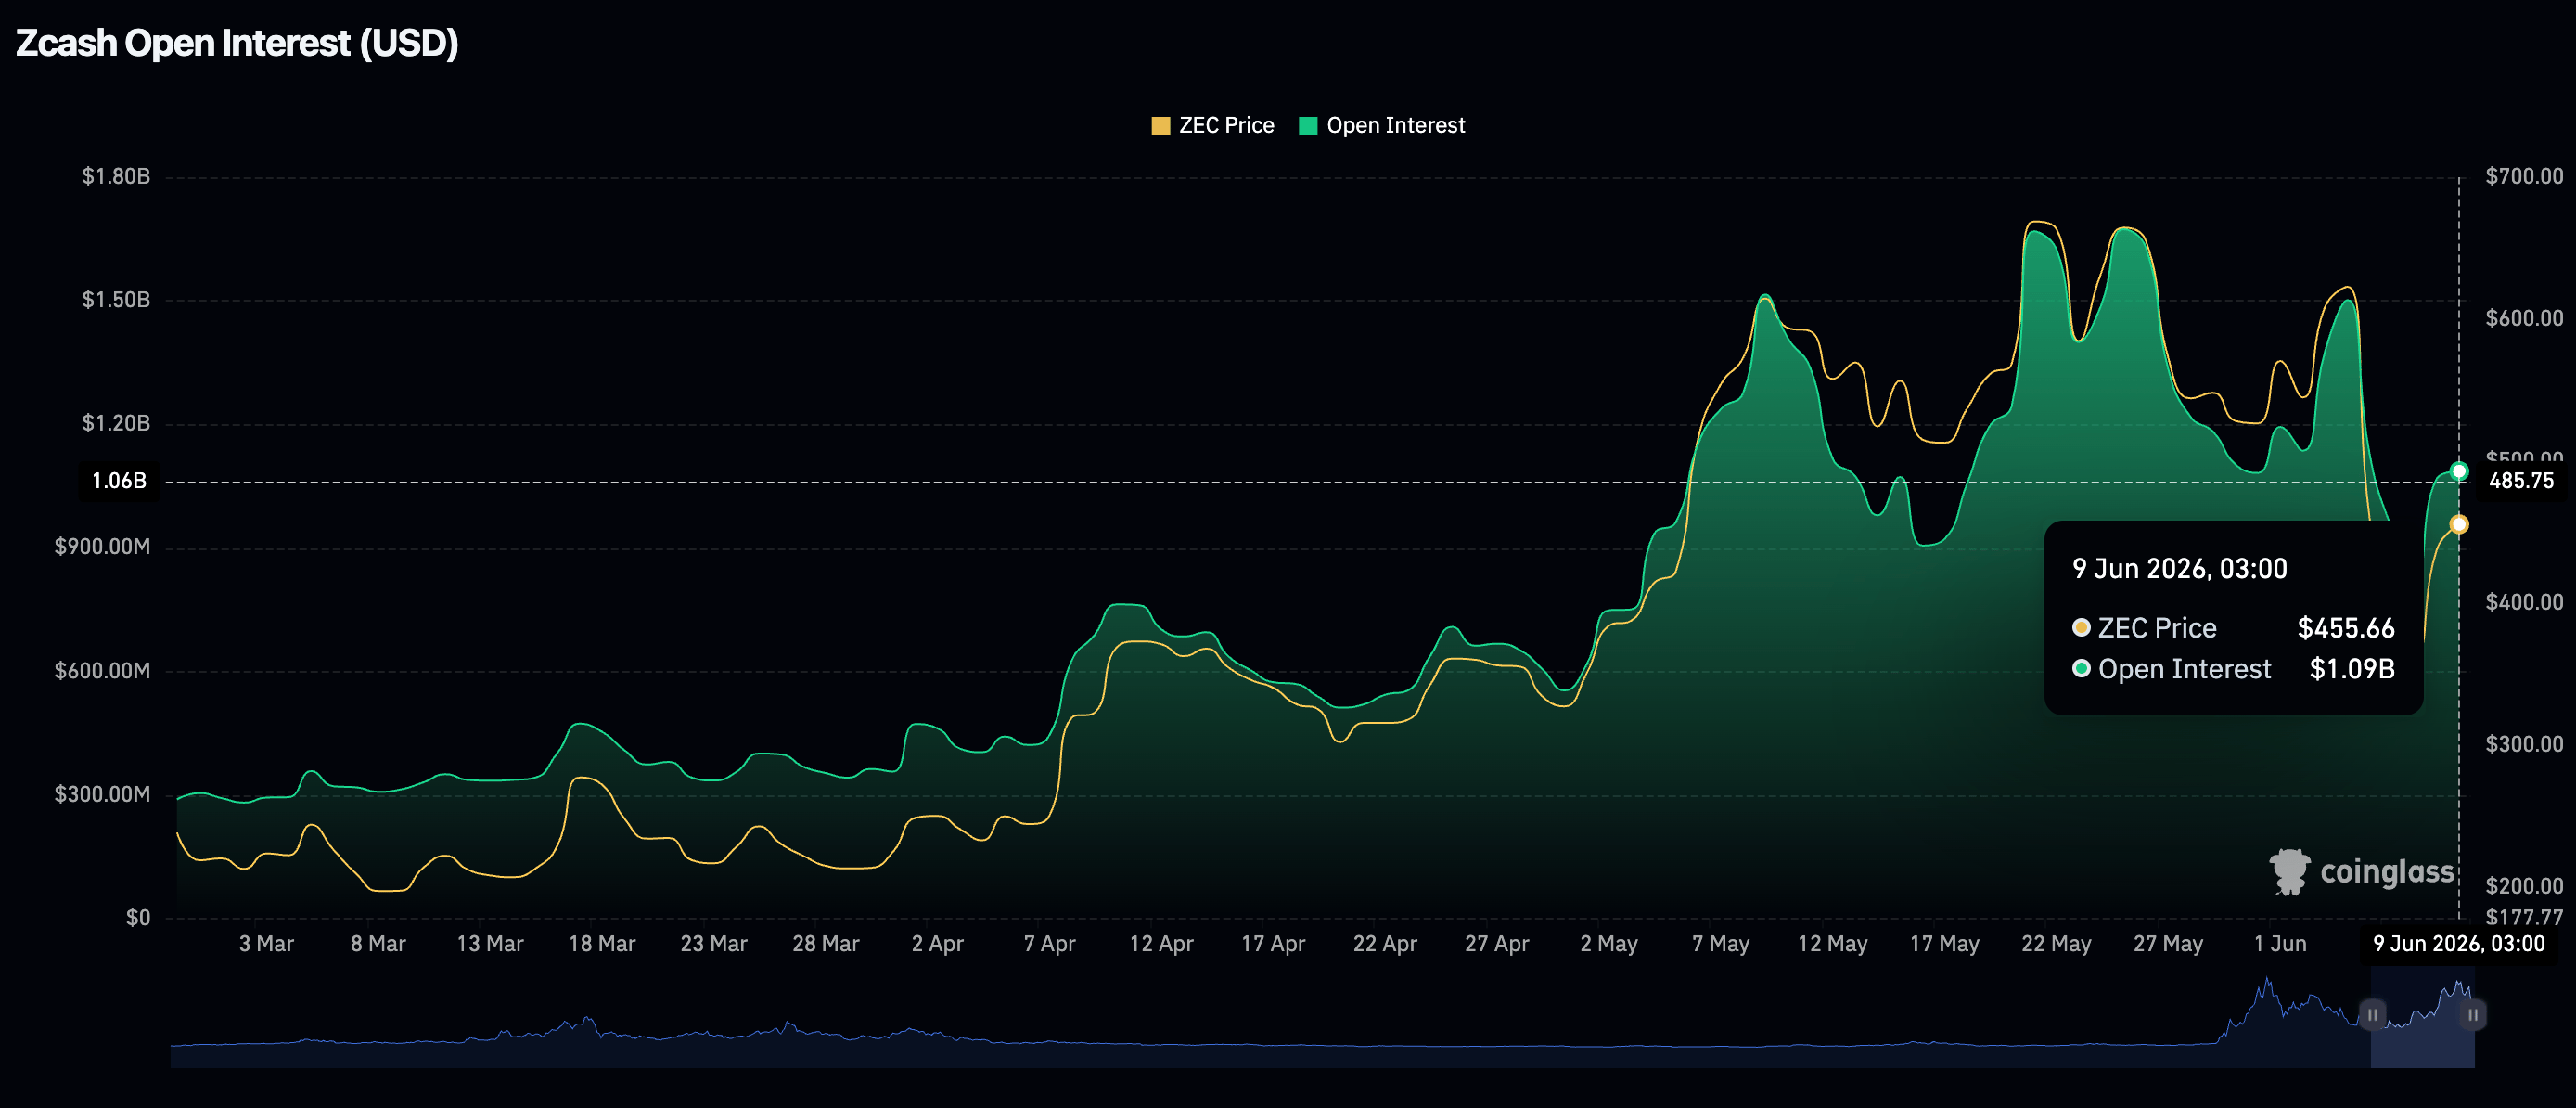
- ZEC derivatives remain above $1 billion, with perpetual futures traders increasing their risk exposure.
- Zcash holds above the 100-day and 200-day EMAs, while momentum indicators point to a sustained breakout.
Zcash (ZEC) gains momentum and trades near $470 at the time of writing on Tuesday, shrugging off a broader risk-off mood primarily driven by geopolitical tensions in the Middle East and macroeconomic uncertainty.
Zcash advances as retail participation improves
Retail activity remains relatively elevated, as reflected in the derivatives market. CoinGlass data shows perpetual futures Open Interest (OI) at $1.09 billion on Tuesday, up from $1.07 billion the previous day and $825 million on Sunday. A sustained uptick in retail participation is essential to drive a broader recovery in Zcash.
Zcash price analysis: ZEC extends breakout
Zcash trades above $463, keeping a modestly bearish near-term tone as price sits between key Exponential Moving Averages (EMAs). The pair holds above the 100-day and 200-day EMAs at roughly $430 and $370, which suggests underlying medium-term support, but it remains capped by the 50-day EMA near $486 and the Parabolic SAR above $572. At the same time, the Moving Average Convergence Divergence (MACD) histogram remains negative and the Relative Strength Index (RSI) hovers just below neutral, hinting at subdued upside momentum.
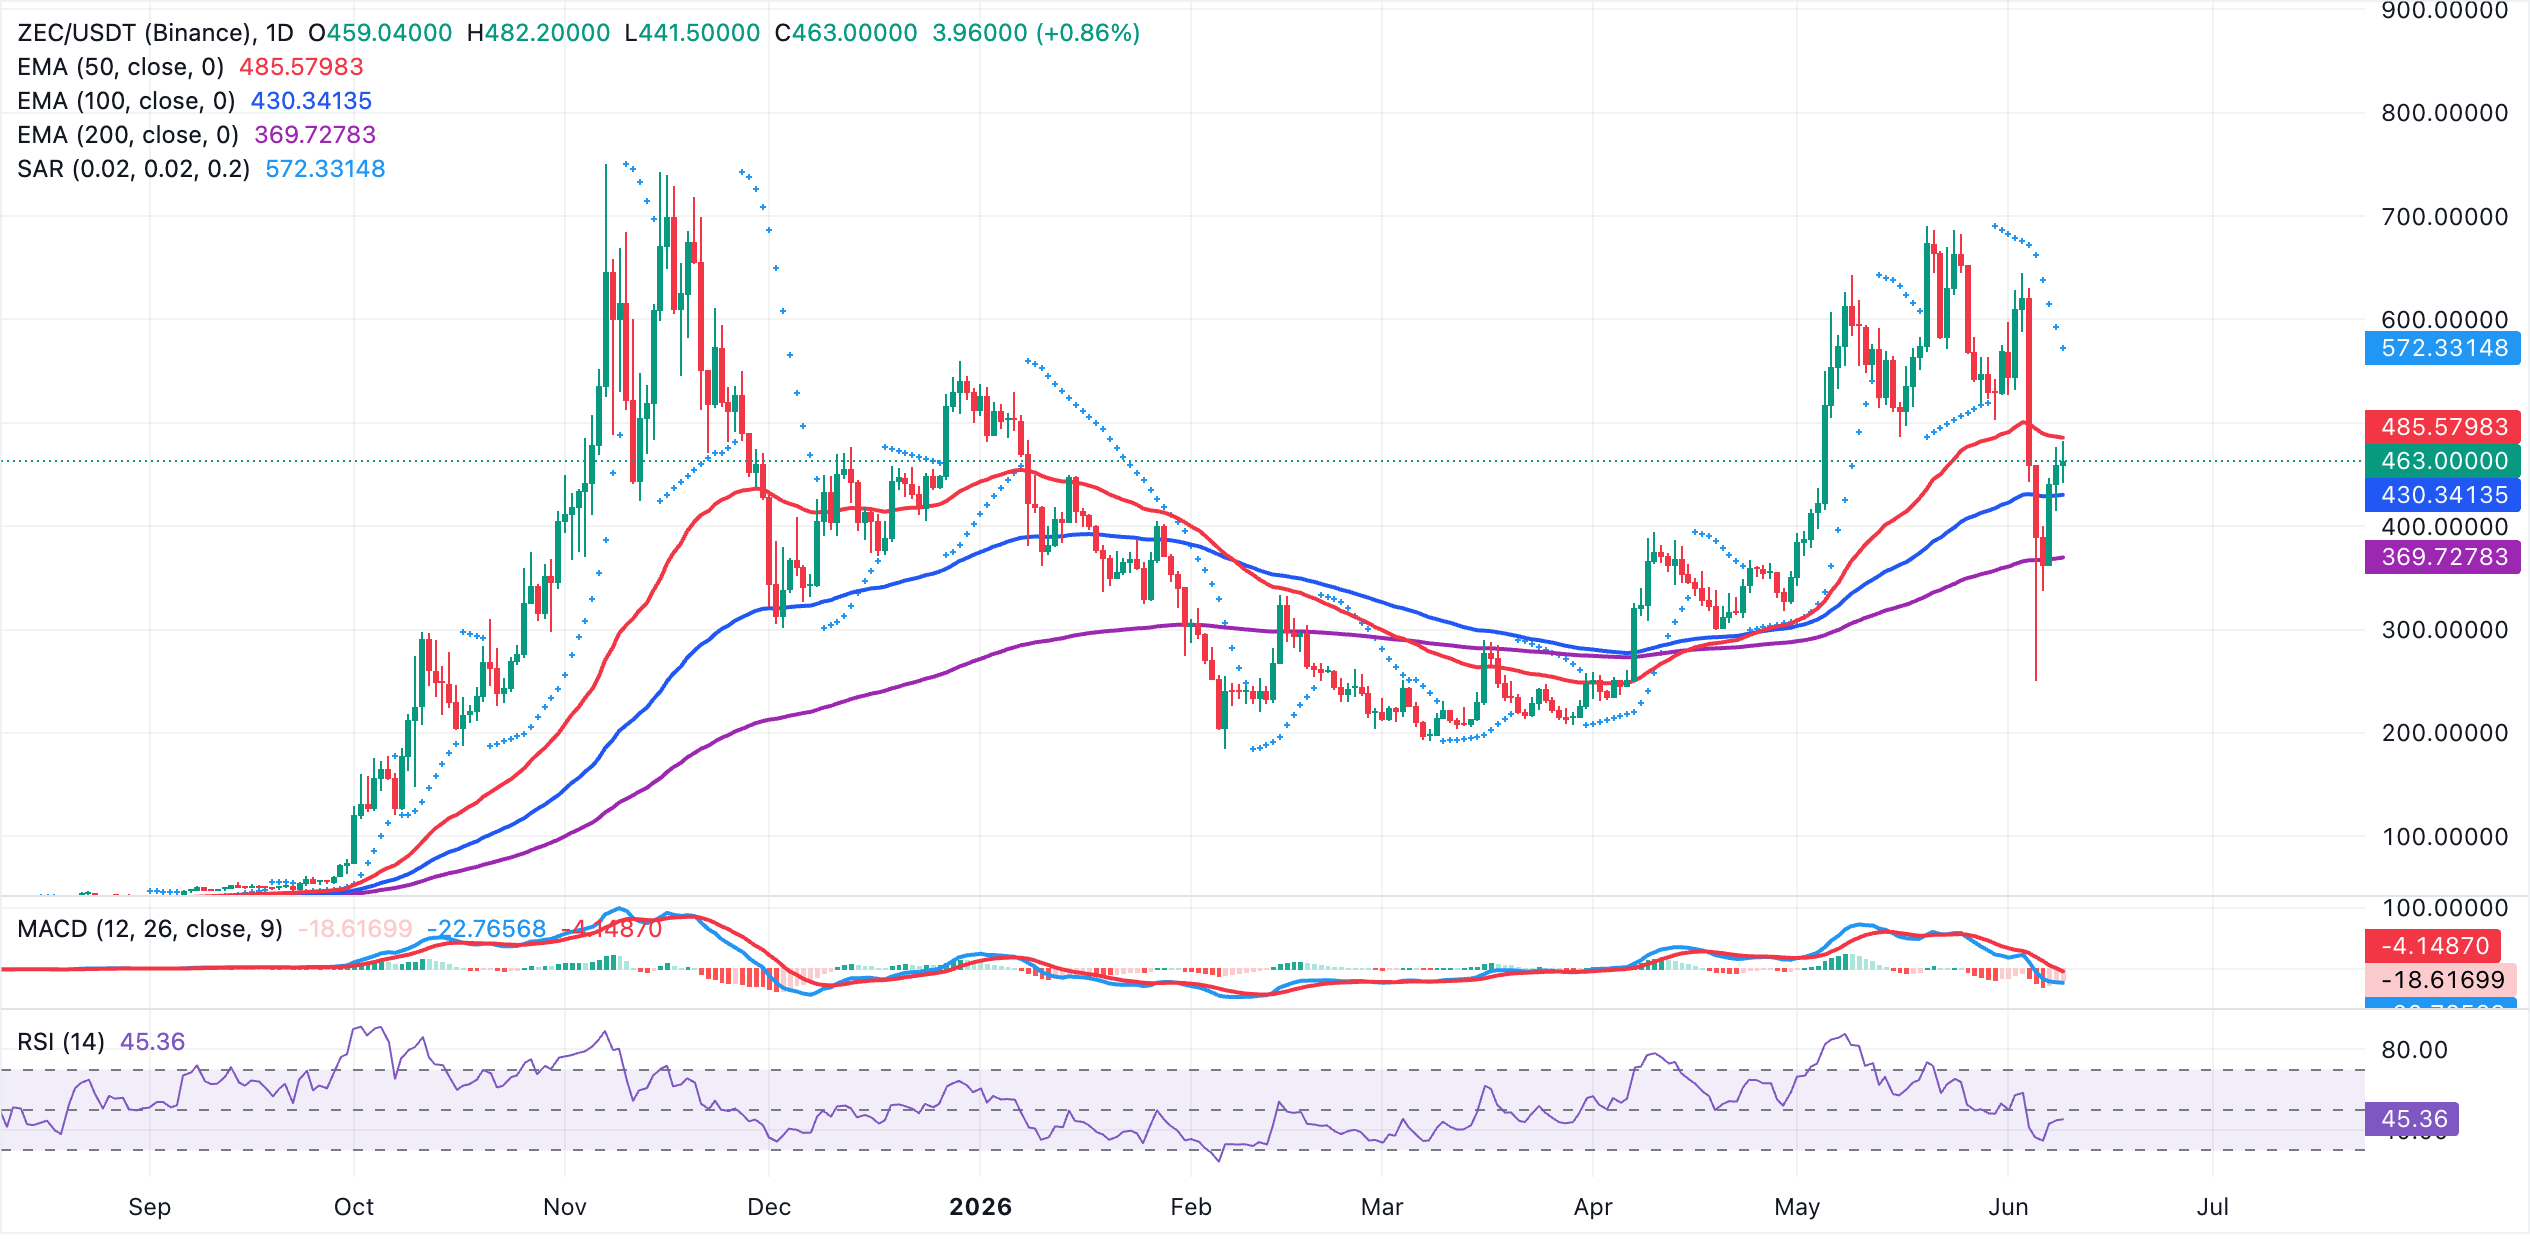
On the topside, immediate resistance lies at the 50-day EMA around $486, with a higher barrier at the Parabolic SAR level near $572, where a daily close above would be needed to ease the current cap and open a stronger recovery. On the downside, initial support is aligned with the 100-day EMA at about $430, followed by stronger structural demand at the 200-day EMA close to $370, and a break below this latter area would reinforce the broader bearish bias.
(The technical analysis of this story was written with the help of an AI tool.)
Crypto ETF FAQs
An Exchange-Traded Fund (ETF) is an investment vehicle or an index that tracks the price of an underlying asset. ETFs can not only track a single asset, but a group of assets and sectors. For example, a Bitcoin ETF tracks Bitcoin’s price. ETF is a tool used by investors to gain exposure to a certain asset.
Yes. The first Bitcoin futures ETF in the US was approved by the US Securities & Exchange Commission in October 2021. A total of seven Bitcoin futures ETFs have been approved, with more than 20 still waiting for the regulator’s permission. The SEC says that the cryptocurrency industry is new and subject to manipulation, which is why it has been delaying crypto-related futures ETFs for the last few years.
Yes. The SEC approved in January 2024 the listing and trading of several Bitcoin spot Exchange-Traded Funds, opening the door to institutional capital and mainstream investors to trade the main crypto currency. The decision was hailed by the industry as a game changer.
The main advantage of crypto ETFs is the possibility of gaining exposure to a cryptocurrency without ownership, reducing the risk and cost of holding the asset. Other pros are a lower learning curve and higher security for investors since ETFs take charge of securing the underlying asset holdings. As for the main drawbacks, the main one is that as an investor you can’t have direct ownership of the asset, or, as they say in crypto, “not your keys, not your coins.” Other disadvantages are higher costs associated with holding crypto since ETFs charge fees for active management. Finally, even though investing in ETFs reduces the risk of holding an asset, price swings in the underlying cryptocurrency are likely to be reflected in the investment vehicle too.
추천 기사


