


Crude Oil spends Monday selling the war, then buys the revenge post
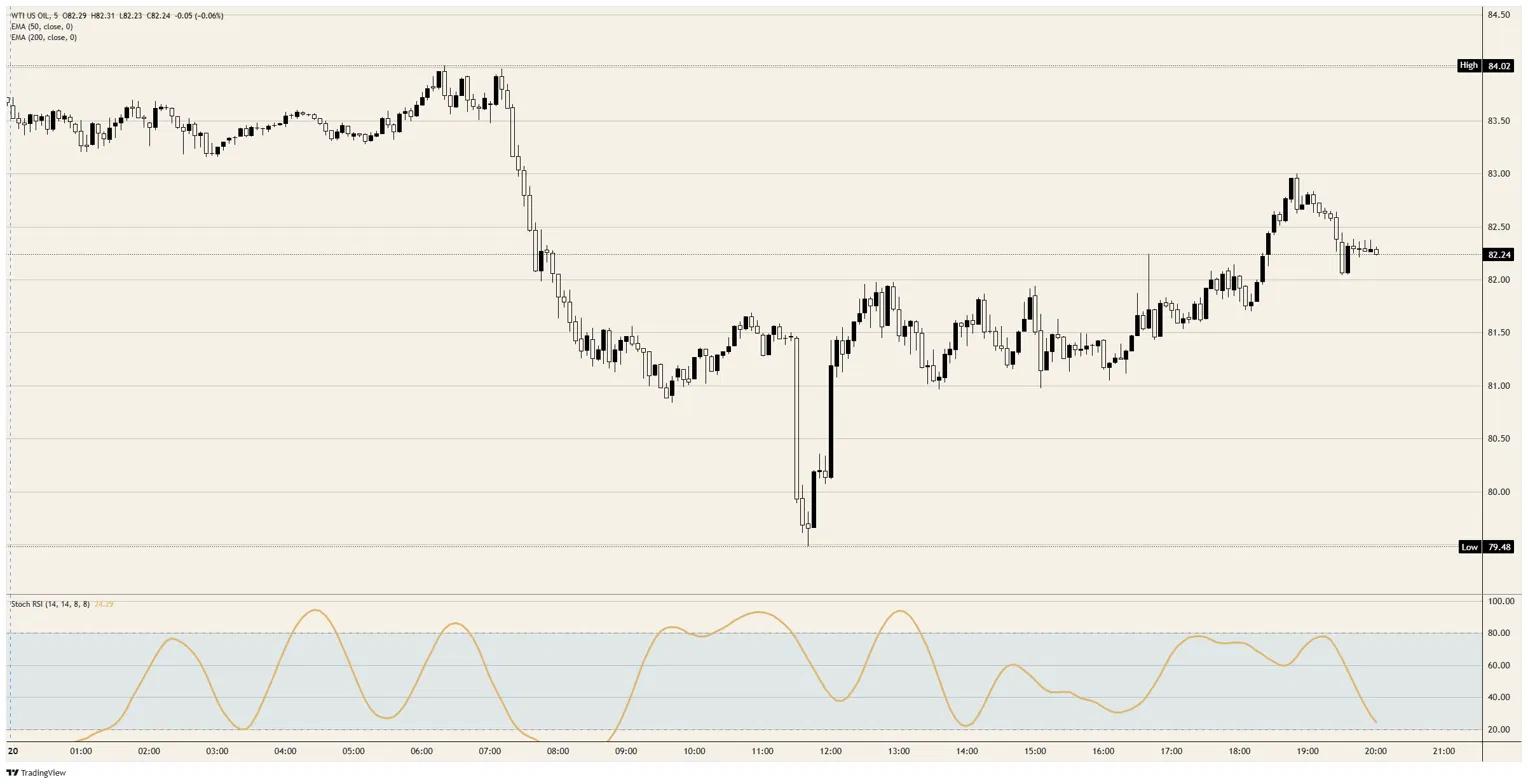
- WTI Crude Oil trades just above the $82.00 handle after a late-session surge tested $83.00, reversing a slide that ran from just above $84.00 to just short of $79.50.
- President Trump vowed revenge on Iran in a late-day Truth Social post, pledging retribution several times over for every American killed, after Iranian strikes killed two US soldiers in Jordan.
- A halved Gulf export stream and a four-decade-low Strategic Petroleum Reserve leave no supply cushion, so threat headlines carry all the convexity.
Crude Oil compressed its entire 2026 personality into a single Monday tape. The barrel faded from just above $84.00 through the European morning, flushed the stops to just short of $79.50 around midday, and then repriced the war in minutes when President Trump vowed revenge on Iran, a late-session bid that punched through $82.00 and tested the $83.00 handle before easing back to just above $82.00.
The peace trade, minus the peace
Monday's slide ran against a backdrop that offered nothing to justify it. Washington has strung together nine consecutive nights of strikes on the capabilities Iran uses against Strait of Hormuz shipping, the Islamic Revolutionary Guard Corps spent the weekend targeting tankers on the southern route off Oman, and fighter squadrons are being pulled from Europe toward the region while ground-assault chatter builds in both capitals. The barrel sold all of it anyway, bleeding lower from the opening hours.
What the morning did offer was noise that read, if squinted at, like de-escalation. The Secretary of State spent the weekend insisting the diplomatic door remains open, the White House shelved its floated 20% transit fee on Hormuz cargo, and US-backed work on reviving an Iraq-to-Syria pipeline sketched the outline of a world routing around the strait. Sunday's roughly 3% pop had also left longs with profits to book into thin summer liquidity.
Five months of serial ceasefires built the reflex that did the rest: every prior lull taught traders the premium decays faster than the war ends, so the tape now fades headlines it has seen before. That reflex ran to its logical extreme around midday, a two-candle flush through the $80.00 handle that printed just short of $79.50 and snapped back above $81.00 within minutes, a stop-run that found nobody willing to press the low.
The revenge repricing
The reversal needed exactly one input, and it arrived deep in the North American afternoon: President Trump vowed revenge on Iran in a Truth Social post, pledging that Tehran would repay every American death several times over and confirming the directive had already gone to his commanders, after Iranian strikes killed two US soldiers in Jordan. The bid was immediate, punching through $82.00 to a test of the $83.00 handle, nearly $2.00 of war premium rebuilt inside two hours.
The asymmetry between the two moves is the story worth keeping. The morning needed five hours, nine ignored nights of strikes, and a stop-run to drag the barrel roughly $4.50 lower, while a single post clawed back close to half of it before most desks had read it twice. The two-way market the textbooks promise shows up only on the way down, and even there it needed a stop-run to look convincing.
Washington then restated the asymmetry in real time: Central Command announced a fresh round of strikes at 20:00 GMT, directed by the Commander in Chief and aimed at the same Hormuz shipping-attack capabilities the previous nine rounds targeted, and the barrel barely blinked. An administration still advertising an open diplomatic door is now launching its tenth consecutive night of ordnance; the announced strike is priced, and only the threatened one moves spot.
The sequence also rhymes with early July, when the third ceasefire break landed a day after the sell side surrendered to the peace trade, the Energy Information Administration slashing its third-quarter Brent forecast by $27.00 and Saudi Arabia cutting official selling prices by the most in two decades. The lesson keeps getting retaught: this market punishes anyone who prices the war away, and Monday ran the whole script in miniature.
No cushion, no symmetry
The reason one post can move spot nearly $2.00 lives in the physical market rather than the feed. Gulf exports have run at roughly half their pre-war rate for months, around 7 million barrels per day against a long-run reference near 20 million, tanker traffic through the strait sits hostage to Iranian discretion, and the Strategic Petroleum Reserve holds about 319.5 million barrels, its lowest level since 1983.
Against that backdrop the tape's manic behaviour is close to rational. Fading the premium earns a few Dollars slowly and with the crowd, while being short the wrong headline in a market with no spare barrels costs double digits instantly, so the fades trade thin and the threats trade thick. Until Hormuz flows normalize or the reserve rebuilds, Crude Oil remains a market where the President's feed prints the marginal barrel.
Crude Oil technical levels
Resistance: The $83.00 handle is the immediate cap, the level the revenge bid tested and could not clear on the first attempt. Beyond it sits the $84.00 area, home to the session high printed in the early hours, and then the $85.00 handle as the first objective of escalation that arrives by missile rather than by post.
Support: Initial demand sits at the $82.00 handle, backed by the $81.00 to $81.50 congestion that absorbed the entire afternoon. Below that, the $80.00 handle guards the midday extreme just short of $79.50, a low the market has already rejected emphatically once today.
Bias: Bullish. The flush found no sellers willing to press below $80.00, the rebound needed nothing more than a post, and the 5-minute Stochastic Relative Strength Index has cooled toward oversold while the tape holds above $82.00, consolidation rather than reversal. Only a break back below the $81.00 area, unwinding the entire revenge bid, hands the session back to the peace trade.
WTI Crude Oil spot, 5-minute chart
WTI Oil FAQs
WTI Oil is a type of Crude Oil sold on international markets. The WTI stands for West Texas Intermediate, one of three major types including Brent and Dubai Crude. WTI is also referred to as “light” and “sweet” because of its relatively low gravity and sulfur content respectively. It is considered a high quality Oil that is easily refined. It is sourced in the United States and distributed via the Cushing hub, which is considered “The Pipeline Crossroads of the World”. It is a benchmark for the Oil market and WTI price is frequently quoted in the media.
Like all assets, supply and demand are the key drivers of WTI Oil price. As such, global growth can be a driver of increased demand and vice versa for weak global growth. Political instability, wars, and sanctions can disrupt supply and impact prices. The decisions of OPEC, a group of major Oil-producing countries, is another key driver of price. The value of the US Dollar influences the price of WTI Crude Oil, since Oil is predominantly traded in US Dollars, thus a weaker US Dollar can make Oil more affordable and vice versa.
The weekly Oil inventory reports published by the American Petroleum Institute (API) and the Energy Information Agency (EIA) impact the price of WTI Oil. Changes in inventories reflect fluctuating supply and demand. If the data shows a drop in inventories it can indicate increased demand, pushing up Oil price. Higher inventories can reflect increased supply, pushing down prices. API’s report is published every Tuesday and EIA’s the day after. Their results are usually similar, falling within 1% of each other 75% of the time. The EIA data is considered more reliable, since it is a government agency.
OPEC (Organization of the Petroleum Exporting Countries) is a group of 12 Oil-producing nations who collectively decide production quotas for member countries at twice-yearly meetings. Their decisions often impact WTI Oil prices. When OPEC decides to lower quotas, it can tighten supply, pushing up Oil prices. When OPEC increases production, it has the opposite effect. OPEC+ refers to an expanded group that includes ten extra non-OPEC members, the most notable of which is Russia.
추천 기사


