


Dow Jones Industrial Average sits out a rally priced for a peace nobody has scheduled
- DJIA trades near the 52,000 handle, down roughly 100 points, while the S&P 500 and Nasdaq Composite advance behind a semiconductor rebound.
- The United States logs a ninth consecutive day of strikes on Iran, yet one hint of future talks from Tehran is carrying the entire risk bid.
- Rate markets price a first Federal Reserve hike by September at roughly three chances in four ahead of next week's policy decision.
The Dow Jones Industrial Average trades near the 52,000 handle on Monday, down roughly 100 points, while the S&P 500 adds 0.4% and the Nasdaq Composite climbs 0.9%, with all three coming off a losing week. The split tape lands on the ninth consecutive day of United States strikes on Iran, a bombing cadence that equity investors have evidently reclassified as background noise while they wait for diplomacy to reappear on its own schedule.
Nine days of strikes, one sentence of diplomacy
Sentiment turned by mid-morning in London after a spokesman for Iran's Foreign Ministry told reporters that intermediaries are still exchanging messages between the two capitals and that negotiations could proceed where national interests allow. That single formulation was enough to underwrite the day's risk appetite, even as Washington extended its strike campaign overnight and Tehran kept up attacks on commercial shipping around the Strait of Hormuz.
The escalation ledger keeps lengthening all the same, with Houthi militants declaring a maritime embargo against Saudi Arabia on Monday, a threat aimed squarely at the Bab el-Mandeb chokepoint, and US pump prices back above $4.00 a gallon. West Texas Intermediate (WTI) Crude Oil nonetheless trades little changed near $82.00 and Brent Crude Oil sits around $88.00. The consensus desk view holds that the White House has no tolerance for a materially larger military footprint, and that some form of negotiated outcome is therefore inevitable, a conviction doing an impressive amount of load-bearing work for a Monday.
A semiconductor bounce the price-weighted index cannot catch
Monday's advance is a semiconductor story from top to bottom, which is precisely why the Dow is not invited. Micron climbs more than 3%, Advanced Micro Devices adds more than 2%, Teradyne rises better than 5%, and Astera Labs gains over 4%, while the sector's benchmark fund recovers more than 1% after logging a third weekly decline in four. Microsoft's decision to deploy Advanced Micro Devices' new Helios racks across its Azure data centres, joining Meta, OpenAI and Oracle as early customers, supplied the day's catalyst.
The bounce is still happening inside a damaged trend, with strategists at Wells Fargo framing the chip complex as midway through a reality check and warning that recent technical deterioration raises the odds of a deeper flush toward long-term moving averages. The overnight tape made the same point less politely, as South Korea's Kospi shed 4.5% on heavy losses in Samsung and SK Hynix. A price-weighted index with minimal chip torque is left to trade the war on its merits, and on those merits it is down.
The rates market is quietly pricing the other branch
Fed funds futures assign an 83% probability to a hold at the July 29 Federal Open Market Committee (FOMC) decision, but the calendar behind it keeps hardening. A first hike is priced at 76% by the September meeting, moves to near certainty by late October, and December now carries a 41% chance of a second move into a 4.00%-4.25% target range. Not a single cut is priced at any meeting on the visible horizon.
The same war being shrugged off in equities is doing the pricing in rates, with the pump, freight and import channels feeding an inflation passthrough that a hawkish Federal Reserve has shown no urge to look through. Equity investors are effectively long the diplomacy branch while the rates market prices the passthrough branch, and both trades cannot be right at once. The July 29 decision arrives with no refreshed economic projections due until September, which leaves the statement and the press conference to arbitrate.
A thin docket until the finale
The weekly calendar does the index no favours, opening with Tuesday's ADP employment change four-week average at 12:15 GMT, last at 19.75K, and initial jobless claims at 12:30 GMT on Thursday, seen at 212K after 208K. Friday brings the only red-band prints of the week, with July's preliminary S&P Global Manufacturing Purchasing Managers Index (PMI) expected at 54.5 after 53.9 and the Services PMI seen at 51 after 51.2, followed at 14:00 GMT by June new home sales after a 7.3% MoM slide.
None of it is likely to move the index the way July 29 can, when the FOMC delivers its decision at 18:00 GMT with the statement and press conference to follow. A market that spends Monday buying a hypothetical negotiation while pricing a 41% chance of a second hike by December is carrying two contradictory positions into that room, and one of them gets marked down.
Dow Jones Industrial Average technical outlook
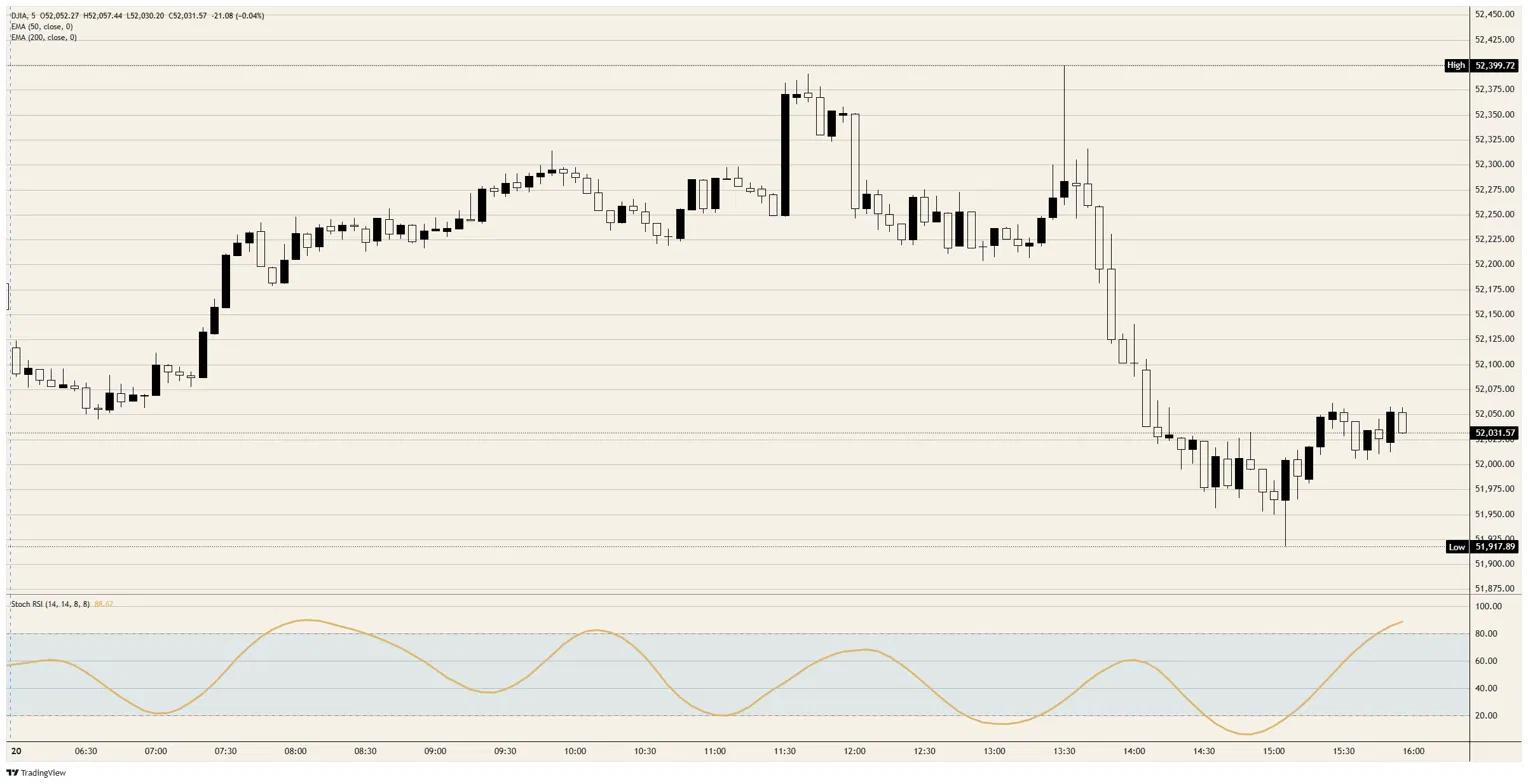
Resistance: The 52,400 area capped the session at Monday's high, with the mid-July congestion between 52,700 and 52,800 above it and the record near 53,300 as the final ceiling.
Support: The session low near 51,900 is the first floor, backed by the 50-day Exponential Moving Average near 51,400 and the early-July shelf around 51,200 beneath that.
Bias: Lower. The index has printed lower highs since setting its record near 53,300 earlier this month, the daily Stochastic Relative Strength Index has rolled over from overbought to mid-range, and Monday's bid elsewhere rests on a diplomatic aside rather than anything signed. A daily close below the 51,900 area exposes the 50-day EMA near 51,400, and only a decisive reclaim of 52,400 puts the record back in the conversation.
Dow Jones 5-minute chart
Dow Jones FAQs
The Dow Jones Industrial Average, one of the oldest stock market indices in the world, is compiled of the 30 most traded stocks in the US. The index is price-weighted rather than weighted by capitalization. It is calculated by summing the prices of the constituent stocks and dividing them by a factor, currently 0.152. The index was founded by Charles Dow, who also founded the Wall Street Journal. In later years it has been criticized for not being broadly representative enough because it only tracks 30 conglomerates, unlike broader indices such as the S&P 500.
Many different factors drive the Dow Jones Industrial Average (DJIA). The aggregate performance of the component companies revealed in quarterly company earnings reports is the main one. US and global macroeconomic data also contributes as it impacts on investor sentiment. The level of interest rates, set by the Federal Reserve (Fed), also influences the DJIA as it affects the cost of credit, on which many corporations are heavily reliant. Therefore, inflation can be a major driver as well as other metrics which impact the Fed decisions.
Dow Theory is a method for identifying the primary trend of the stock market developed by Charles Dow. A key step is to compare the direction of the Dow Jones Industrial Average (DJIA) and the Dow Jones Transportation Average (DJTA) and only follow trends where both are moving in the same direction. Volume is a confirmatory criteria. The theory uses elements of peak and trough analysis. Dow’s theory posits three trend phases: accumulation, when smart money starts buying or selling; public participation, when the wider public joins in; and distribution, when the smart money exits.
There are a number of ways to trade the DJIA. One is to use ETFs which allow investors to trade the DJIA as a single security, rather than having to buy shares in all 30 constituent companies. A leading example is the SPDR Dow Jones Industrial Average ETF (DIA). DJIA futures contracts enable traders to speculate on the future value of the index and Options provide the right, but not the obligation, to buy or sell the index at a predetermined price in the future. Mutual funds enable investors to buy a share of a diversified portfolio of DJIA stocks thus providing exposure to the overall index.
추천 기사


