


Bitcoin Price Forecast: BTC extends correction as ETF outflow intensifies, fresh US-Iran growing tensions
- Bitcoin extends its correction, trading below $74,000 on Thursday amid fresh tensions between the US and Iran.
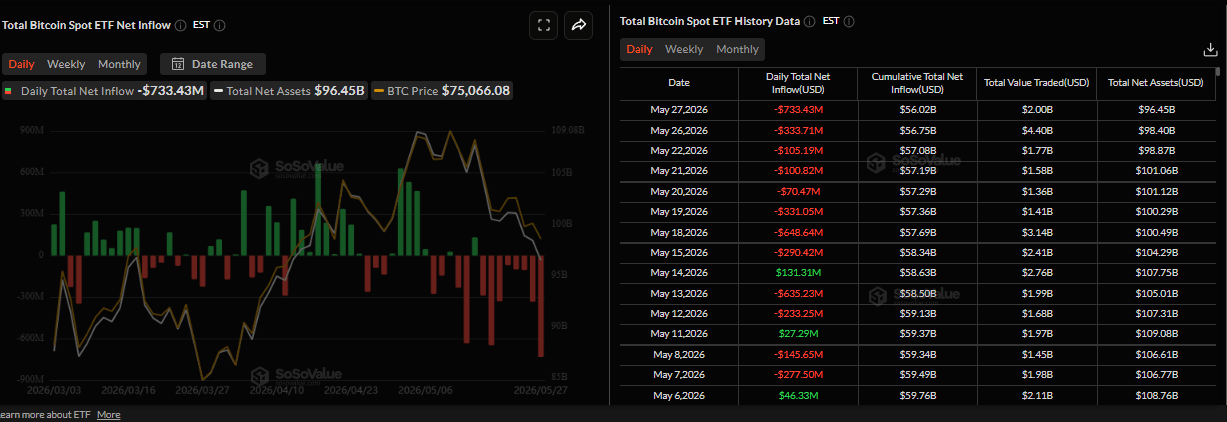
- US-listed spot ETFs recorded an outflow of $733.43 million on Wednesday, continuing the strong sell-off since mid-May.
- On-chain data shows the Crypto King demand continues to contract, raising the risk of a deeper correction if broader market sentiment remains weak.
Bitcoin (BTC) extends its losses, trading below $74,000 on Thursday amid fresh tensions between the US and Iran. Institutional demand continues to fade with spot Exchange Traded Funds (ETFs) recording strong steady outflows since mid-May. In addition, on-chain data shows demand for BTC continues to contract, raising the risk of a deeper correction.
US-Iran growing tensions cap risk appetite
Bitcoin and the broader crypto market corrected during the early Asian trading session on Thursday as the news came in that Iran’s Revolutionary Guards had targeted a US airbase after what they described as an early morning US attack near Bandar Abbas airport, reported Reuters.
They warned that any repeat of what they called aggression would draw a “more decisive” response and said responsibility for the consequences lay with the “aggressor”.
On top of this, the ongoing major US-Iran disagreements over Tehran’s nuclear program and the Strait of Hormuz keep the geopolitical risk premium in play, dampening hopes for a diplomatic solution to end a three-month-old Iran war. These developments have dampened investors’ appetite for risk, pushing the largest cryptocurrency by market capitalization below the $74,000 mark on Thursday.
ETF outflows continue
Institutional demand has continued to fade so far this week. SoSoValue data showed the spot ETFs recorded an outflow of $733.43 million on Wednesday, continuing the strong sell-off since mid-May. If this trend continues this week, BTC could see further correction.
In an exclusive interview with Ignacio Aguirre, Bitget CMO, told FXStreet, “In the short term, I expect a modest upside toward $76,000–$78,000 by the weekend if key support holds and positive momentum builds from technical rebounds or reduced tensions.”
Aguirre continued that the overall outlook remains constructive. BTC’s role as a decentralized hedge shines in uncertain environments, positioning it for stronger performance on any positive resolution in global liquidity or risk sentiment.
On-chain outlook shows cautious signs
CryptoQuant’s chart below shows that Crypto King’s overall demand has flipped into net contraction.
Perpetual futures demand, which drove the April–May rally, reversed sharply as prices hit overhead supply at $82,000, prompting traders to close leveraged longs and removing the marginal buying pressure that had sustained the move.
-1779962776215.png)
In addition, BTC 30-day demand growth for spot ETFs has turned net sellers, reaching its lowest level in nearly a month, indicating further weakness in BTC’s demand.
 (1)-1779962794798.png)
Bitcoin Price Forecast: Bears are in control
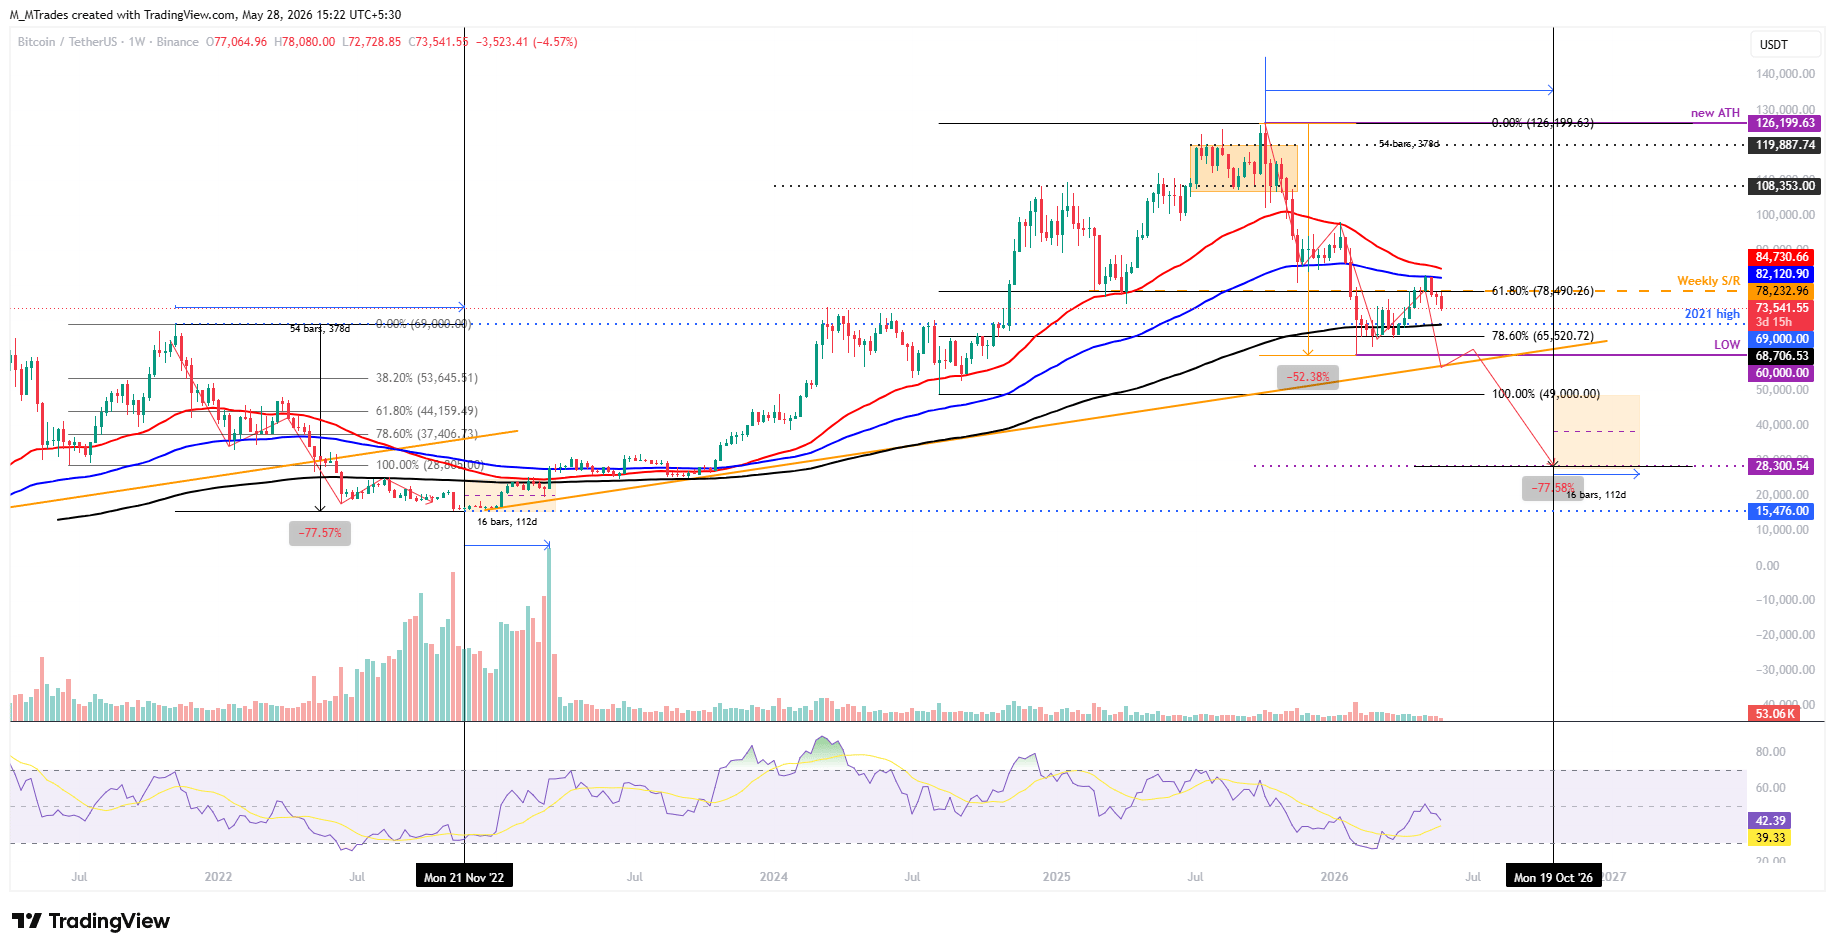
Bitcoin's weekly chart shows price action resembling that of the late-2021-2022 bear market. In 2021, BTC hit a new all-time high (ATH) of $69,000 in November and corrected 77.57% from the high to the 2022 bottom of around $15,476 in November 2022, in 378 days. Then consolidated for the next 112 days, before the start of another bull cycle in 2023.
In the 2025-2026 period, BTC reached a new ATH at $126,199 in October 2025 and has since corrected by 52%, reaching a low of $60,000 in the first week of February. Then, BTC recovered within the broader downtrend, retested, and faced rejection at the 100-Week EMA at $82,119 in early May. This rally between February and early May is considered by many analysts a bull trap before the primary downtrend resumes. Since the retest of this 100-Week EMA, BTC has corrected by over 10%, trading below $74,000 on Thursday.
If the current regime follows the 2021-2022 pattern, BTC could see further correction, reaching a low of $28,300 (77.51% from the 2025 ATH) by mid-October. Then it would consolidate for the next 112 days before the start of another bull cycle (similarly seen in 2023 as discussed above).
On the daily chart, BTC maintains a bearish near-term bias, as price remains below the key EMAs. The 50-day EMA at $76,537 and the 100-day EMA at $76,746 form a nearby cap above price, while the 200-day EMA at $81,243 reinforces the broader overhead supply.
Momentum remains weak, with the Relative Strength Index (RSI) slipping toward oversold territory near 35 and the Moving Average Convergence Divergence (MACD) remaining in negative territory, with a declining line below zero, suggesting persistent downside pressure.
On the downside, initial support lies at the former rising trendline break area around $71,648, ahead of the 23.6% Fibonacci retracement at $68,950 (drawn from the January high to the February low), which marks a more significant floor if selling extends.
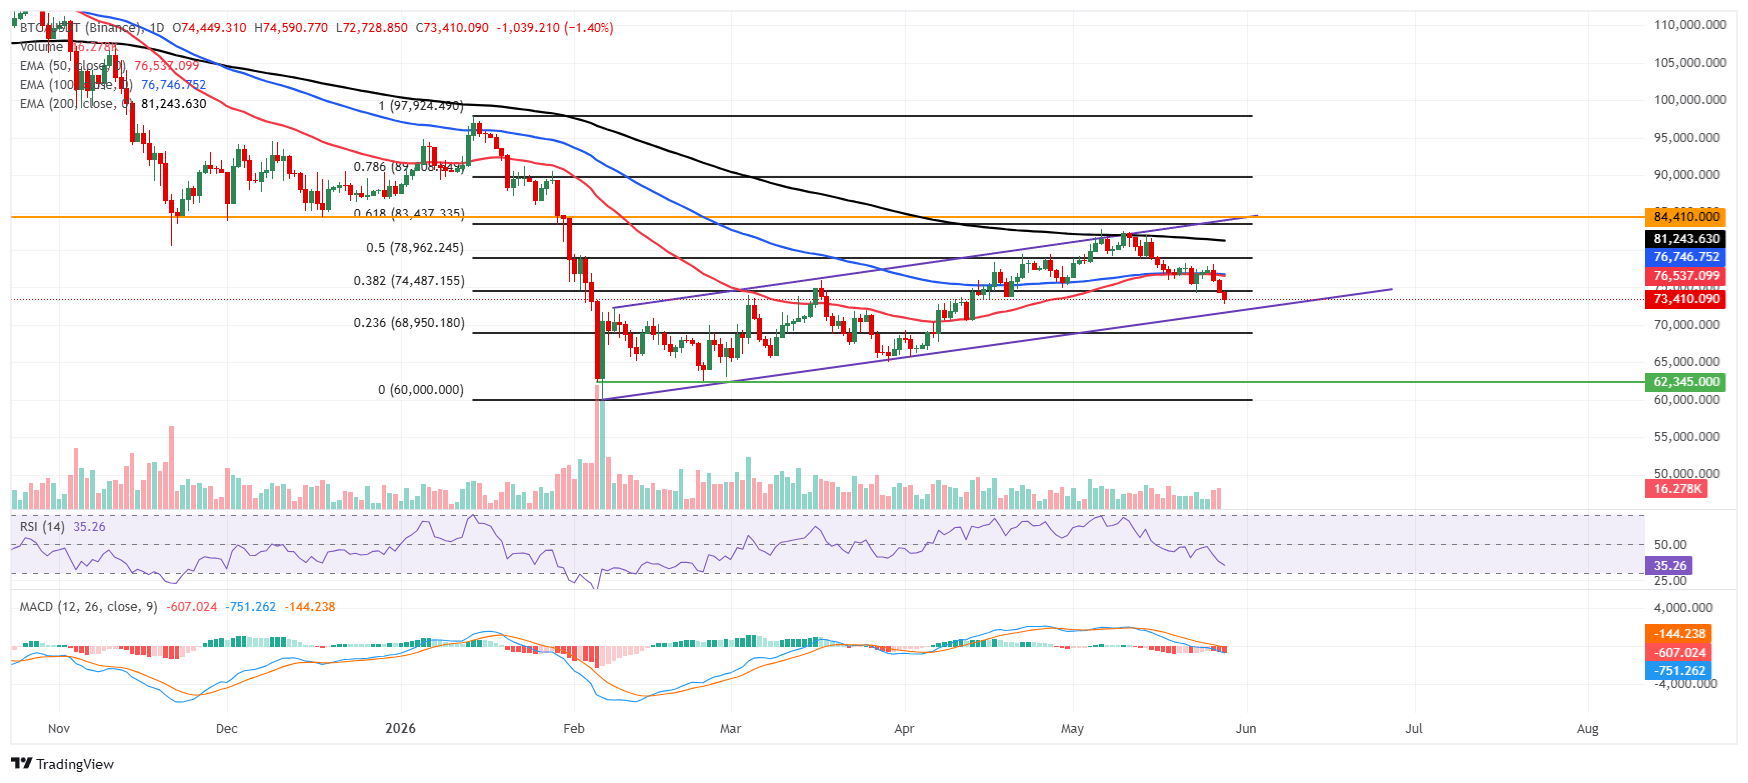
On the topside, immediate resistance is seen at the 38.2% Fibonacci retracement near $74,487, with the cluster of the 50-day and 100-day EMAs just above $76,500-$76,750 acting as a dense supply zone before the 50% retracement at $78,962 and the 200-day EMA around $81,244. Beyond there, the 61.8% retracement at $83,437 and the horizontal barrier at $84,410 define the upper resistance band that would need to be reclaimed to ease the current bearish tone.
(The technical analysis of this story was written with the help of an AI tool.)
Bitcoin, altcoins, stablecoins FAQs
Bitcoin is the largest cryptocurrency by market capitalization, a virtual currency designed to serve as money. This form of payment cannot be controlled by any one person, group, or entity, which eliminates the need for third-party participation during financial transactions.
Altcoins are any cryptocurrency apart from Bitcoin, but some also regard Ethereum as a non-altcoin because it is from these two cryptocurrencies that forking happens. If this is true, then Litecoin is the first altcoin, forked from the Bitcoin protocol and, therefore, an “improved” version of it.
Stablecoins are cryptocurrencies designed to have a stable price, with their value backed by a reserve of the asset it represents. To achieve this, the value of any one stablecoin is pegged to a commodity or financial instrument, such as the US Dollar (USD), with its supply regulated by an algorithm or demand. The main goal of stablecoins is to provide an on/off-ramp for investors willing to trade and invest in cryptocurrencies. Stablecoins also allow investors to store value since cryptocurrencies, in general, are subject to volatility.
Bitcoin dominance is the ratio of Bitcoin's market capitalization to the total market capitalization of all cryptocurrencies combined. It provides a clear picture of Bitcoin’s interest among investors. A high BTC dominance typically happens before and during a bull run, in which investors resort to investing in relatively stable and high market capitalization cryptocurrency like Bitcoin. A drop in BTC dominance usually means that investors are moving their capital and/or profits to altcoins in a quest for higher returns, which usually triggers an explosion of altcoin rallies.
추천 기사


