


AI Coin Update: Near Protocol and Grass surge as AI narrative gains traction
- Near Protocol surges by over 18% on Friday, extending gains toward $2.40 resistance.
- Grass extends gains for a third consecutive day, building on growing demand and support from major moving averages.
- Nvidia’s strong revenue forecasts fuel the AI narrative as attention shifts from Bitcoin and major altcoins.
Artificial Intelligence (AI) tokens Near Protocol (NEAR) and Grass (GRASS) are extending gains on Friday, building on improving sentiment in the sector. NEAR is up 18%, trading near the $2.40 resistance, while GRASS hovers around $0.45.
The sector’s total market capitalization averages $26 billion, up more than 7% in the last 24 hours, according to CoinGecko. Meanwhile, the broader crypto market appears to be lagging, with Bitcoin (BTC) teetering around $77,000 after a failed attempt to extend its recovery toward $80,000.
Altcoin majors, including Ethereum (ETH) and Ripple (XRP), mirror Bitcoin’s exhaustion, holding above support at $2,100 and $1.35, respectively.
Nvidia projections fuel AI tokens narrative
Nvidia posted exceptional first-quarter results, with record revenue of $81.6 billion, an 85% YoY increase that beat analysts' expectations of roughly $79 billion. The revenue was mainly driven by data centre demand, which reached a staggering $75.2 billion, fueled by demand for GPUs and AI infrastructure.
The company foresees continued revenue growth at $91 billion in Q2, even though analysts estimate $86-$87 billion. Nvidia projected that its sales would grow to reach $1 trillion by the end of 2027, driven by demand for AI chips.
Nvidia’s notable revenue and growth projections are driving the AI token narrative, with the sector expected to align with the largest manufacturer of AI computing chips.
Price analysis: Grass buyers tighten their grip
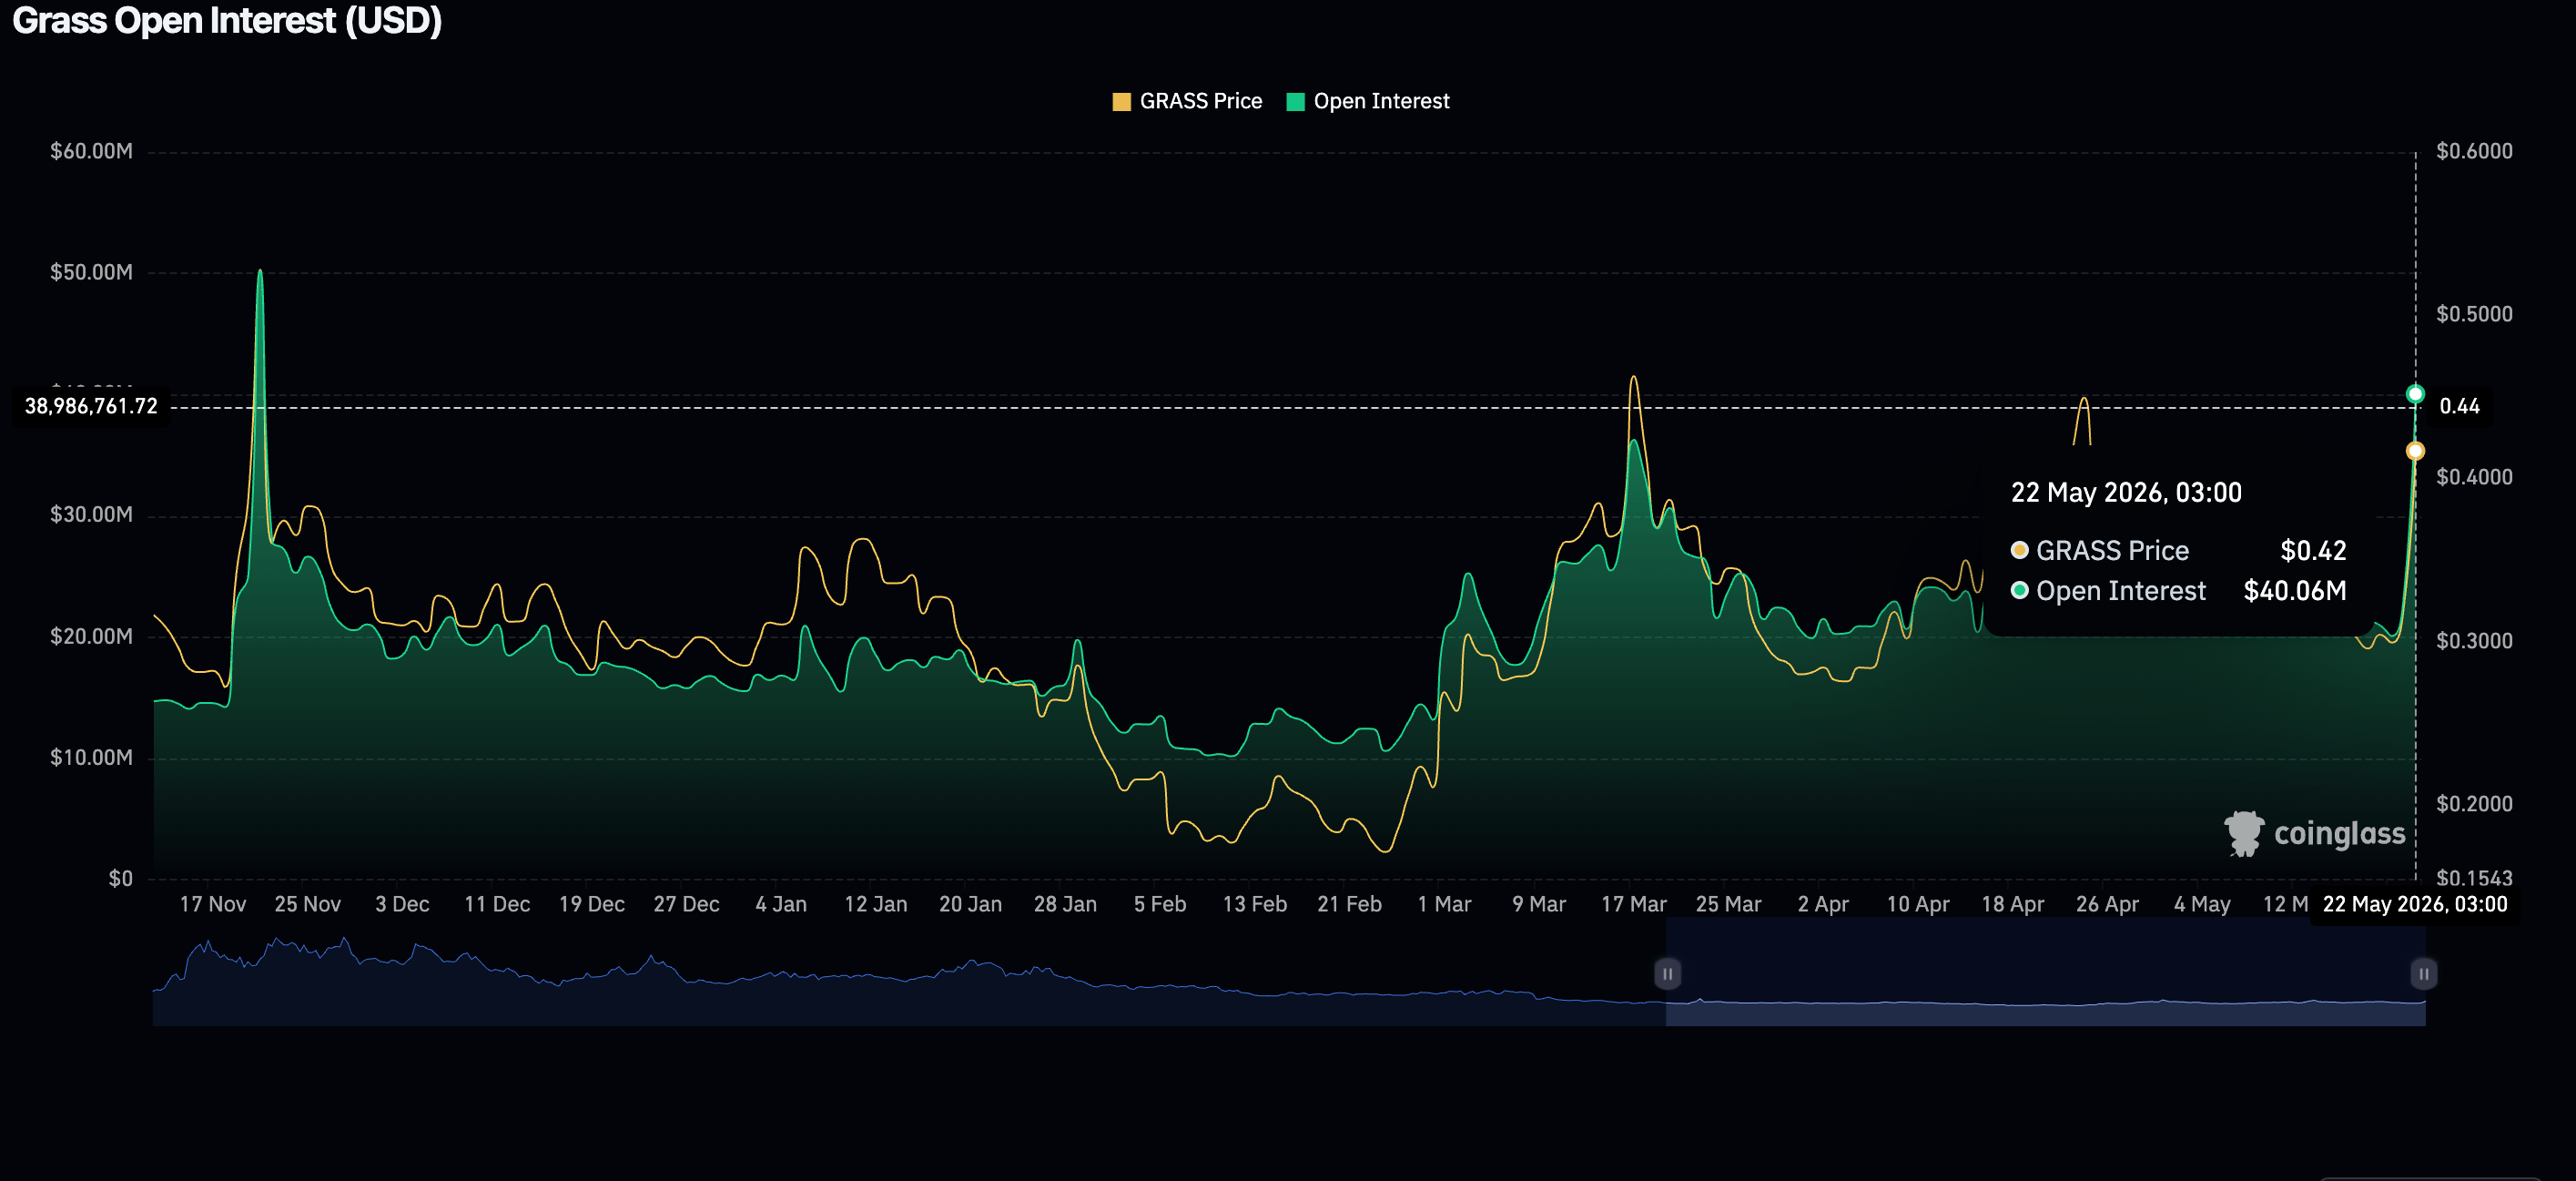
Grass is trading around $0.45, preserving three consecutive days of gains as retail demand expands. According to CoinGlass data, the perpetual futures Open Interest (OI) rose to $40 million on Friday, up from $23.34 million the previous day. This indicates that traders are increasing risk exposure and raising the odds of a sustained uptrend.
Grass sits above the 200-day Exponential Moving Average (EMA at $0.42, the 50-day EMA and the 100-day EMA, which converge around $0.34. The Moving Average Convergence Divergence (MACD) histogram remains positive, reinforcing the constructive outlook.
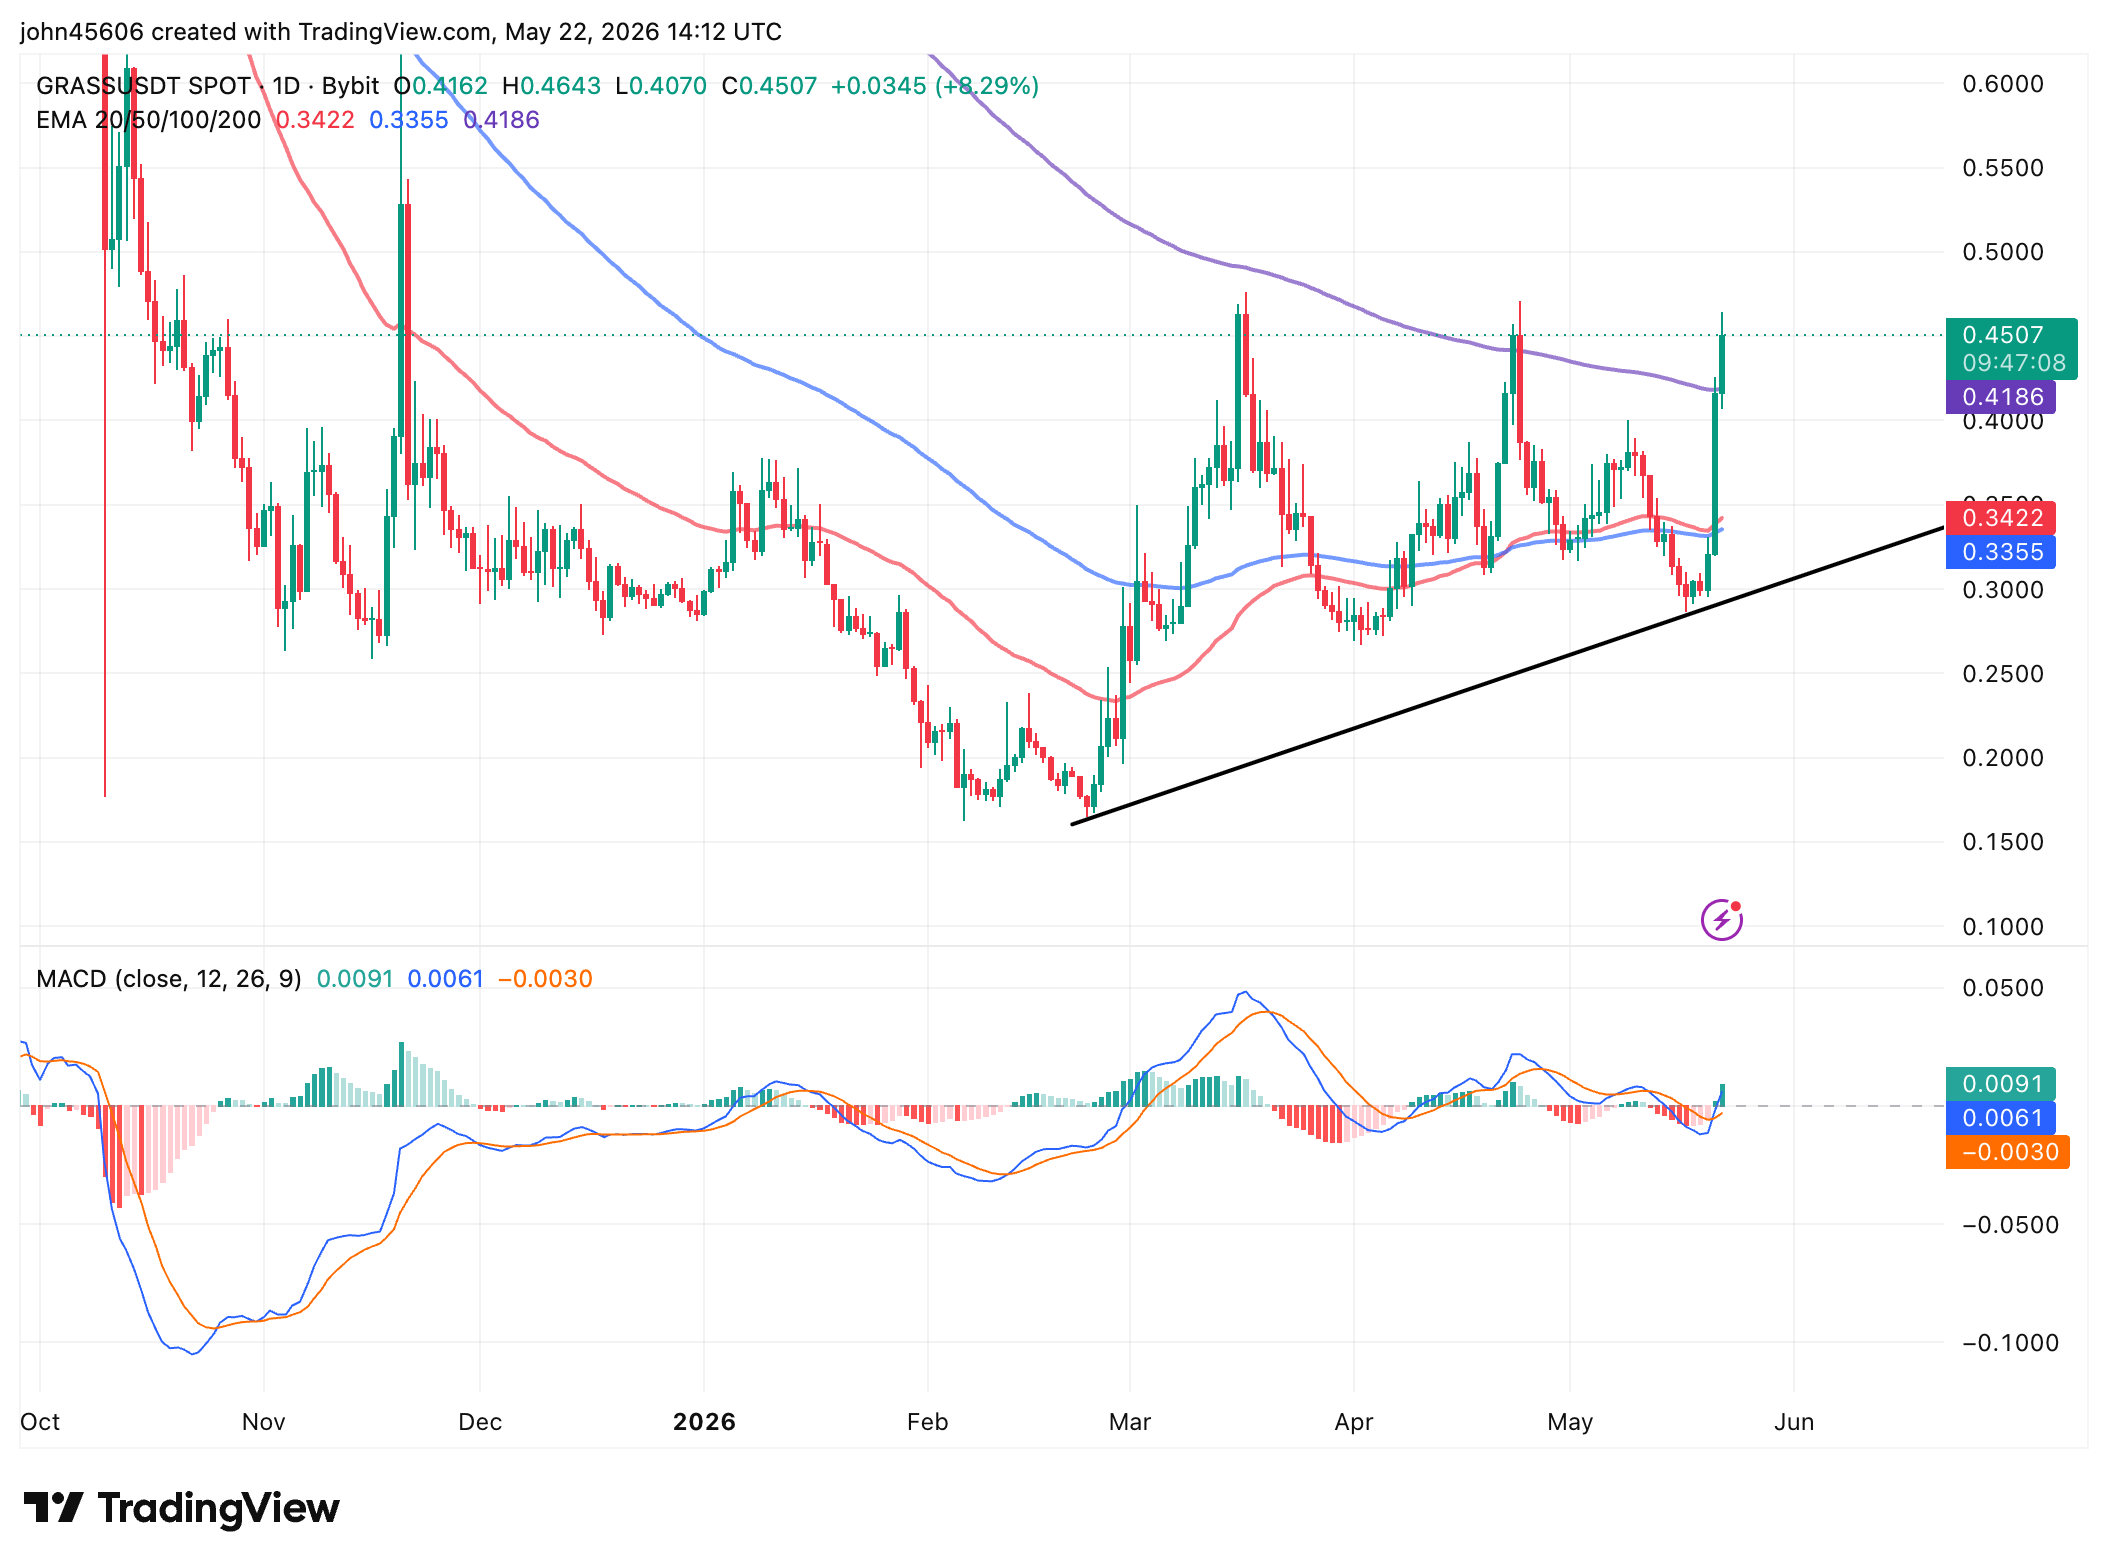
A daily close above $0.45 would affirm a strong bullish grip, increasing the probability that Grass extends its uptrend above the psychological $0.50 threshold. On the downside, initial support lies at the 200-day EMA at $0.42, followed by the confluence formed by the 50-day and 100-day EMA at $0.34.
Technical outlook: Near Protocol eyes $2.50 breakout
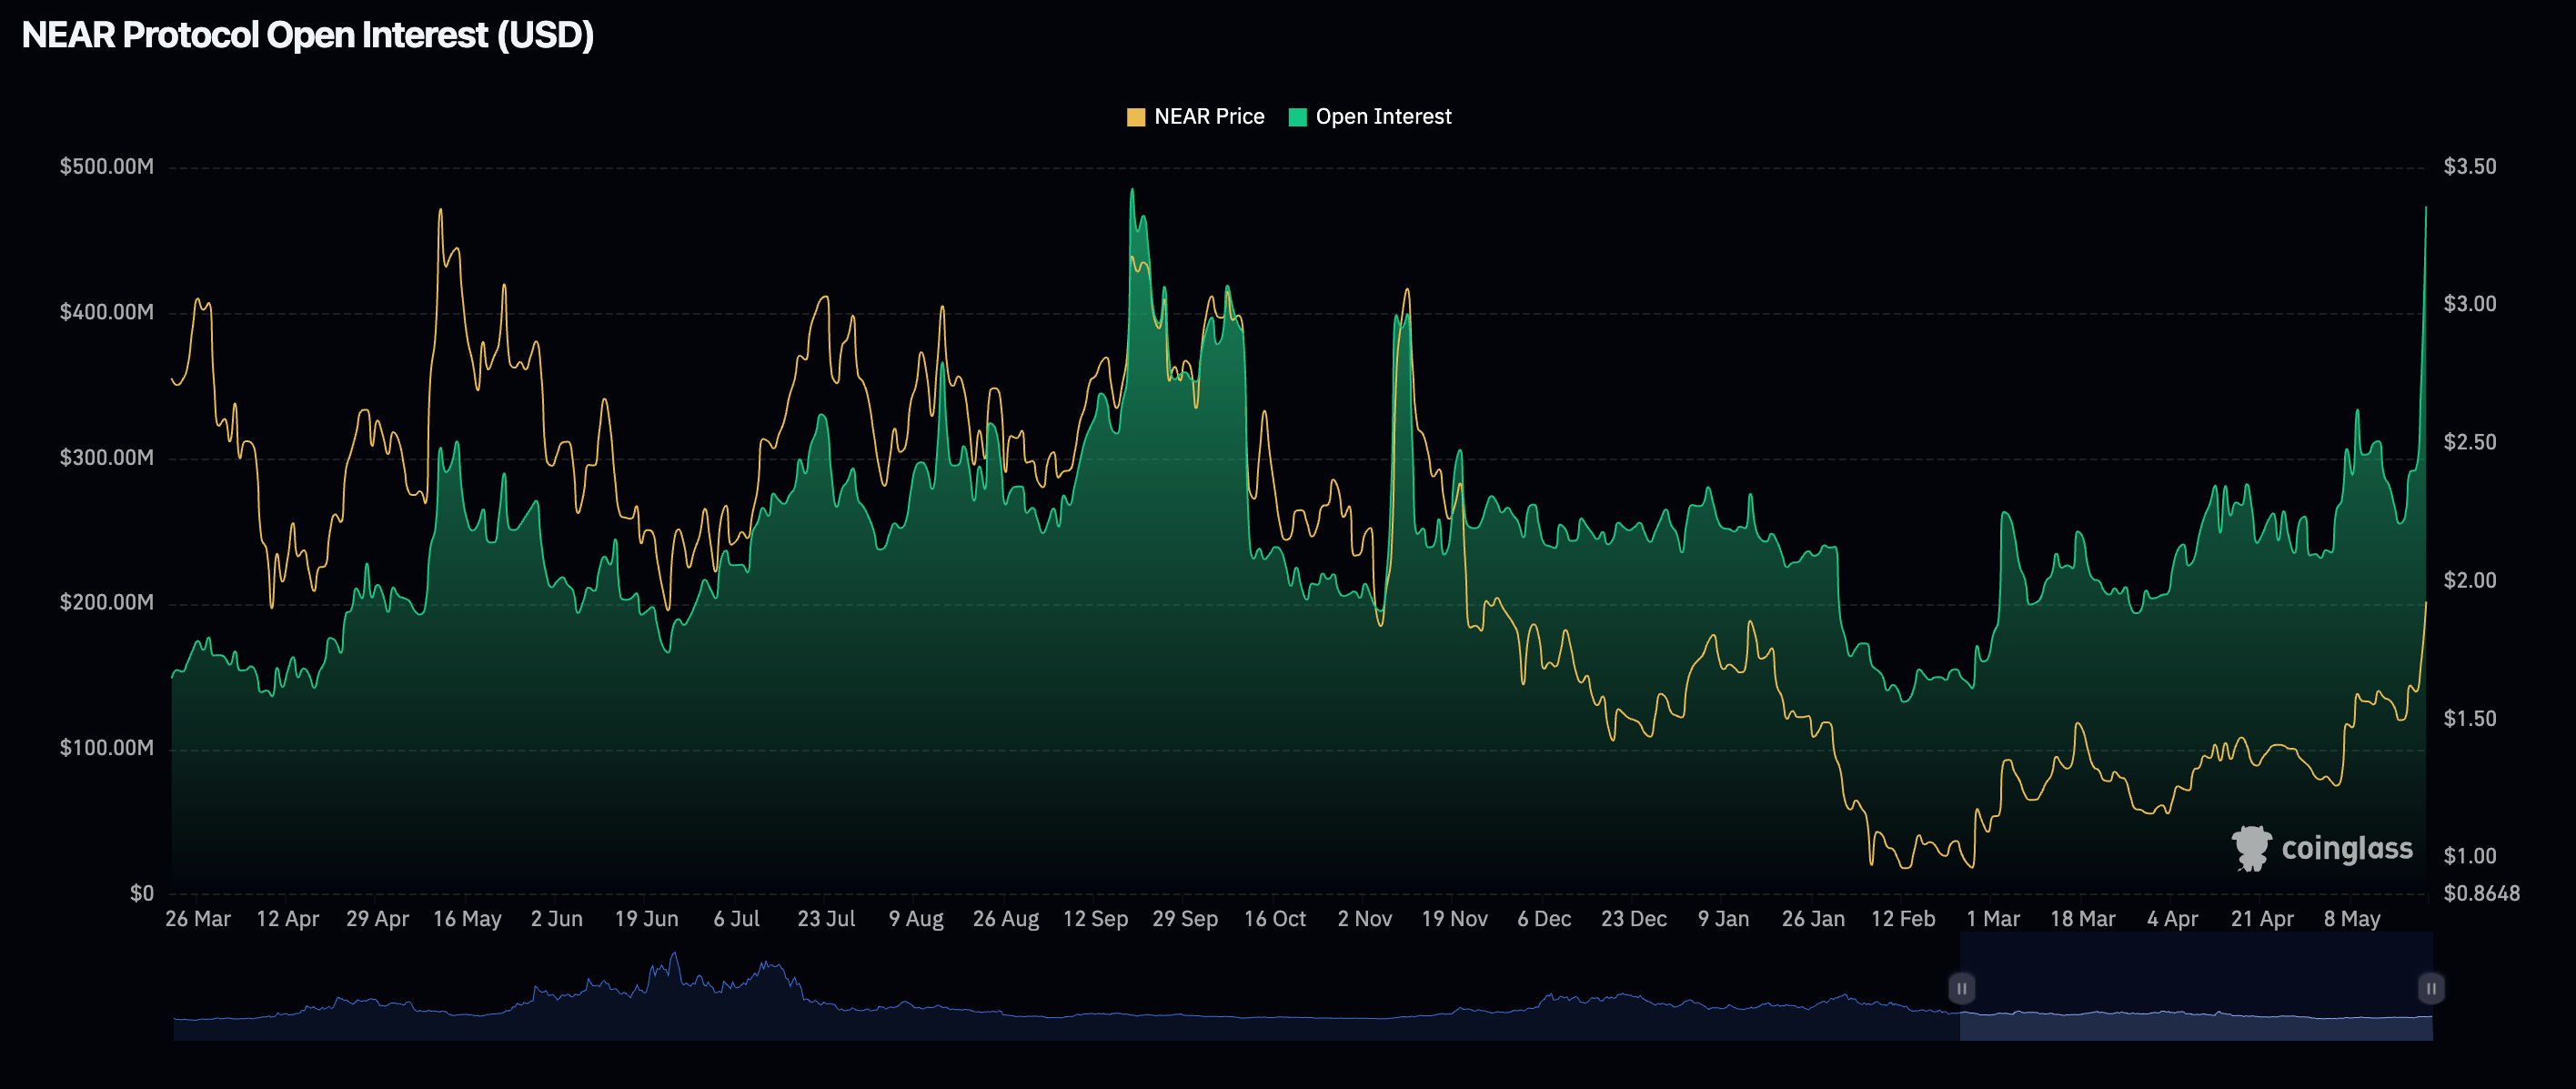
Near Protocol ticks up, trading near resistance at $2.40, supported by strong, improving momentum indicators and growing demand in the derivatives market. CoinGlass data shows that OI has surged to $473 million on Friday, from $347 million the day before.
NEAR is holding a bullish near-term bias and hovering around the 38.2% Fibonacci Retracement at $2.29. The pair stands well above the 50-day, 100-day and 200-day EMAs clustered between roughly $1.44 and $1.62, which reinforces an underlying uptrend.
Momentum remains stretched but positive, with the Relative Strength Index (RSI) hovering deep in overbought territory near 85 on the daily chart, while the MACD histogram expands on the positive side, suggesting buyers still retain control despite rising risks of consolidation.
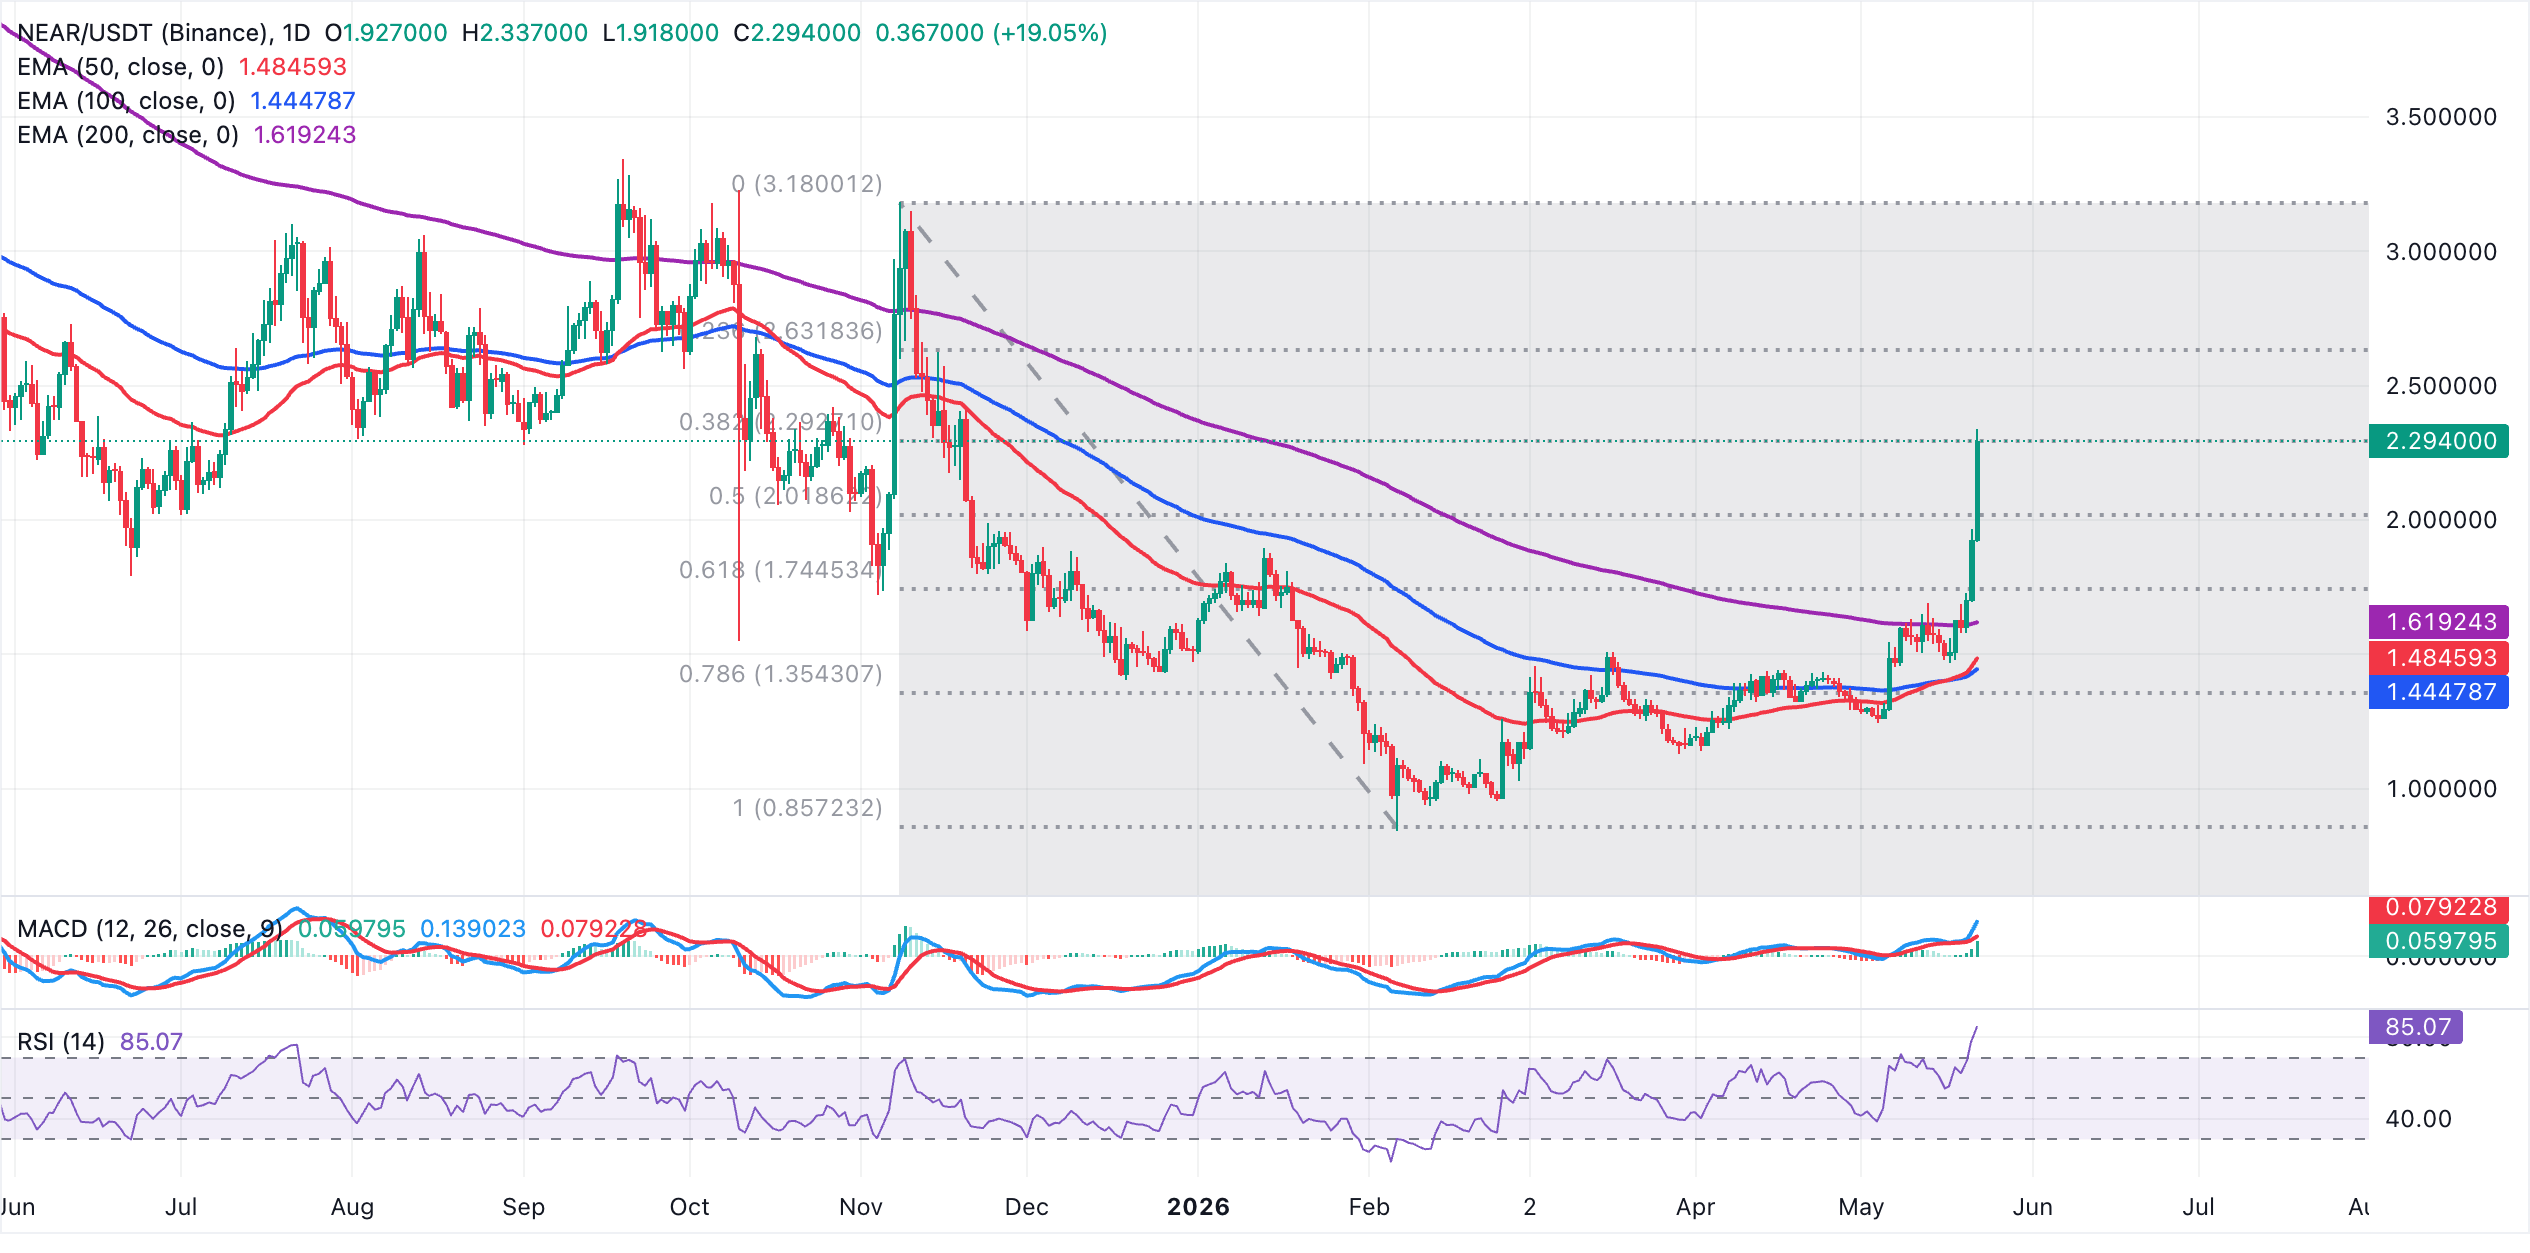
On the downside, initial support is seen at the 50.0% Fibonacci retracement at $2.02, followed by the 61.8% Fibonacci retracement at $1.74. Those levels precede the 200-day EMA near $1.62 and then the shorter-term 50-day and 100-day EMAs at $1.48 and $1.44, respectively.
On the topside, the next significant resistance emerges at the 23.6% Fibonacci retracement at $2.63, and a sustained break above this barrier would open the way for an extension of the advance, while failure to do so could trigger a pullback toward the nearby Fibonacci supports.
(The technical analysis of this story was written with the help of an AI tool.)
Open Interest, funding rate FAQs
Higher Open Interest is associated with higher liquidity and new capital inflow to the market. This is considered the equivalent of increase in efficiency and the ongoing trend continues. When Open Interest decreases, it is considered a sign of liquidation in the market, investors are leaving and the overall demand for an asset is on a decline, fueling a bearish sentiment among investors.
Funding fees bridge the difference between spot prices and prices of futures contracts of an asset by increasing liquidation risks faced by traders. A consistently high and positive funding rate implies there is a bullish sentiment among market participants and there is an expectation of a price hike. A consistently negative funding rate for an asset implies a bearish sentiment, indicating that traders expect the cryptocurrency’s price to fall and a bearish trend reversal is likely to occur.
추천 기사


