


Hyperliquid Price Forecast: HYPE rallies as HIP-4 proposal supports prediction market
- Hyperliquid gains 8% above the 200-day EMA on Tuesday, building on Monday’s nearly 9% rise.
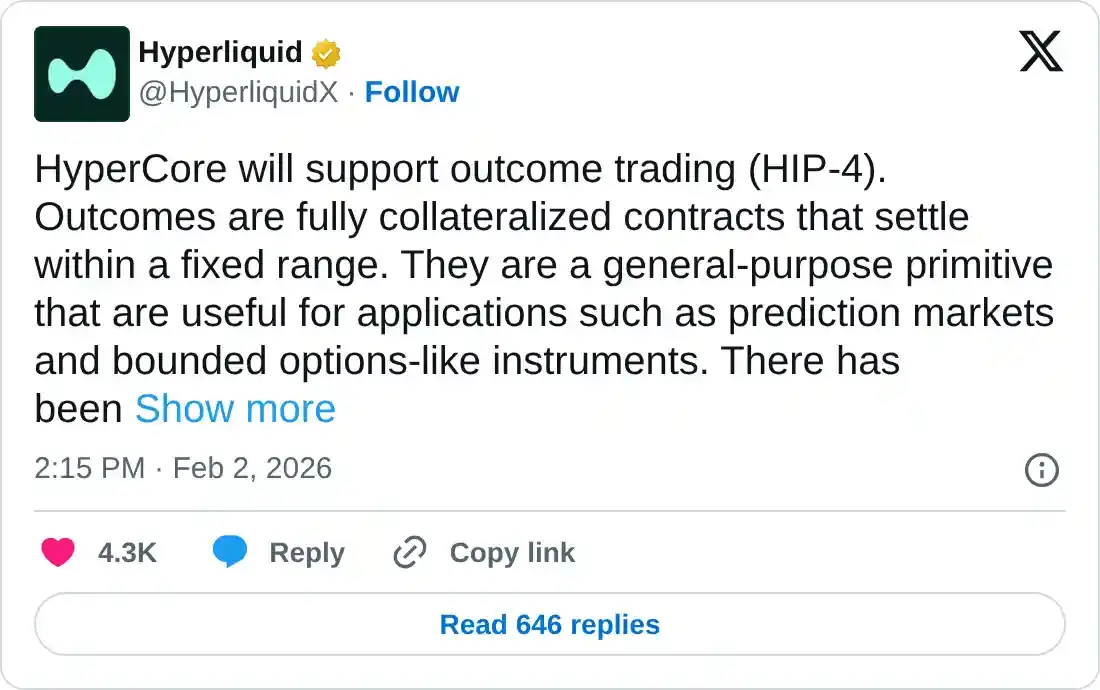
- Hyperliquid announced plans to support outcome trading with the HIP-4 proposal.
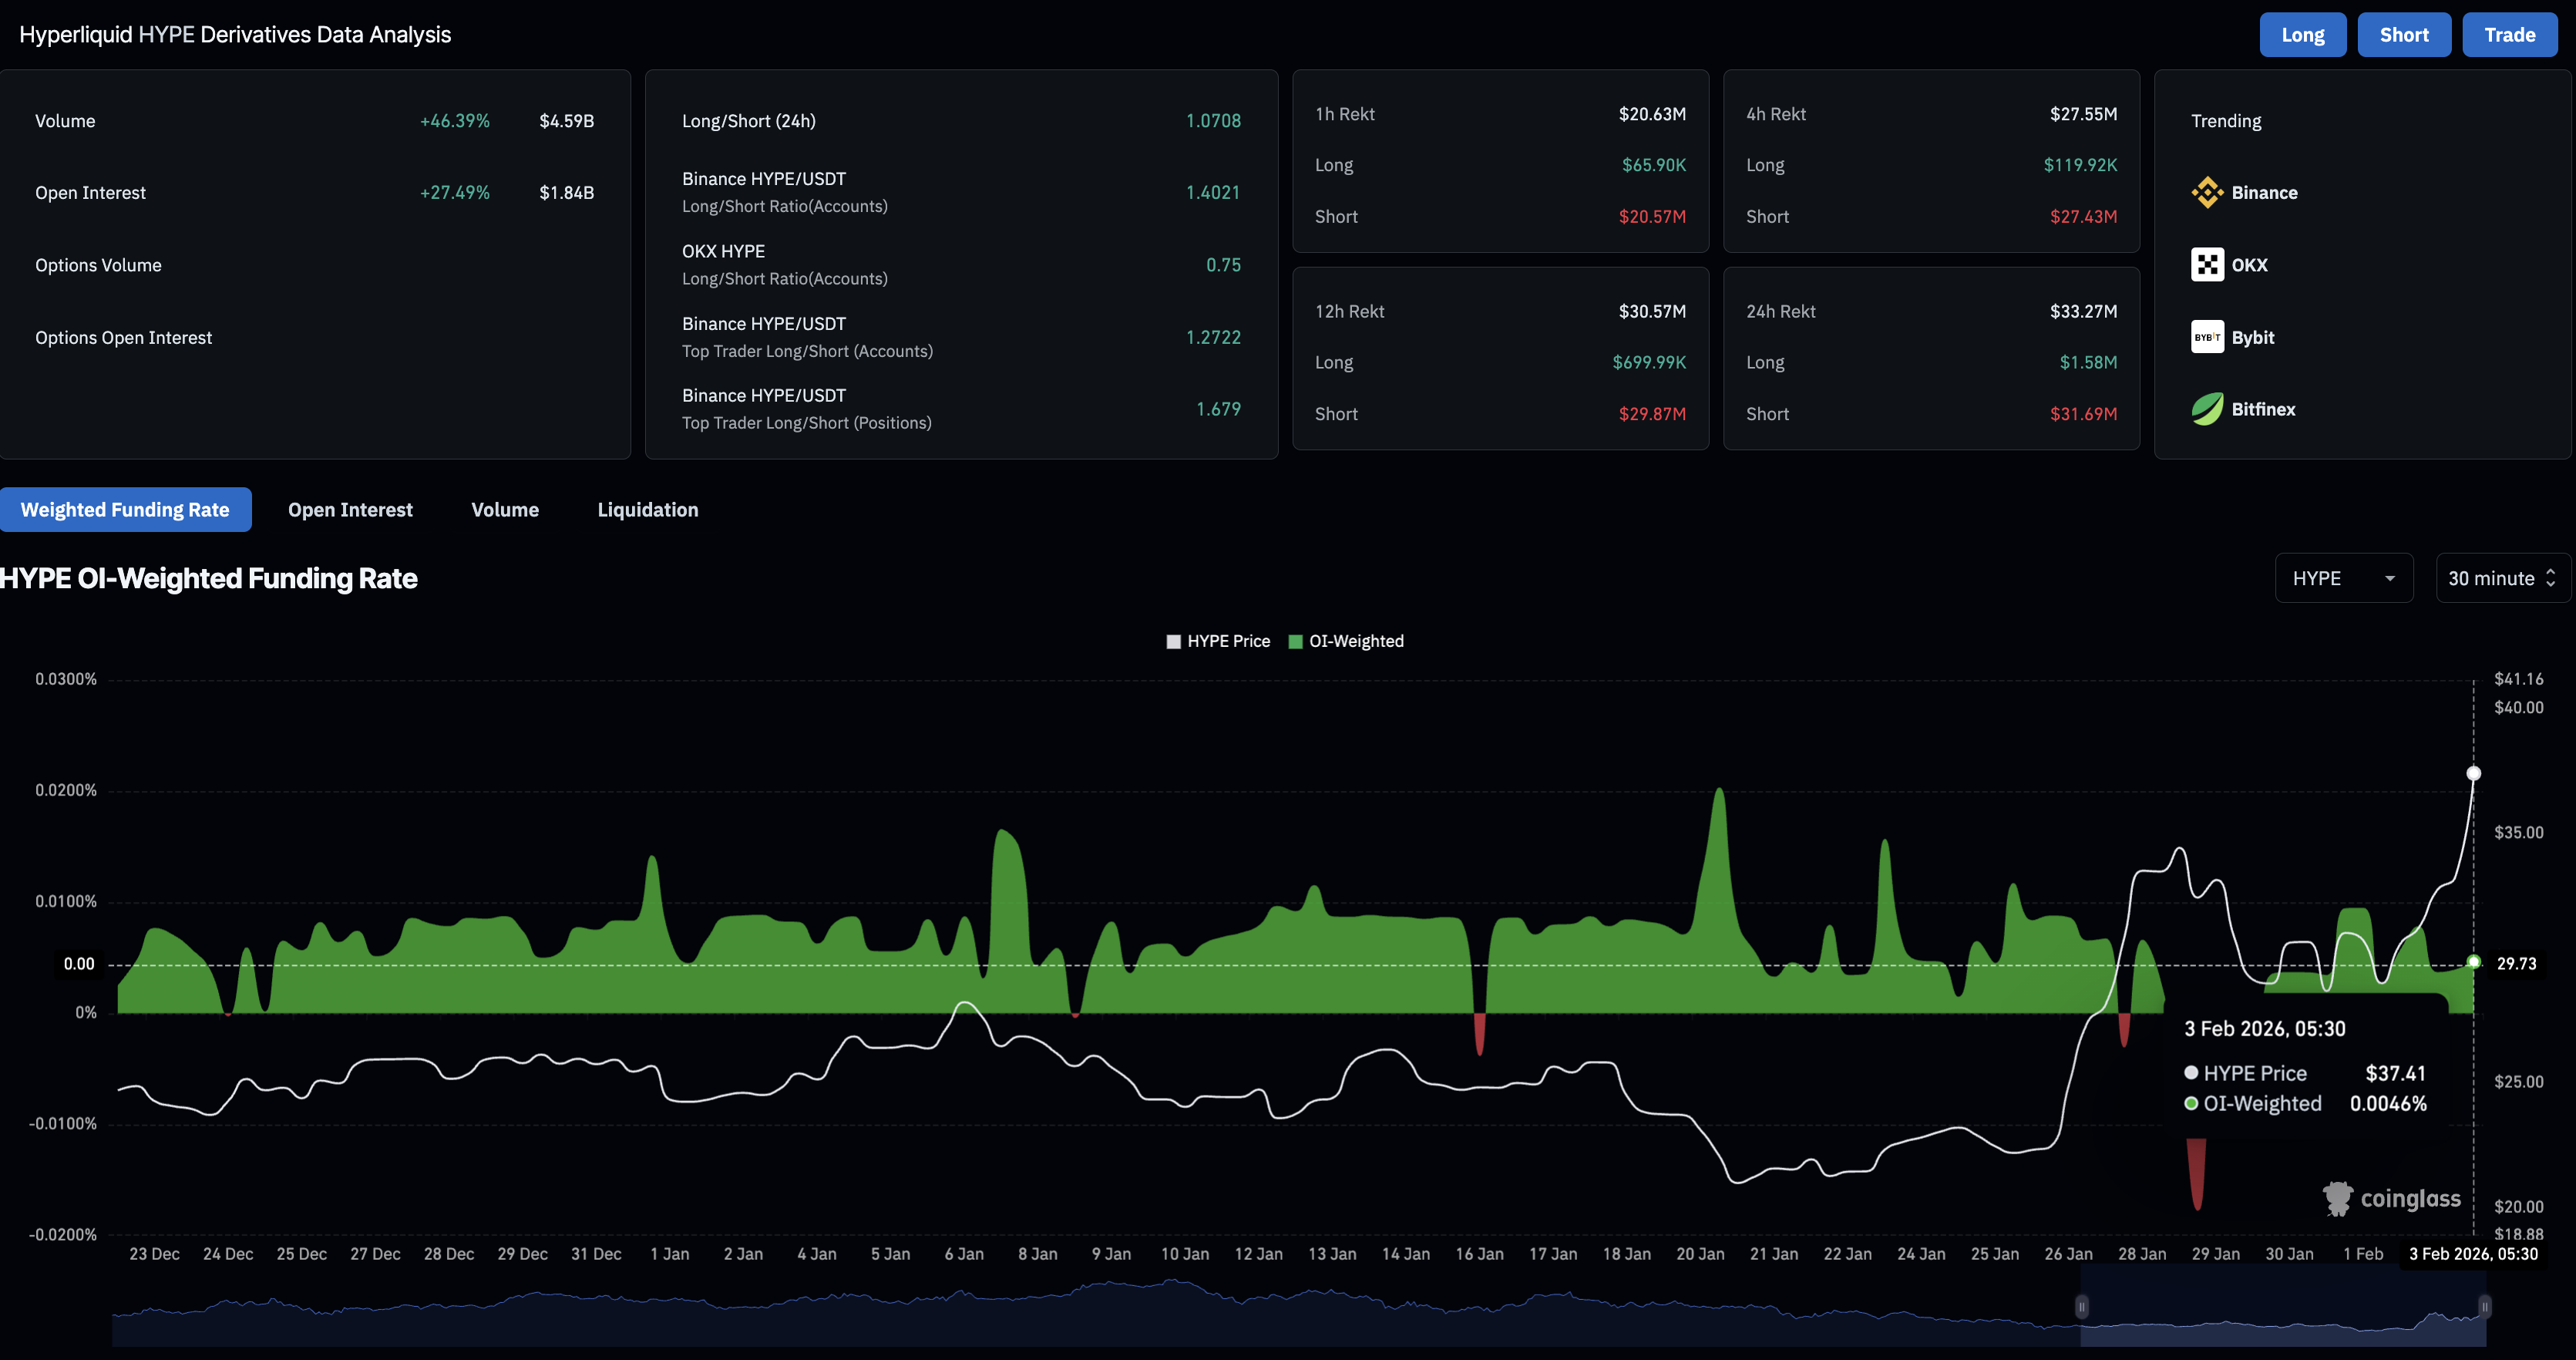
- Retail interest sparks as HYPE futures Open Interest records double-digit gains to roughly $1.85 billion.
Hyperliquid (HYPE) extended its recovery by 8% at press time on Tuesday, driven by the HIP-4 proposal to add outcome trading, referring to prediction markets and bounded options contracts. Heightened retail interest in the decentralized exchange and its token is evident from a more than 25% increase in HYPE futures Open Interest, indicating elevated capital inflows. The technical outlook for HYPE is bullish, with buying pressure and trend momentum rising.
Hyperliquid regains retail interest with plans for prediction markets
Hyperliquid announced the HIP-4 proposal on Monday during the early US trading session, which plans to add prediction markets and options contracts with fixed price ranges to compete with existing platforms such as Polymarket or Kalshi. Retail interest in prediction markets has been extensive amid volatility in global financial markets and geopolitics. This release expands the Hyperliquid exchange beyond commodity trading, as introduced in the HIP-3 proposal, reflecting steady development to better serve traders.
CoinGlass data shows that HYPE futures Open Interest (OI) jumped 27% over the last 24 hours to $1.84 billion, indicating significant inflows. Typically, such a large capital inflow in futures markets during an uptrend indicates an upside bias among traders.
A massive wipeout of short sellers over the last 24 hours, evidenced by short liquidations of $31.69 million outpacing long liquidations of $1.58 million, corroborates the upside bias in HYPE futures. Additionally, the funding rate of 0.0046% signals a bullish interest among traders.
Technical outlook: Will Hyperliquid hit $50?
Hyperliquid bounces off the 100-day Exponential Moving Average (EMA) at $30.61, resulting in 24% gains so far this week. At the time of writing, HYPE is up 14% on Tuesday, crossing the 200-day EMA at $32.89, a resistance level at $35.51 coinciding with the August 2 low and the R1 Pivot Point at $37.07.
Coupled with an upward slope in the longer EMAs above the shorter EMAs on the daily chart, this setup signals an intense recovery tone. A decisive close above $37.07 would open doors to the R2 Pivot Point at $43.15, followed by a higher resistance zone near the $50.00 psychological level.
The momentum indicators on the daily chart support the uprising. The Moving Average Convergence Divergence (MACD) steadily increases as histograms above the zero line widen, indicating rising bullish momentum. At the same time, the Relative Strength Index (RSI) at 71 enters the overbought zone, suggesting intense buying pressure.
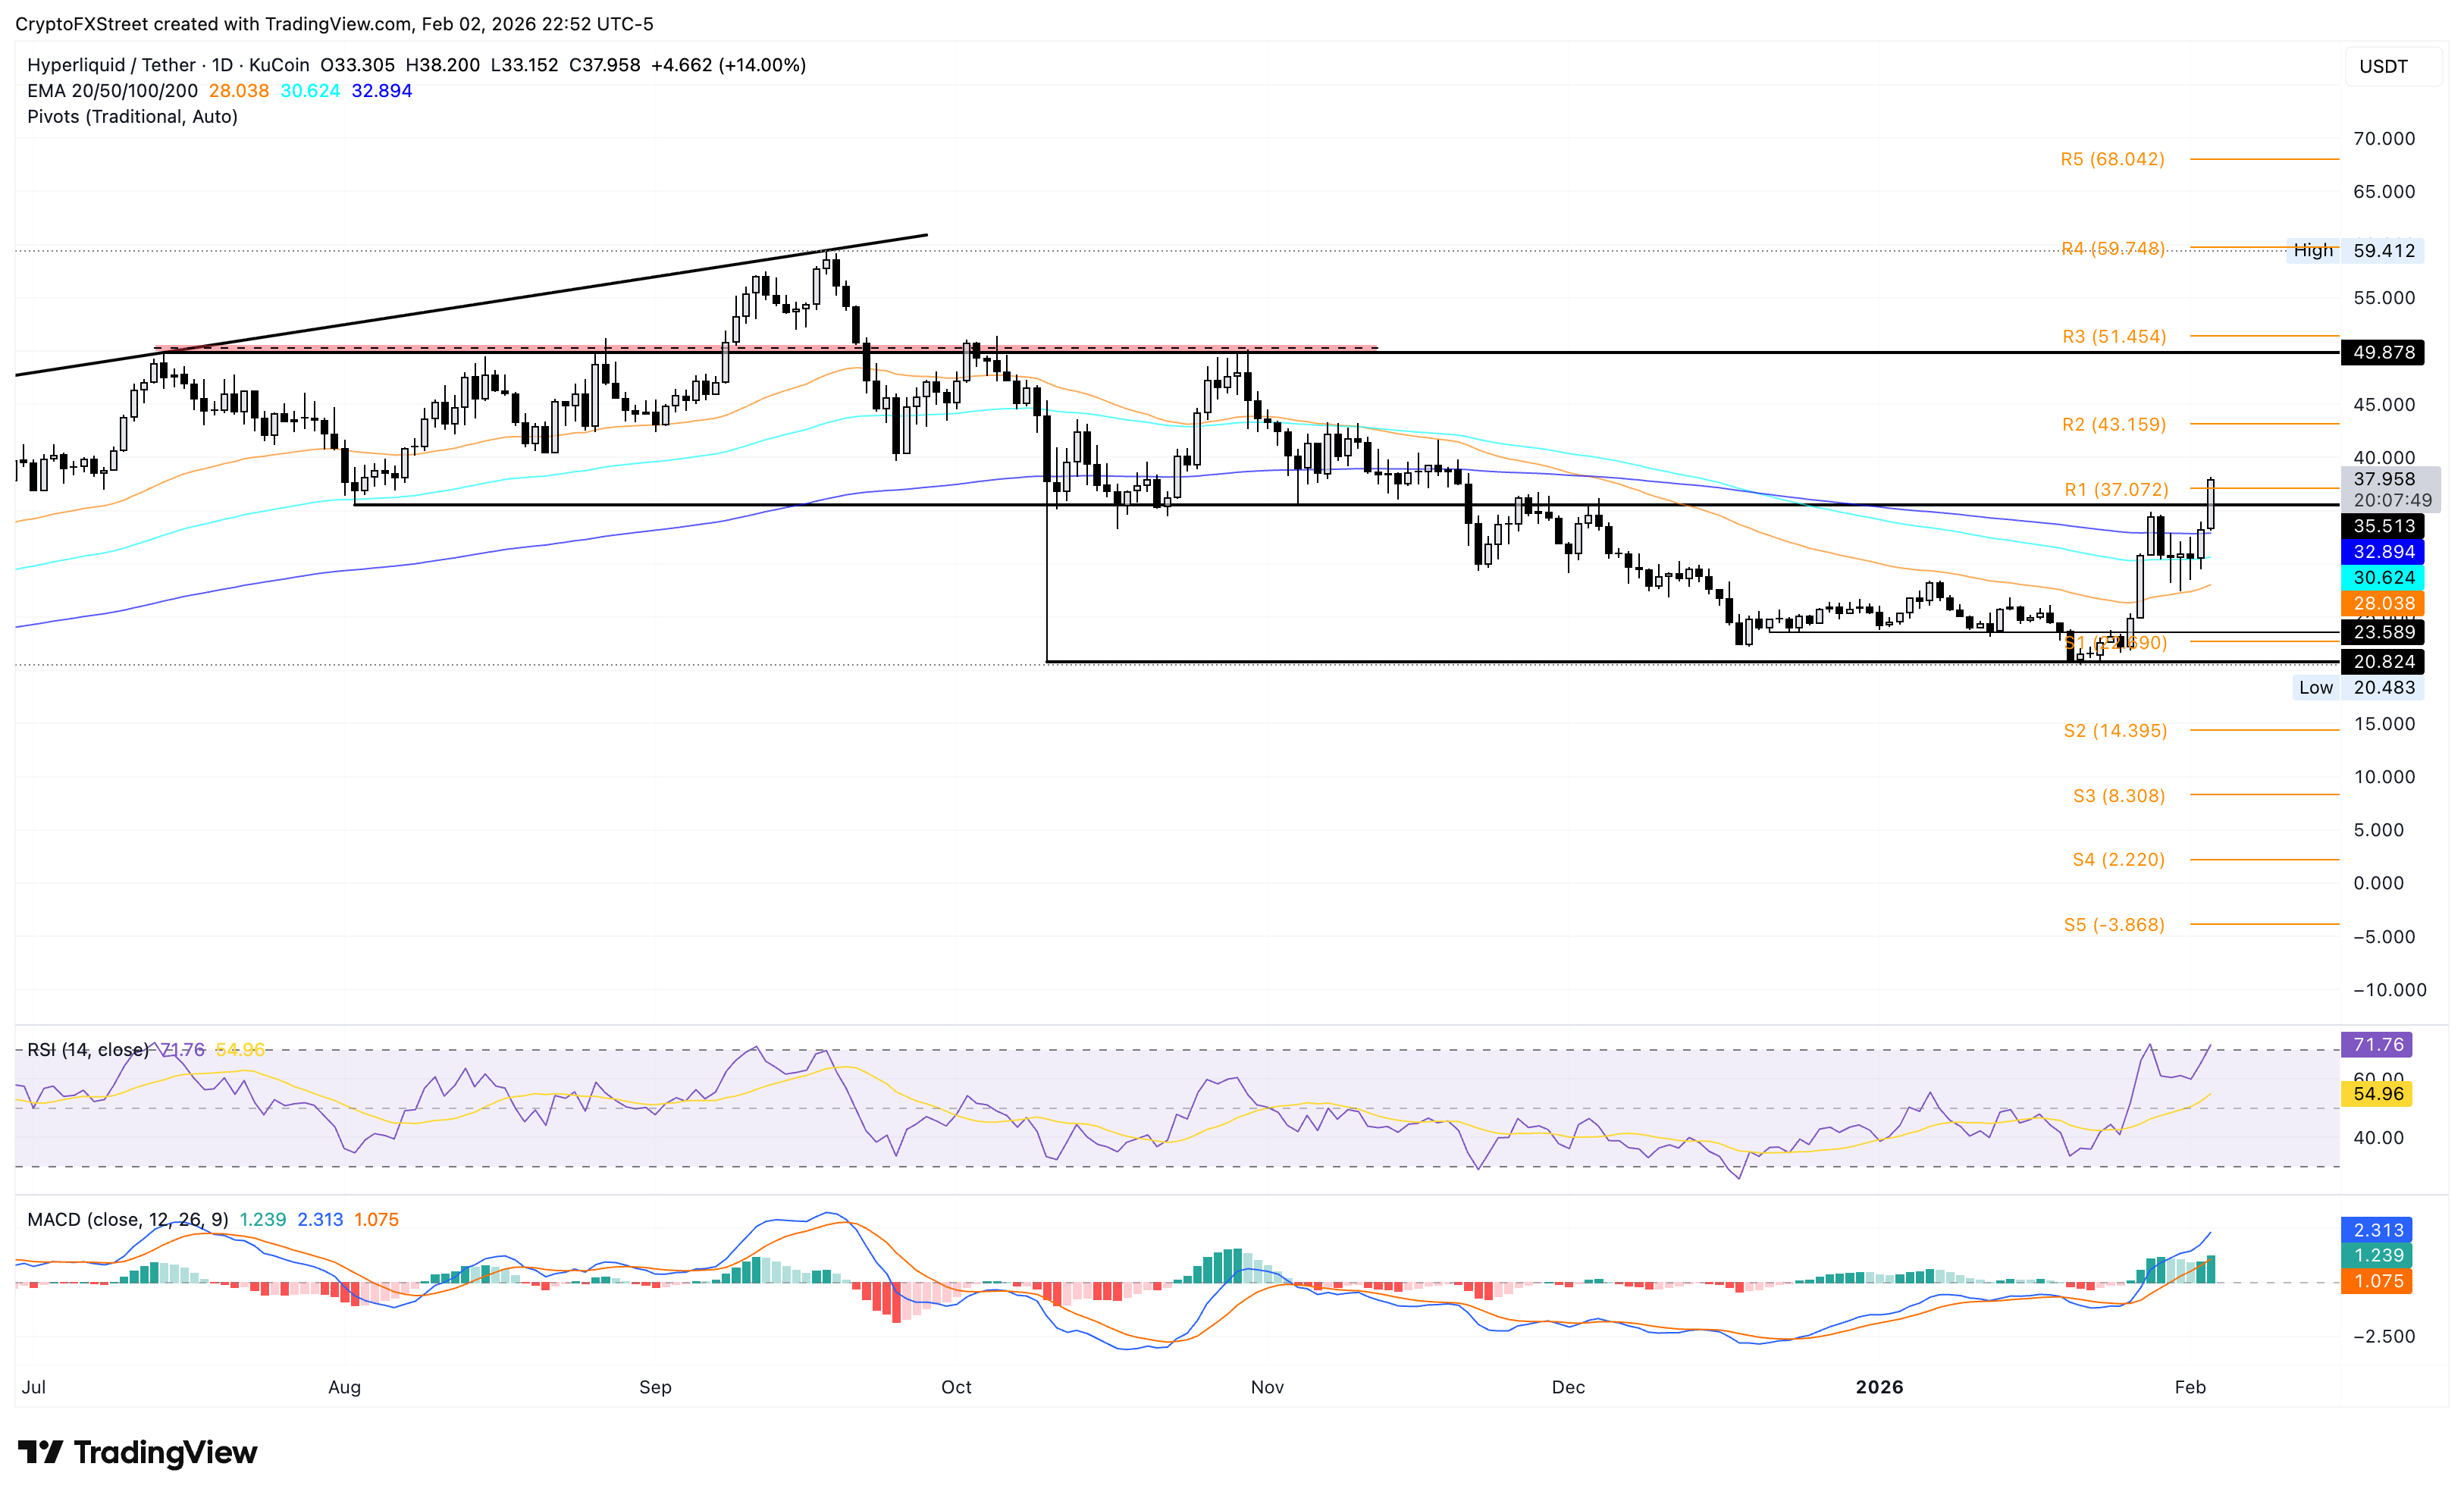
Looking down, if HYPE fails to hold above the 200-day EMA at $32.89, it would nullify further upside chances and potentially lead to a retest of the 100- or 50-day EMAs at $30.62 and $28.03, respectively.
추천 기사


