

Ripple Price Forecast: XRP eyes short-term breakout backed by growing institutional, retail demand
- Ripple rises above the 50-day EMA as the broader cryptocurrency market expands bullish scope.
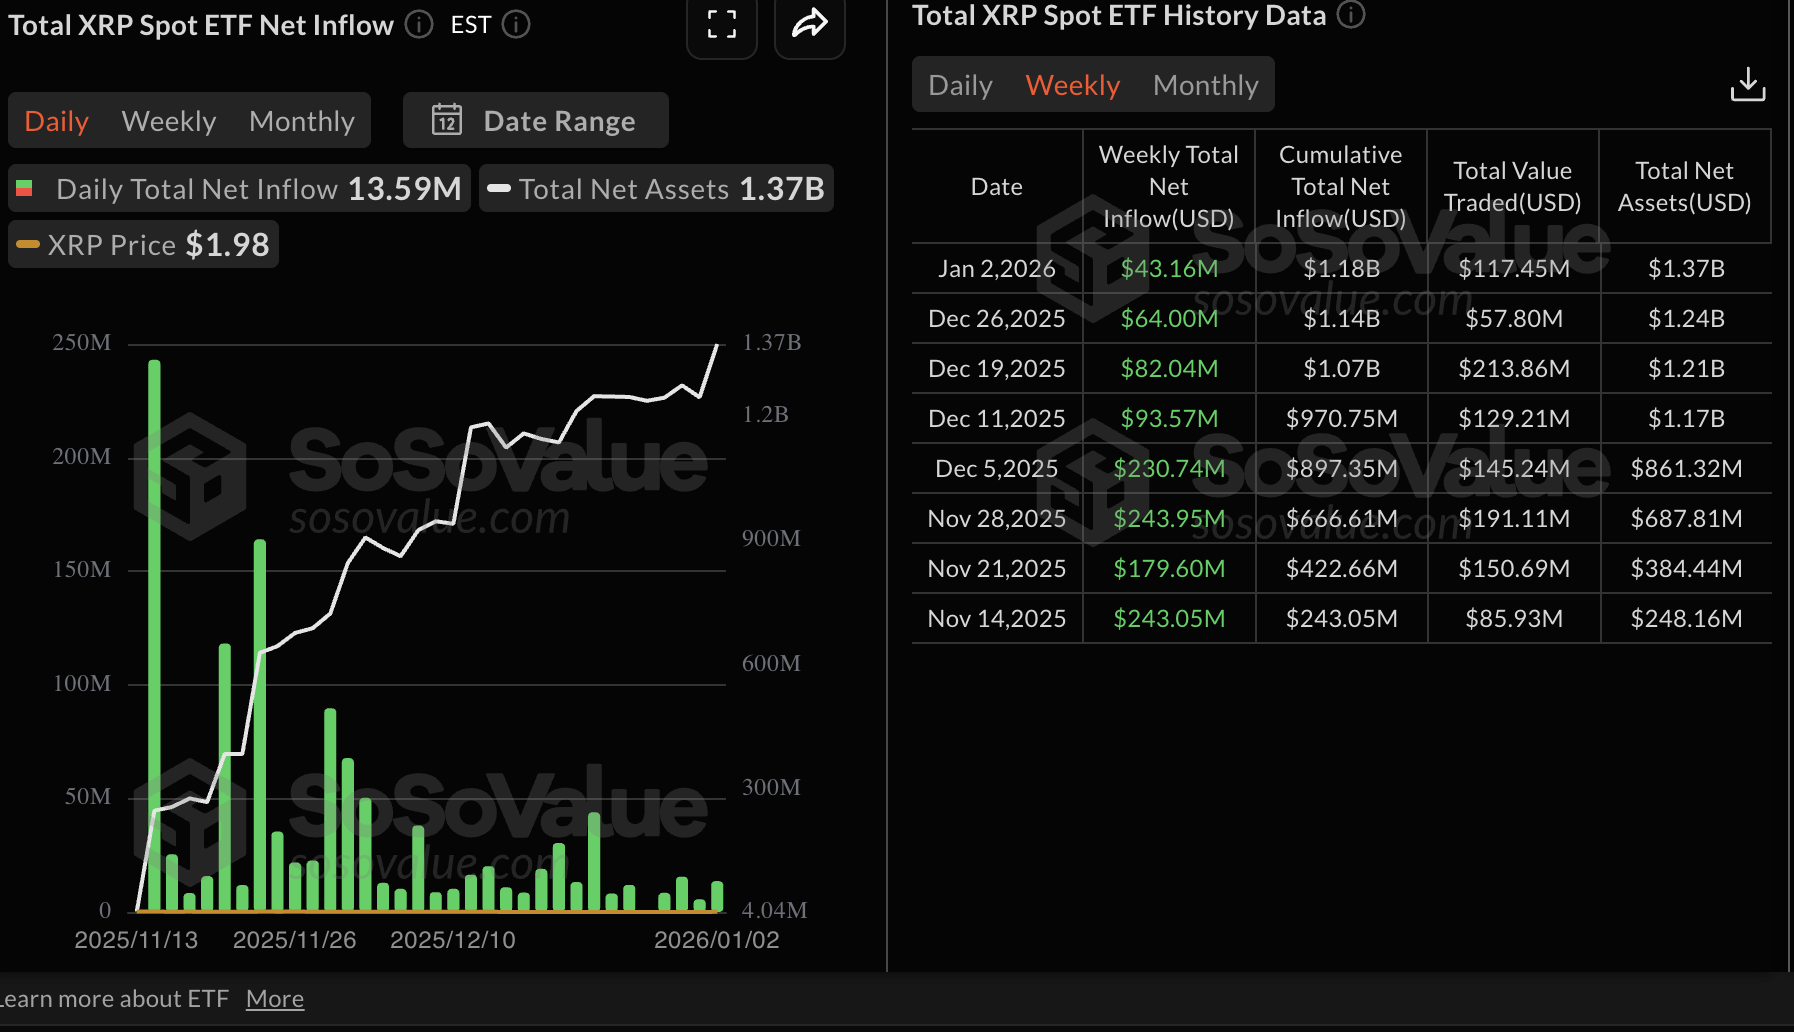
- XRP ETFs’ weekly inflow streak extends, drawing $43 million amid steady institutional demand.
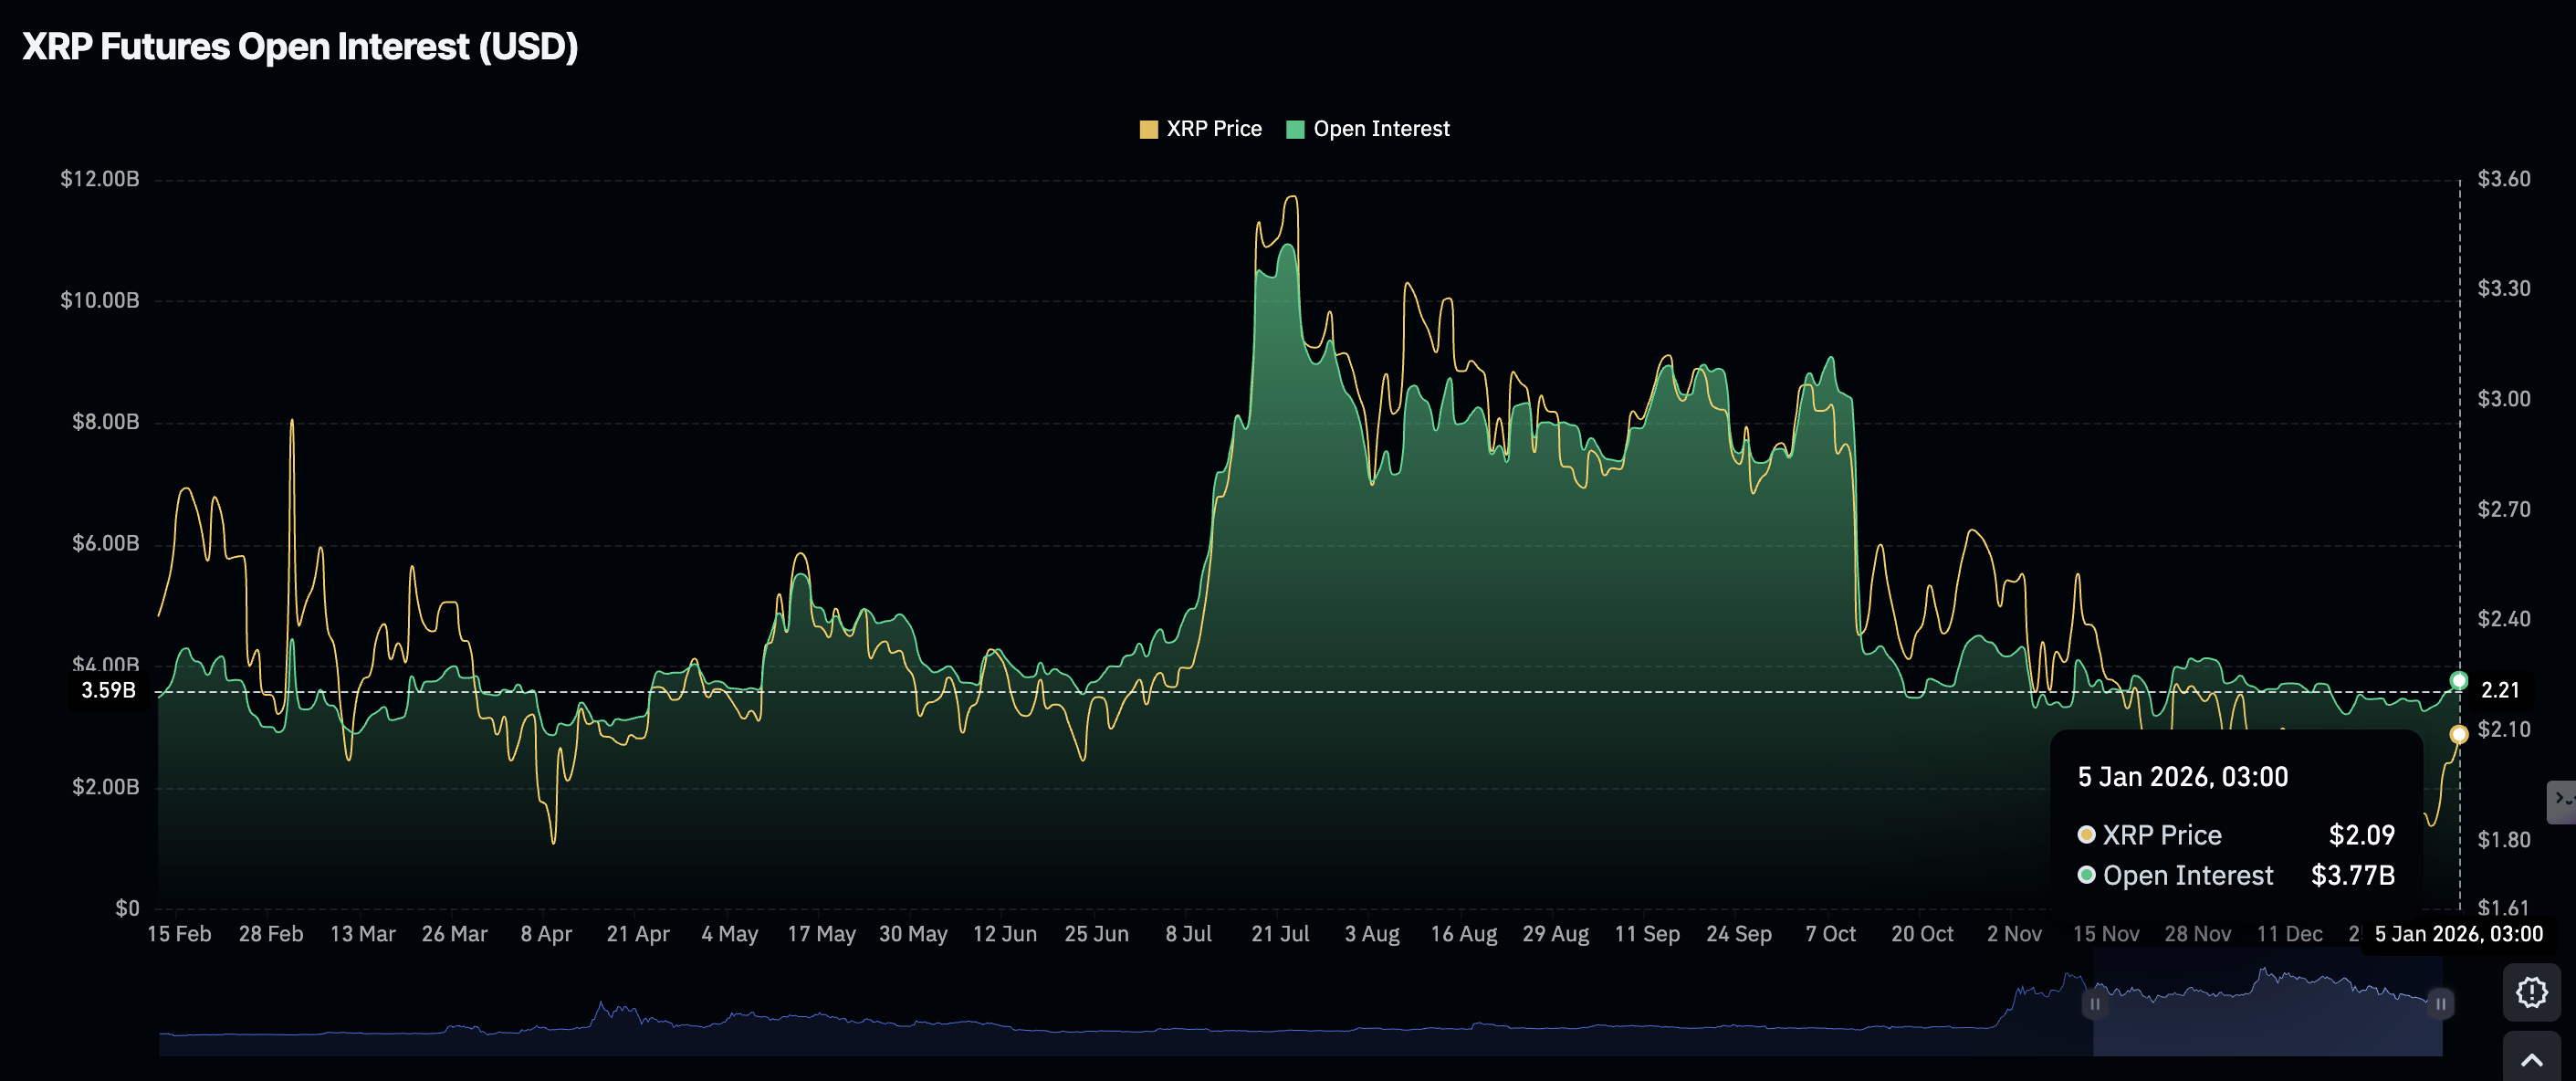
- The XRP derivatives market improves with futures Open Interest rising to $3.8 billion.
Ripple (XRP) edges up above $2.13 at the time of writing on Monday, reflecting steady interest in risk assets across the cryptocurrency market despite geopolitical tensions.
XRP is rising for the fifth consecutive day, supported by steady inflows into spot Exchange Traded Funds (ETFs). Retail interest in the cross-border remittance token shows signs of a gradual comeback, as evidenced by futures Open Interest (OI) rising to $3.8 billion.
Key milestones remain critical to the uptrend’s continuation, including a breakout above a multi-month trendline on the daily chart. On the other hand, a daily close below the pivotal $2.00 level could see XRP resume the downtrend amid rising volatility.
XRP holds steady amid institutional and retail growth
XRP spot ETFs listed in the United States (US) experienced inflows of $43 million last week. Since their debut in November, XRP ETFs have maintained steady weekly inflows, suggesting growing institutional investor interest.
SoSoValue data shows that the five ETF products recorded approximately $13.6 million in inflows on Friday, bringing the cumulative net inflow to $1.18 billion and net assets to $1.37 billion.
Meanwhile, the uptake of XRP derivatives continues to gradually improve, as evidenced by futures OI increasing to approximately $3.8 billion on Monday, up from $3.6 billion the previous day. The OI averaged $3.3 billion on Thursday, signaling that retail demand is making a comeback and may continue to support the uptrend in prices.
Technical outlook: XRP holds support ahead of a potential breakout
XRP is trading at $2.13 at the time of writing on Monday. The 50-day Exponential Moving Average (EMA) provides support at $2.05, which suggests that bulls have a slight edge over bears.
The Moving Average Convergence Divergence (MACD) indicator upholds a positive outlook on the daily chart, with green histogram bars expanding above the mean line. Moreover, the blue MACD line sits above the red signal line, suggesting strengthening bullish momentum.
Similarly, the Relative Strength Index (RSI) at 65 and rising supports XRP's bullish thesis. A further increase of the RSI into overbought territory would boost the odds of a breakout above the moving average cluster, represented by the 100-day EMA at $2.22 and the 200-day EMA at $2.34.
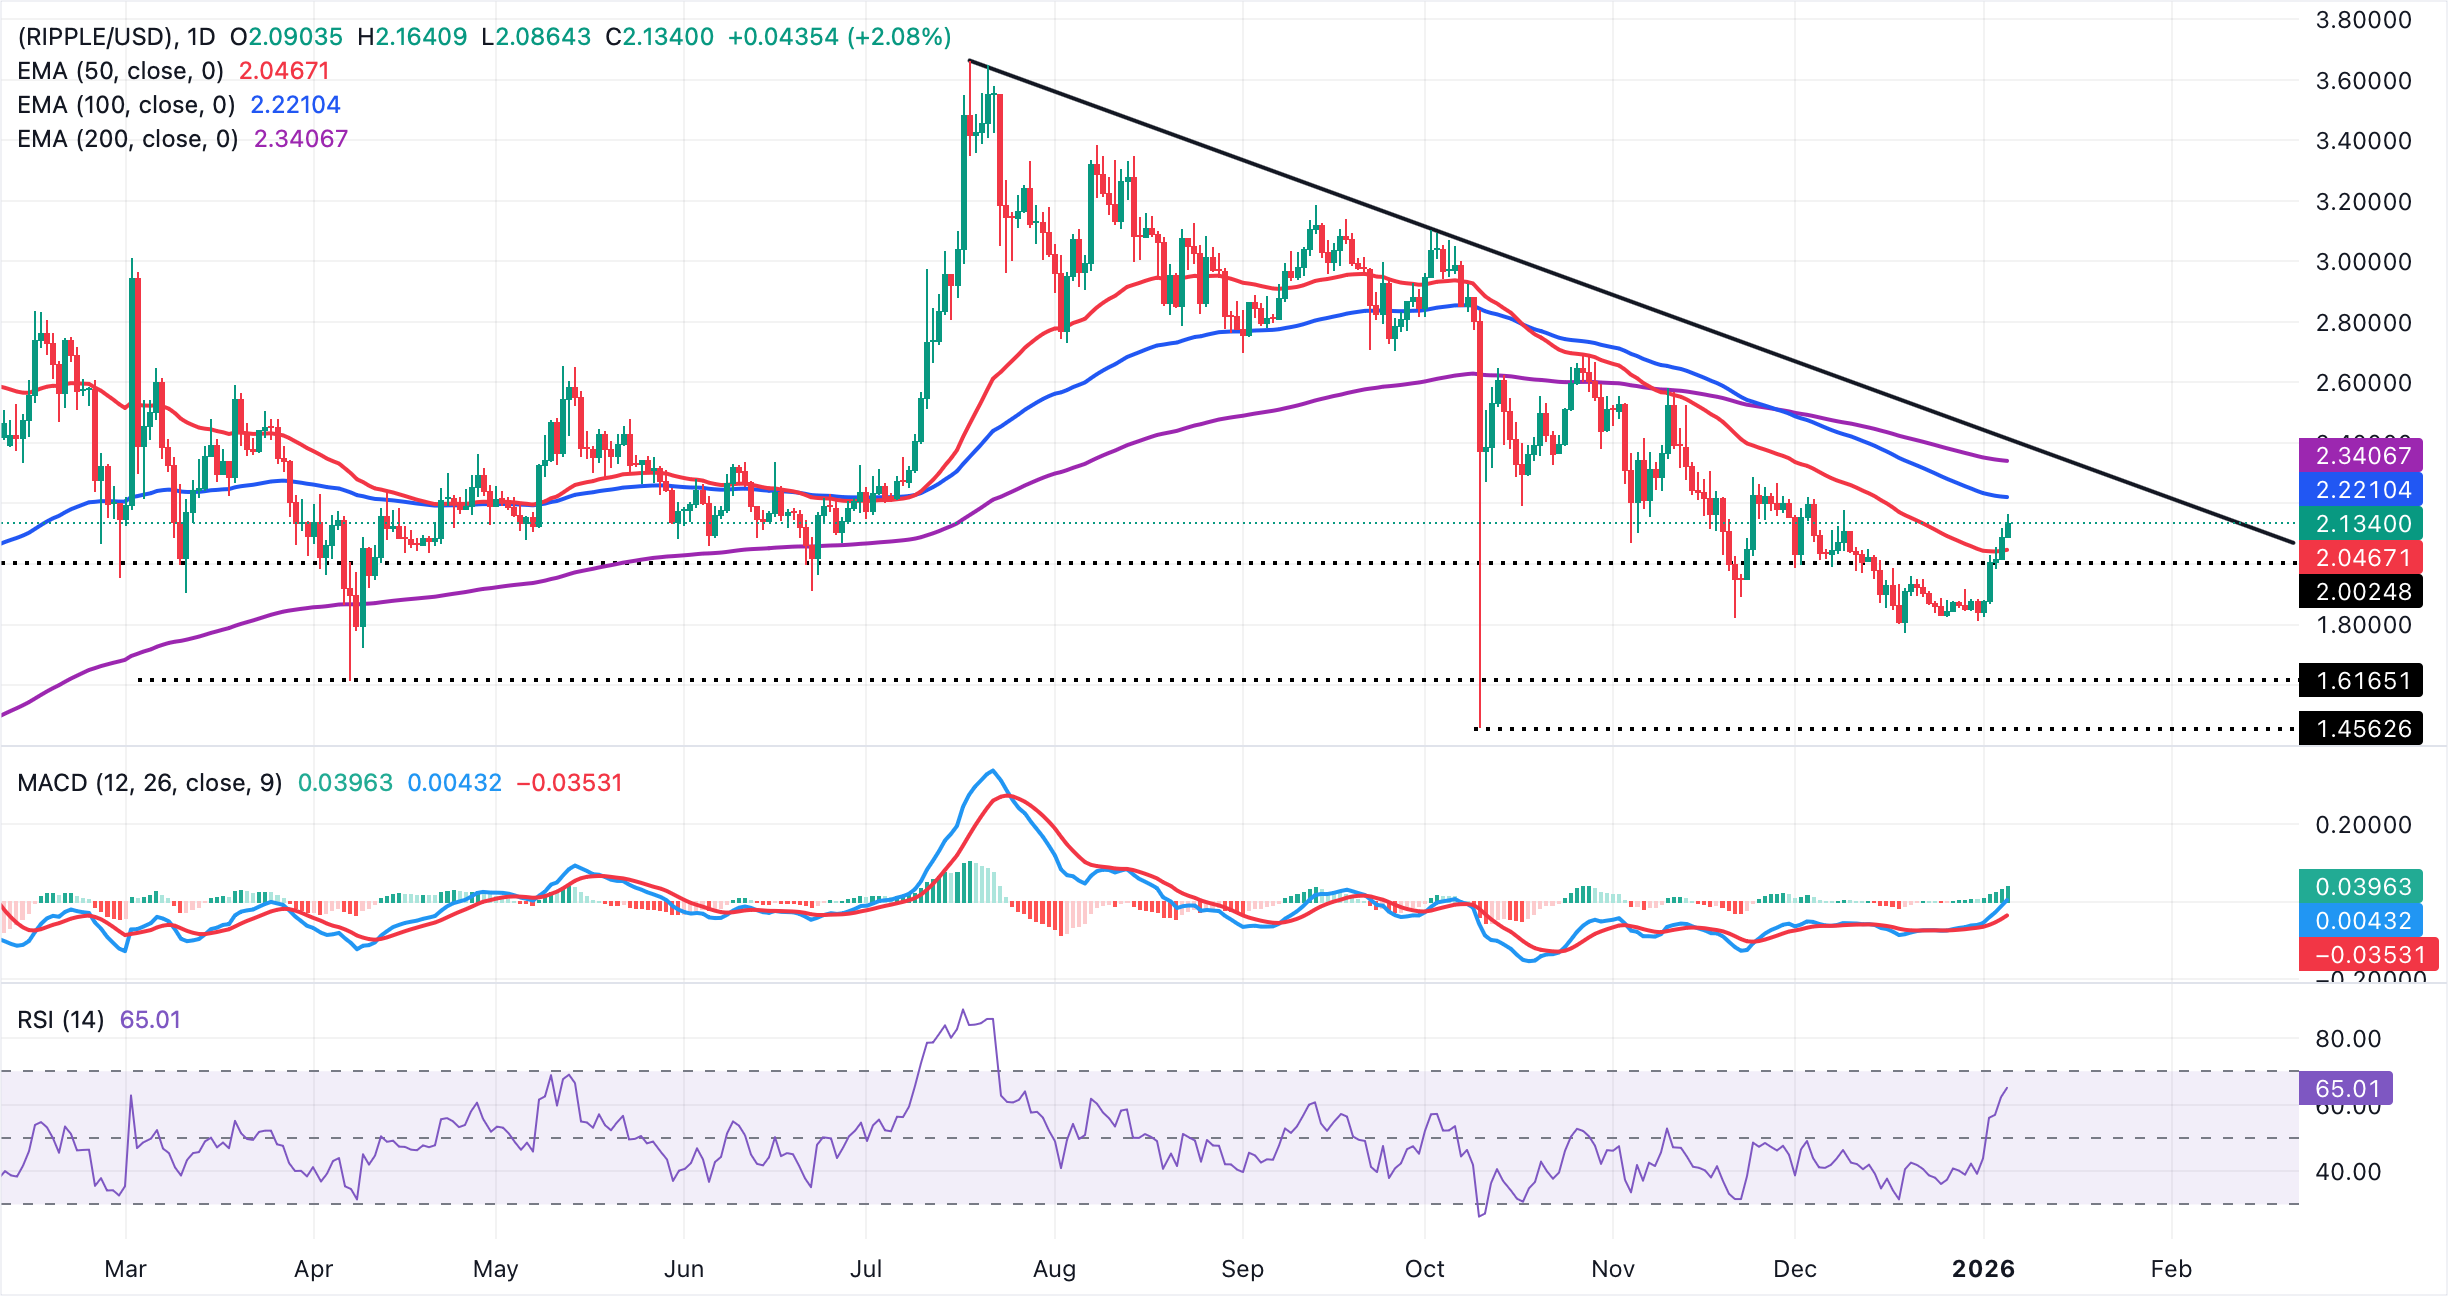
A descending trend line from $3.66 record high limits the advance, with resistance seen near $2.41. A daily close above the 100-day EMA would open the door toward the 200-day EMA barrier, reinforcing a recovery phase, while the 50-day EMA underpins pullbacks to keep the bounce intact.
Failure to clear the trend line and the 100-day EMA cap would leave the broader bias heavy and risk a return to consolidation or an extended decline below the $2.00 level.
Cryptocurrency metrics FAQs
The developer or creator of each cryptocurrency decides on the total number of tokens that can be minted or issued. Only a certain number of these assets can be minted by mining, staking or other mechanisms. This is defined by the algorithm of the underlying blockchain technology. On the other hand, circulating supply can also be decreased via actions such as burning tokens, or mistakenly sending assets to addresses of other incompatible blockchains.
Market capitalization is the result of multiplying the circulating supply of a certain asset by the asset’s current market value.
Trading volume refers to the total number of tokens for a specific asset that has been transacted or exchanged between buyers and sellers within set trading hours, for example, 24 hours. It is used to gauge market sentiment, this metric combines all volumes on centralized exchanges and decentralized exchanges. Increasing trading volume often denotes the demand for a certain asset as more people are buying and selling the cryptocurrency.
Funding rates are a concept designed to encourage traders to take positions and ensure perpetual contract prices match spot markets. It defines a mechanism by exchanges to ensure that future prices and index prices periodic payments regularly converge. When the funding rate is positive, the price of the perpetual contract is higher than the mark price. This means traders who are bullish and have opened long positions pay traders who are in short positions. On the other hand, a negative funding rate means perpetual prices are below the mark price, and hence traders with short positions pay traders who have opened long positions.
(The technical analysis of this story was written with the help of an AI tool)
추천 기사


