


Bitcoin Price Forecast: BTC slips below $87,000 as ETF outflows intensify, whale participation declines
- Bitcoin price continues to trade around $86,770 on Wednesday, after failing to break above the $90,000 resistance.
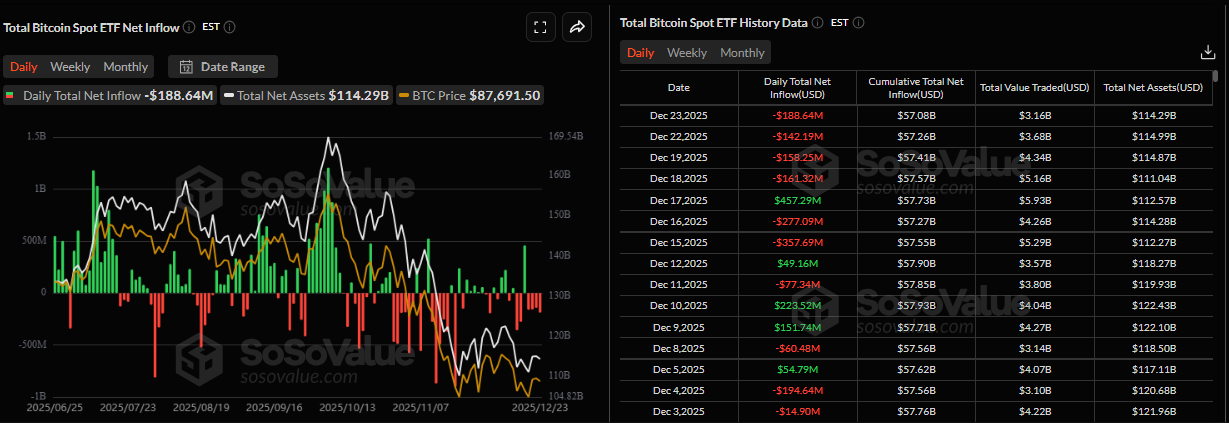
- US-listed spot ETFs record an outflow of $188.64 million on Tuesday, marking the fourth consecutive day of withdrawals.
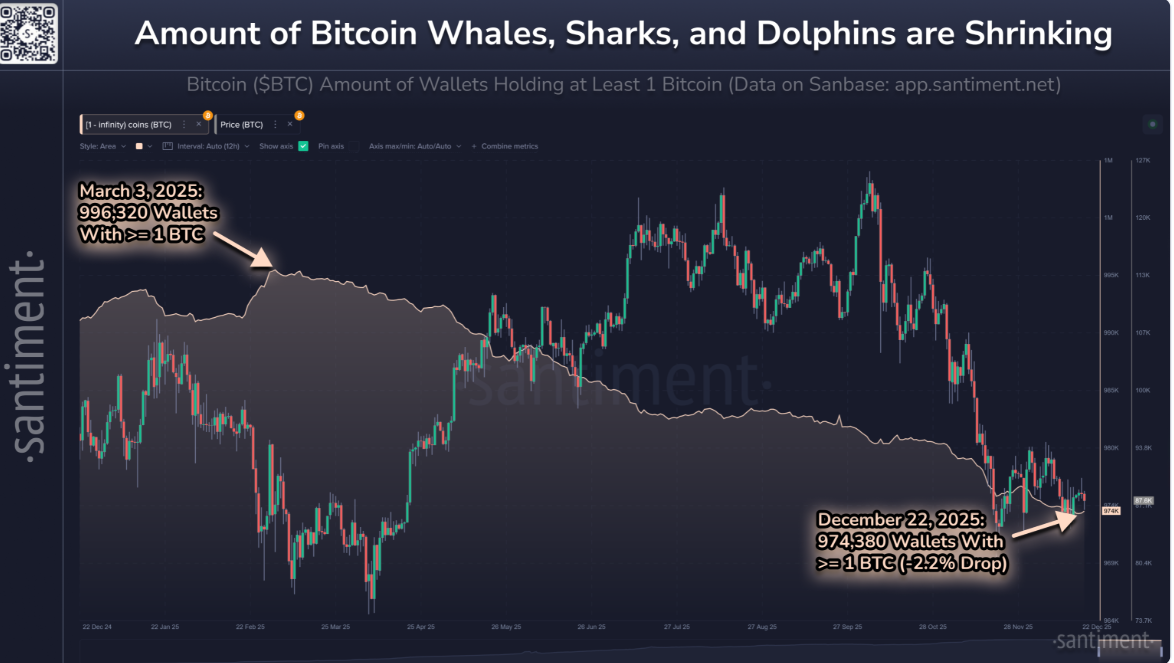
- Santiment data show a decline in the number of Bitcoin whales, sharks and dolphins, indicating a large-holder participation reduction.
Bitcoin (BTC) price continues to trade in red below $87,000 on Wednesday, failing to reclaim a key psychological level earlier this week. Weakening institutional demand, as reflected in continued outflows from Bitcoin spot Exchange-Traded Funds (ETFs), alongside a decline in whale, shark, and dolphin participation, is weighing on market sentiment and keeping BTC’s short-term outlook cautious.
Weakening institutional demand weighs on the Bitcoin price
Institutional demand has continued to weaken this week. SoSoValue data show that Spot Bitcoin ETFs recorded an outflow of $188.64 million on Tuesday, marking the fourth consecutive day of withdrawals since December 18. If these outflows continue and intensify, the Bitcoin price could see further correction.
Shrinking whale, sharks and dolphins
The Santiment chart below shows that the number of wallets holding at least 1 Bitcoin decreased by 2.2% from 999,320 on March 3 to 974,380 on Monday, suggesting reduced large-holder participation and softer market confidence. If this trend continues and intensifies, BTC could see further correction.
Bitcoin Price Forecast: BTC faces rejection from the $90,000 mark
Bitcoin price was retested at the psychological level of $90,000 on Monday and declined slightly the following day. As of Wednesday, BTC hovers around $87,700.
If BTC continues its correction, it could extend the decline toward the key support at $85,569.
The Relative Strength Index (RSI) is 41, below its neutral level of 50, indicating that bearish momentum is gaining traction. The Moving Average Convergence Divergence indicator showed a bullish crossover last week; however, the falling green histogram bars indicate fading bullish momentum.
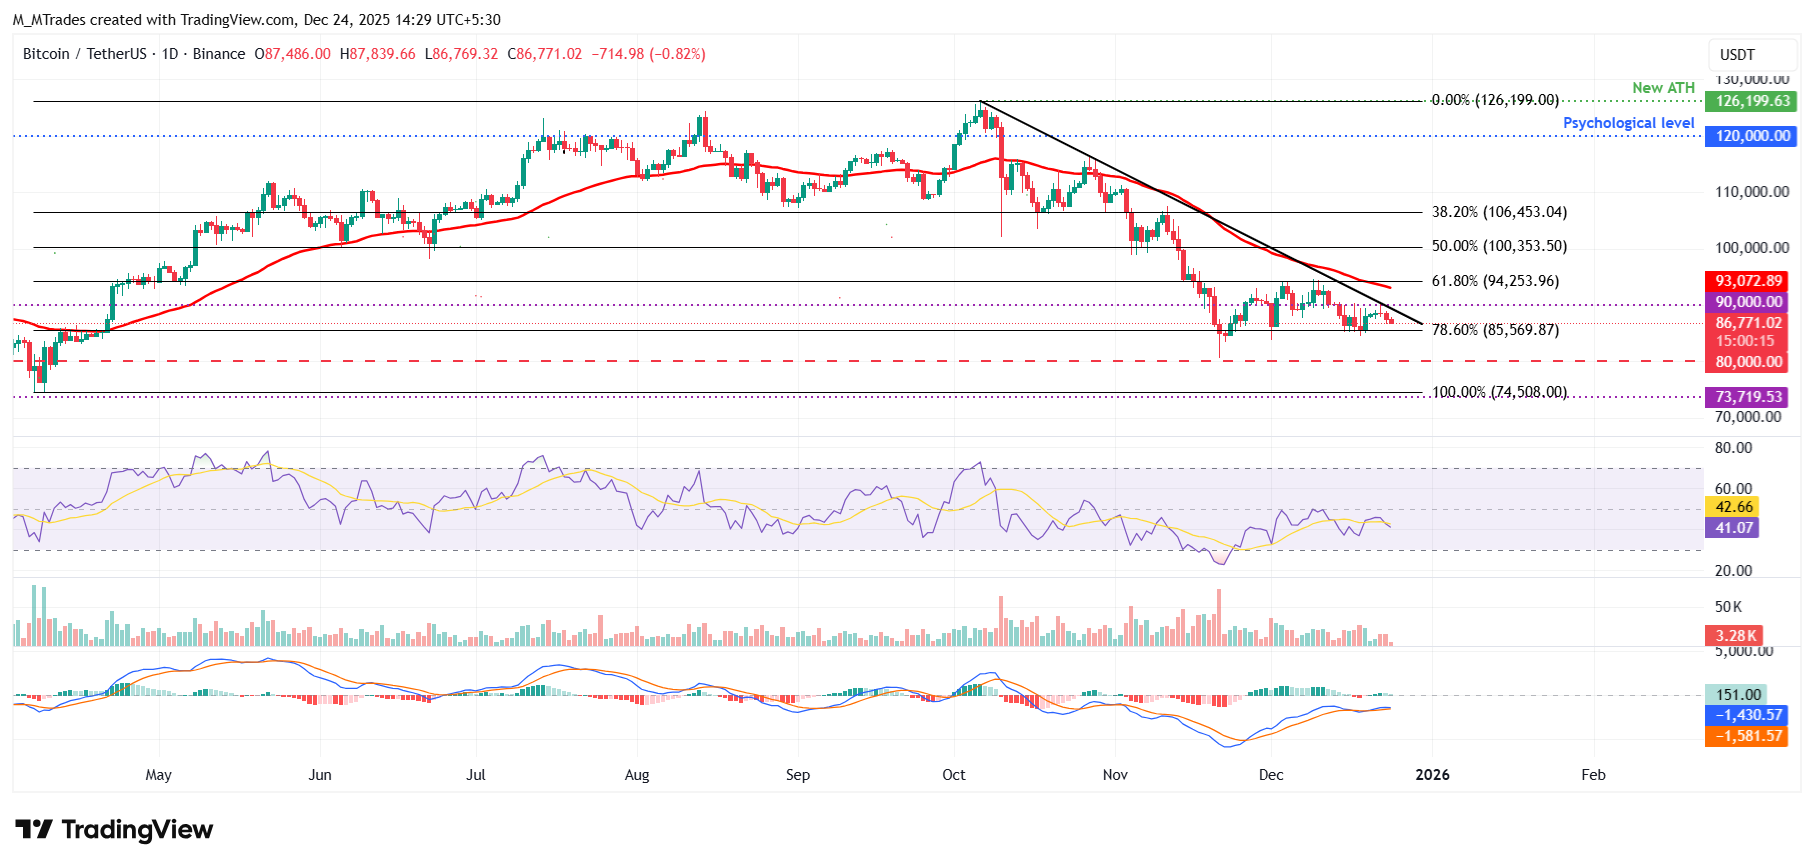
On the other hand, if BTC closes above the $90,000, it could extend the recovery toward the next resistance at $94,253.
Bitcoin, altcoins, stablecoins FAQs
Bitcoin is the largest cryptocurrency by market capitalization, a virtual currency designed to serve as money. This form of payment cannot be controlled by any one person, group, or entity, which eliminates the need for third-party participation during financial transactions.
Altcoins are any cryptocurrency apart from Bitcoin, but some also regard Ethereum as a non-altcoin because it is from these two cryptocurrencies that forking happens. If this is true, then Litecoin is the first altcoin, forked from the Bitcoin protocol and, therefore, an “improved” version of it.
Stablecoins are cryptocurrencies designed to have a stable price, with their value backed by a reserve of the asset it represents. To achieve this, the value of any one stablecoin is pegged to a commodity or financial instrument, such as the US Dollar (USD), with its supply regulated by an algorithm or demand. The main goal of stablecoins is to provide an on/off-ramp for investors willing to trade and invest in cryptocurrencies. Stablecoins also allow investors to store value since cryptocurrencies, in general, are subject to volatility.
Bitcoin dominance is the ratio of Bitcoin's market capitalization to the total market capitalization of all cryptocurrencies combined. It provides a clear picture of Bitcoin’s interest among investors. A high BTC dominance typically happens before and during a bull run, in which investors resort to investing in relatively stable and high market capitalization cryptocurrency like Bitcoin. A drop in BTC dominance usually means that investors are moving their capital and/or profits to altcoins in a quest for higher returns, which usually triggers an explosion of altcoin rallies.
추천 기사


