

Crypto Today: Bitcoin, Ethereum, XRP poised for recovery as BTC ETF inflows return
- Bitcoin shows signs of recovery, targeting highs above $105,000, supported by ETF inflows.
- Ethereum struggles to break higher amid low institutional interest and ETF outflows.
- XRP pares losses weighed down by a relatively weak derivatives market, with the Open Interest averaging $3.95 billion.
Bitcoin (BTC) rises in tandem with other crypto majors and is trading above $104,000 at the time of writing on Wednesday. BTC's recovery follows a short-lived sell-off below $102,500 the day prior, driven by risk-off sentiment amidst macroeconomic uncertainty and potential profit-taking.
Altcoins, including Ethereum (ETH) and Ripple (XRP), are also edging higher, hovering above $3,400 and $2.40, respectively.
Data spotlight: Bitcoin price increases, supported by ETF inflows
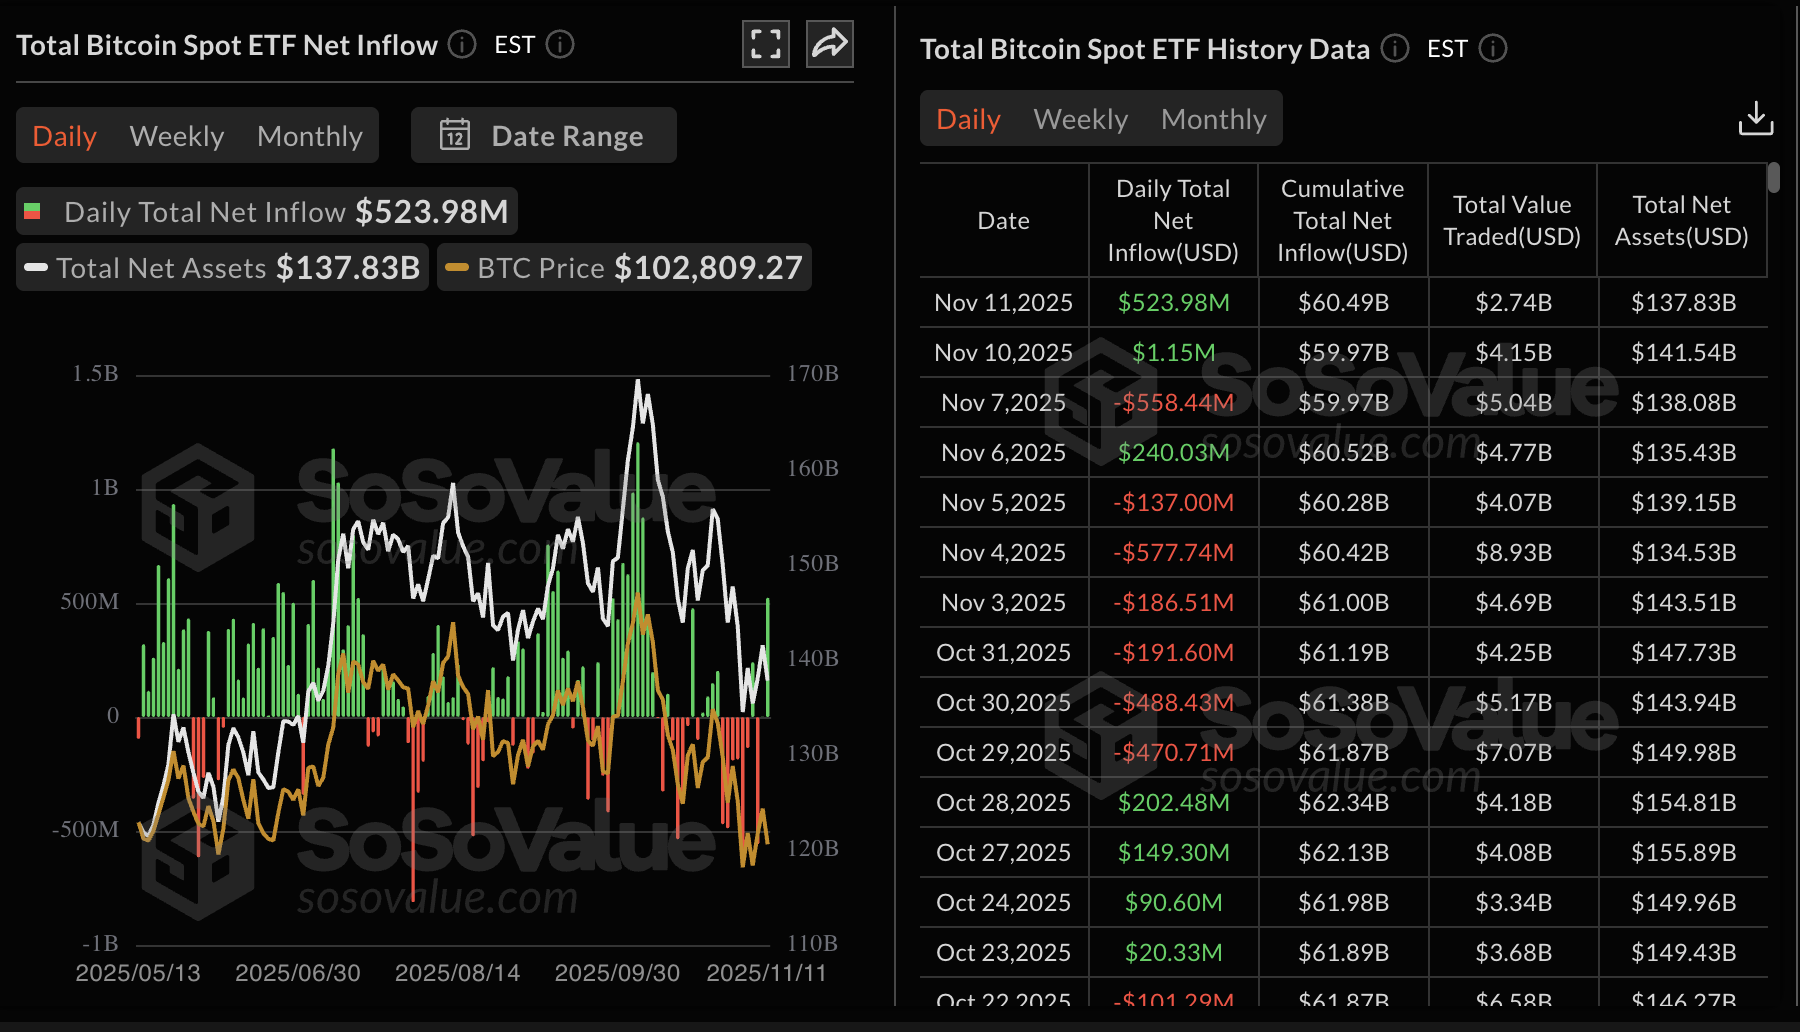
Institutional demand is making a slow comeback in the crypto market, as inflows into Bitcoin Exchange Traded Funds (ETFs) surge. According to SoSoValue, US-listed ETFs recorded inflows of slightly over $523 million on Tuesday, building on the momentum of $1.15 million on Monday.
ETFs have become a key indicator of Bitcoin interest, with risk-on sentiment characterised by inflows. Interest in the ETFs suffered a significant hit following the October 10 flash crash, which saw over $19 billion in crypto assets liquidated in a single day.
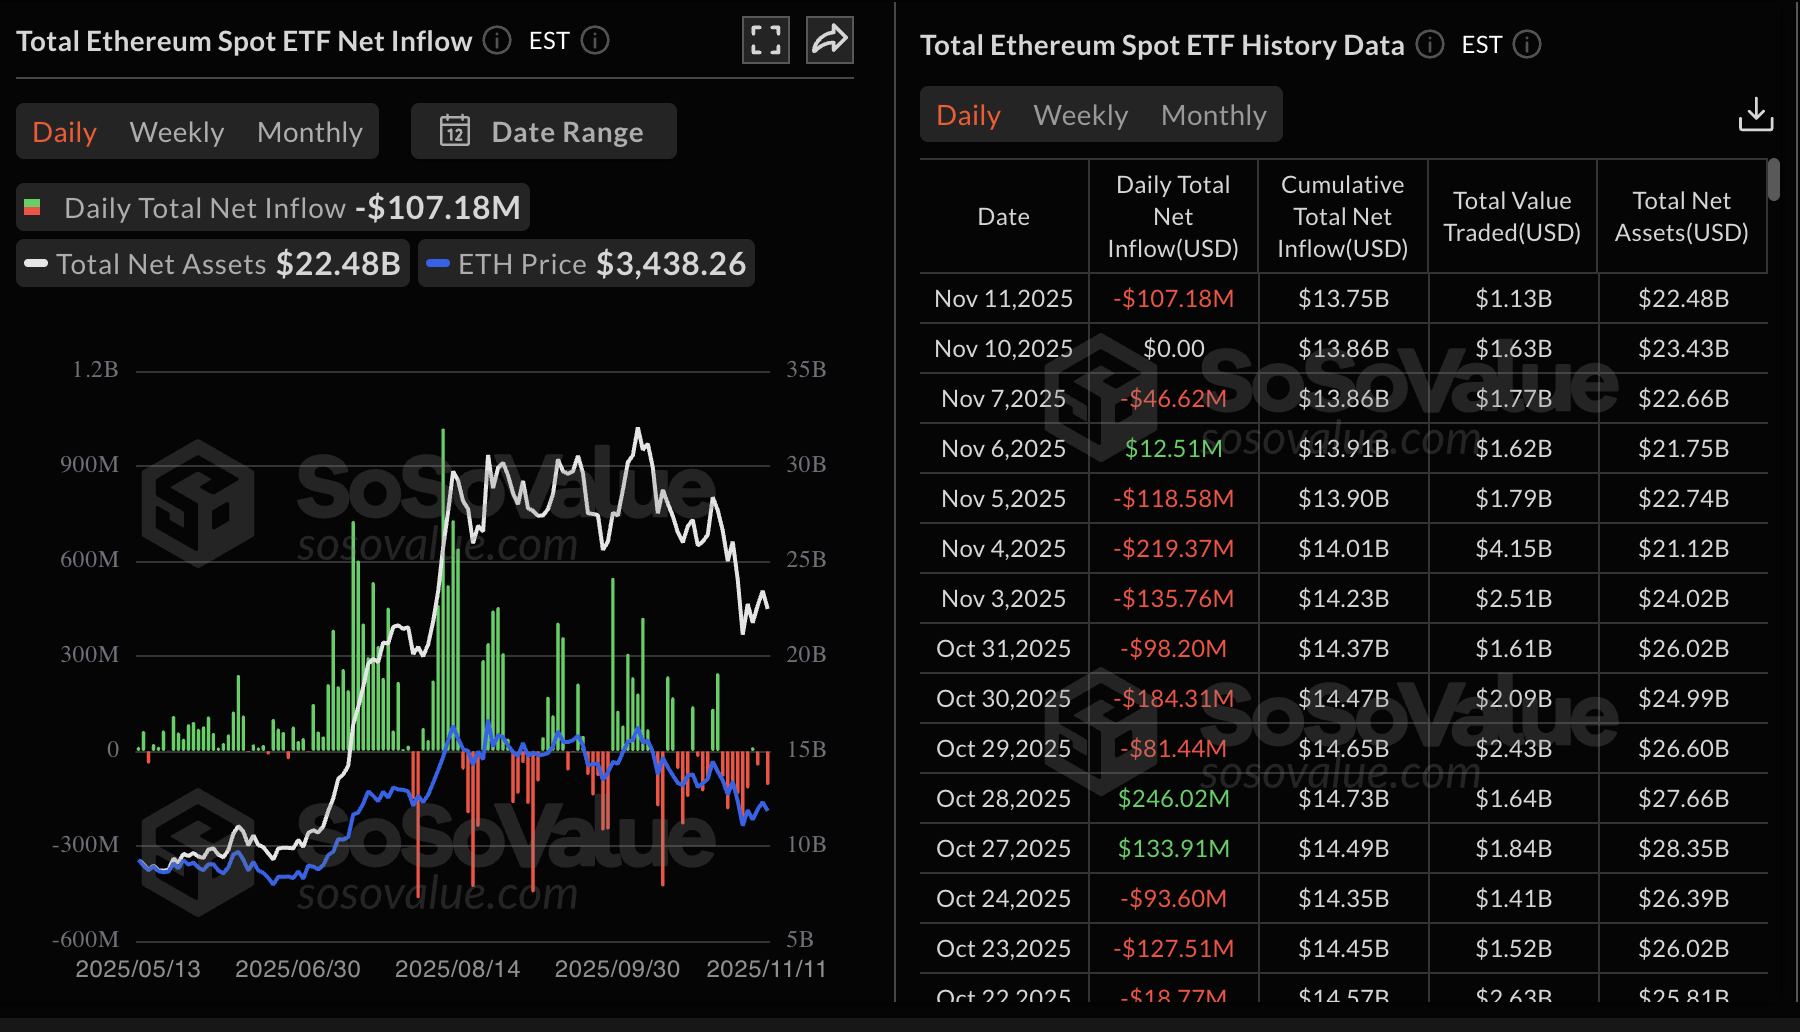
Ethereum, unlike Bitcoin, still faces risk-off sentiment amid persistent ETF outflows. Combined, the nine US-listed ETH ETFs recorded outflows of approximately $107 million on Tuesday, bringing total net inflows to $13.75 billion and net assets to around $22.48 billion.
SoSoValue recorded zero flows on Monday, which may have set the precedent for continued outflows. The next few days will be critical for shaping sentiment around Ethereum as an ETF asset and its price in the open market.
Meanwhile, retail demand for XRP has not picked up following the October 10 deleveraging event. CoinGlass data on the XRP derivatives market shows the futures Open Interest (OI) averaging $3.95 billion on Wednesday, down from $4.11 billion the previous day and $8.36 billion on October 10.
A steady increase in OI is required to support XRP's short-term recovery, indicating that investors have confidence in the token and the ecosystem and are willing to increase their risk exposure.
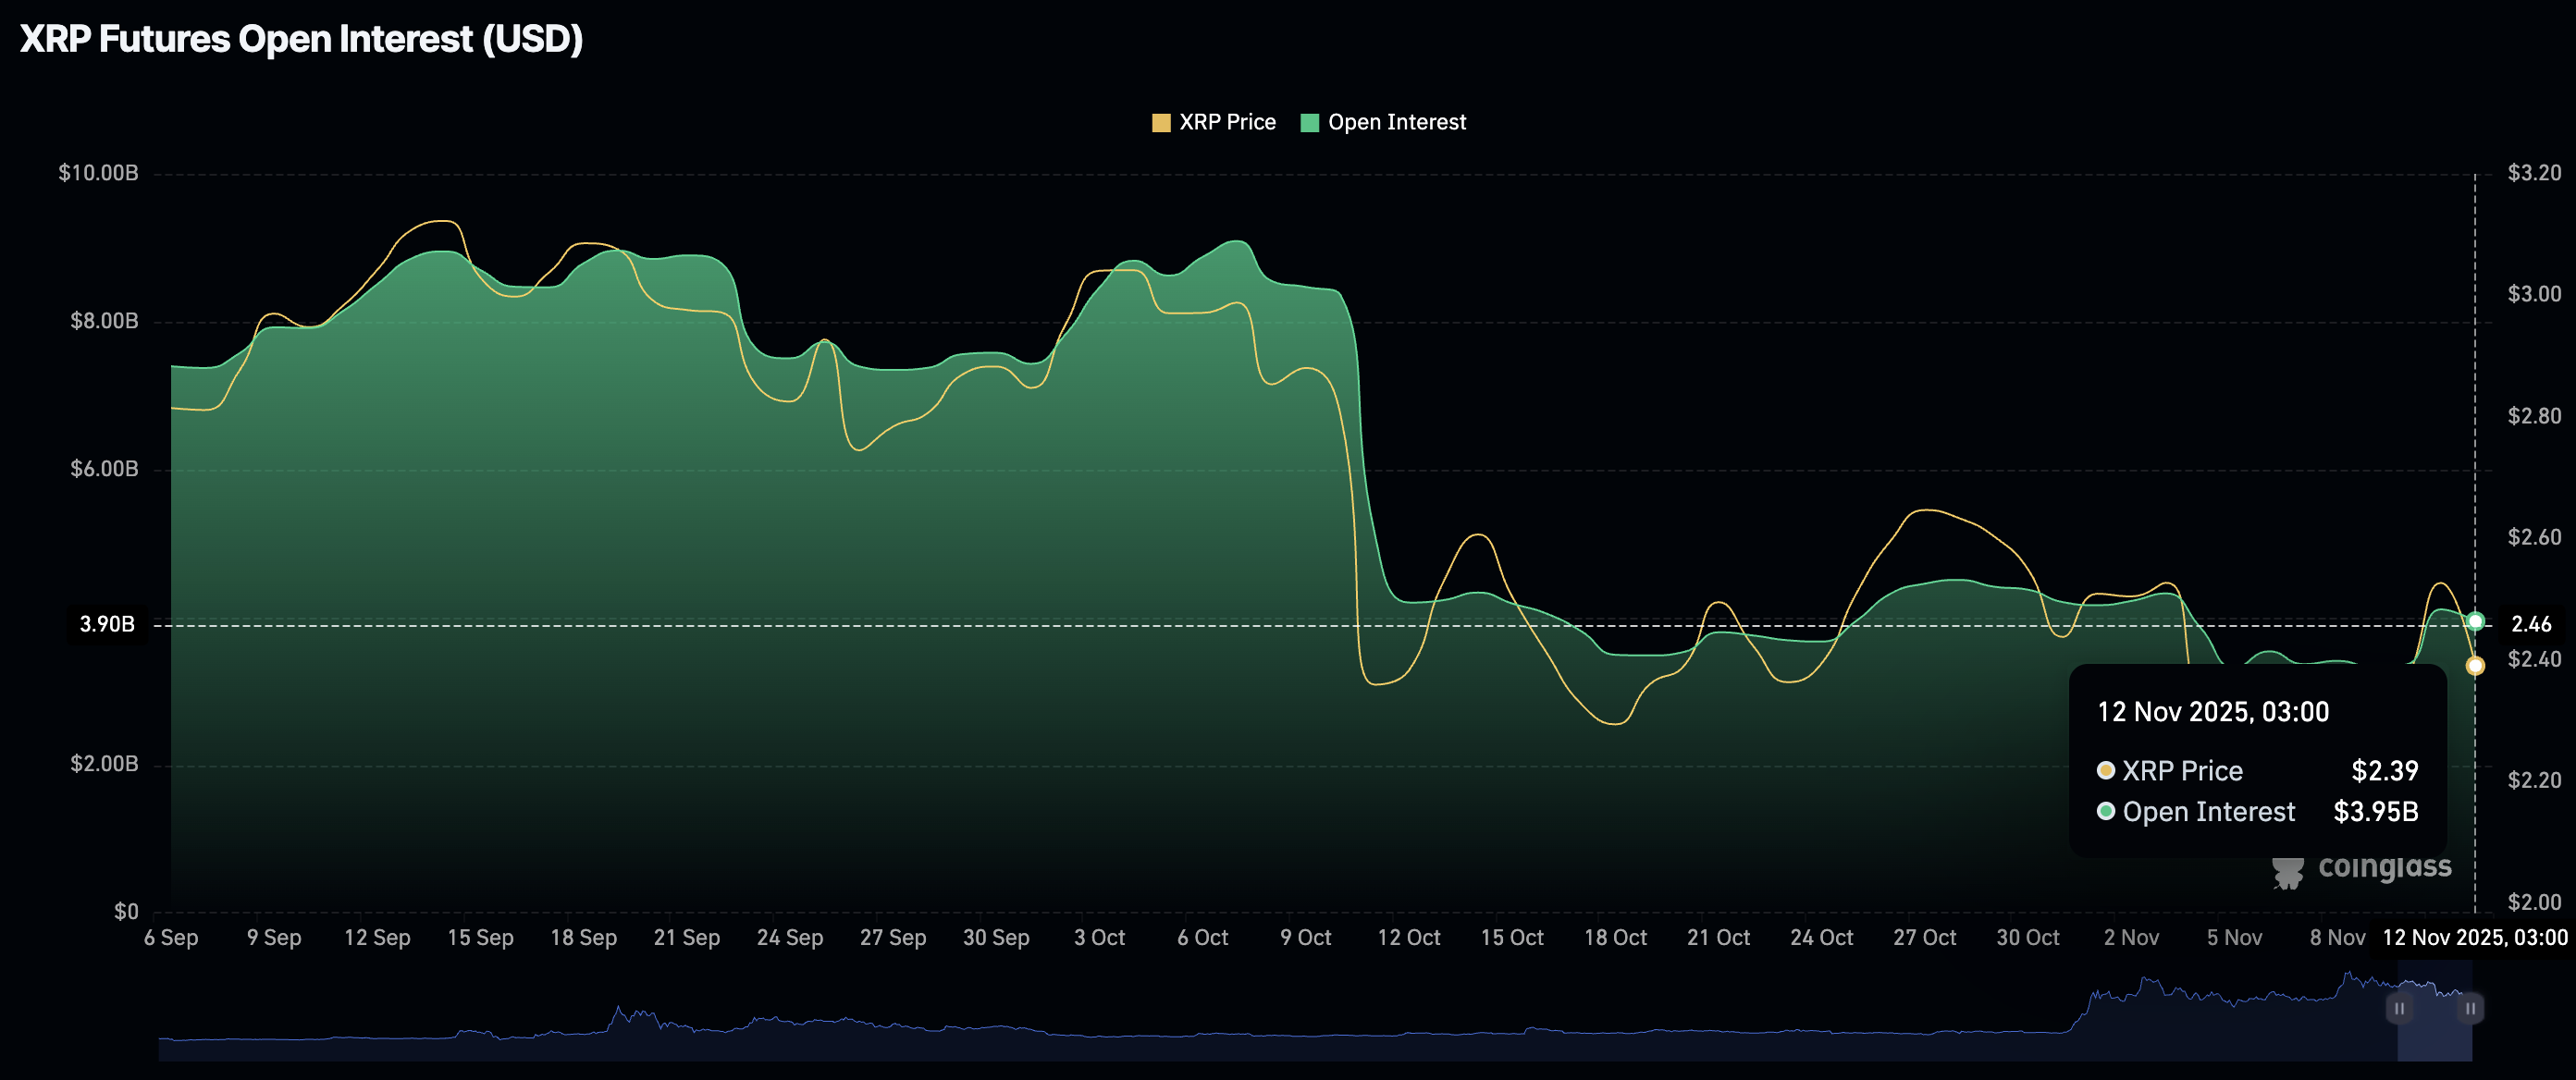
Chart of the day: Bitcoin regains momentum
Bitcoin is trading above $104,000 at the time of writing after rising from Tuesday's lowest point of $102,476. BTC bulls and bears are battling to take control, as reflected by key technical indicators on the daily chart.
The Moving Average Convergence Divergence (MACD) momentum indicator on the daily chart is poised to trigger a buy signal if the blue line crosses above the red line. Traders will watch for green histogram bars above the mean line to ascertain that bullish momentum is increasing.
A break above the 200-day Exponential Moving Average (EMA) at $107,940 would validate BTC's short-term bullish outlook toward the round-number resistance at $110,000.
Still, traders must be cautiously optimistic, particularly given that the Relative Strength Index (RSI) has risen to 43 while remaining in the bearish region. Higher RSI readings will support bullish momentum and increase the odds of a steady short-term uptrend.

Altcoins update: Ethereum, XRP flash buy signals
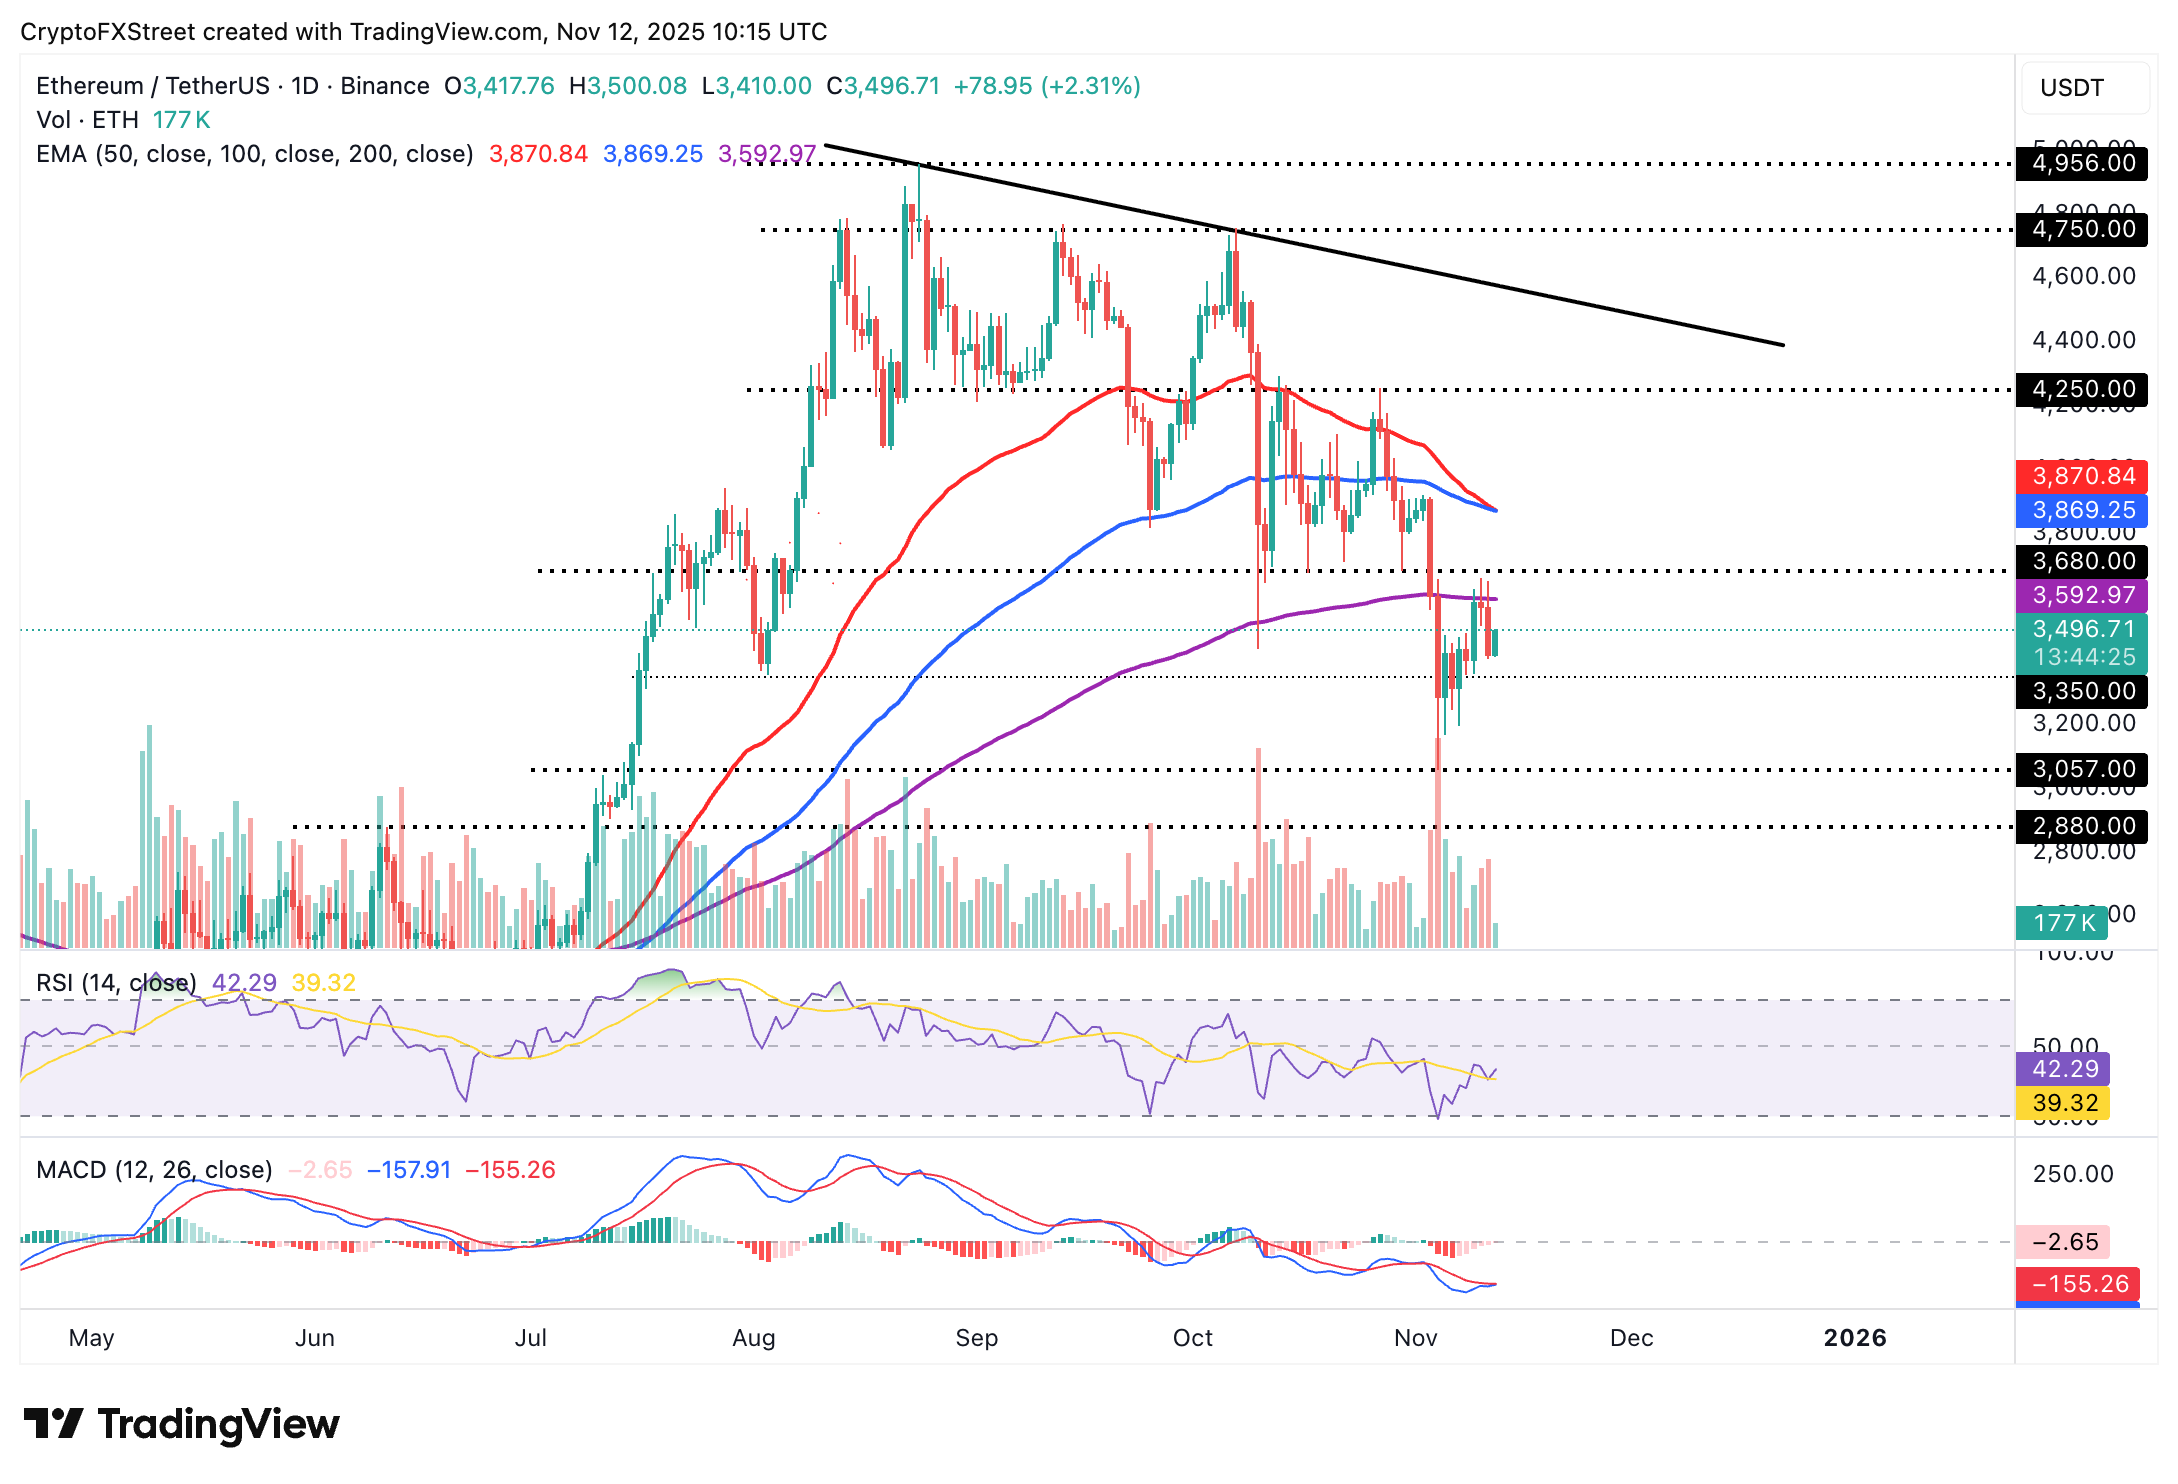
Ethereum is trading below $3,500 after reclaiming its short-term support at $3,400 on Wednesday. The path of least resistance is upward, backed by the RSI recovering to 42 on the daily chart.
If the uptrend continues above the midline, bulls will tighten their grip, as momentum propels the smart contracts token toward the next resistance, formed by the confluence of the 50-day and 100-day EMAs at $3,870.
The MACD indicator is poised to trigger a buy signal, likely encouraging investors to increase risk exposure as they anticipate a steady uptrend. Still, if early profit-taking overwhelms demand, a correction toward the next key support at $3,350, last tested on Saturday, may follow.
As for XRP, bulls have the upper hand, inspired by a buy signal maintained by the MACD indicator since Monday on the daily chart. As investors lean bullishly and capitalize on emerging opportunities, a short-term breakout above the 50-day EMA at $2.55 is anticipated.
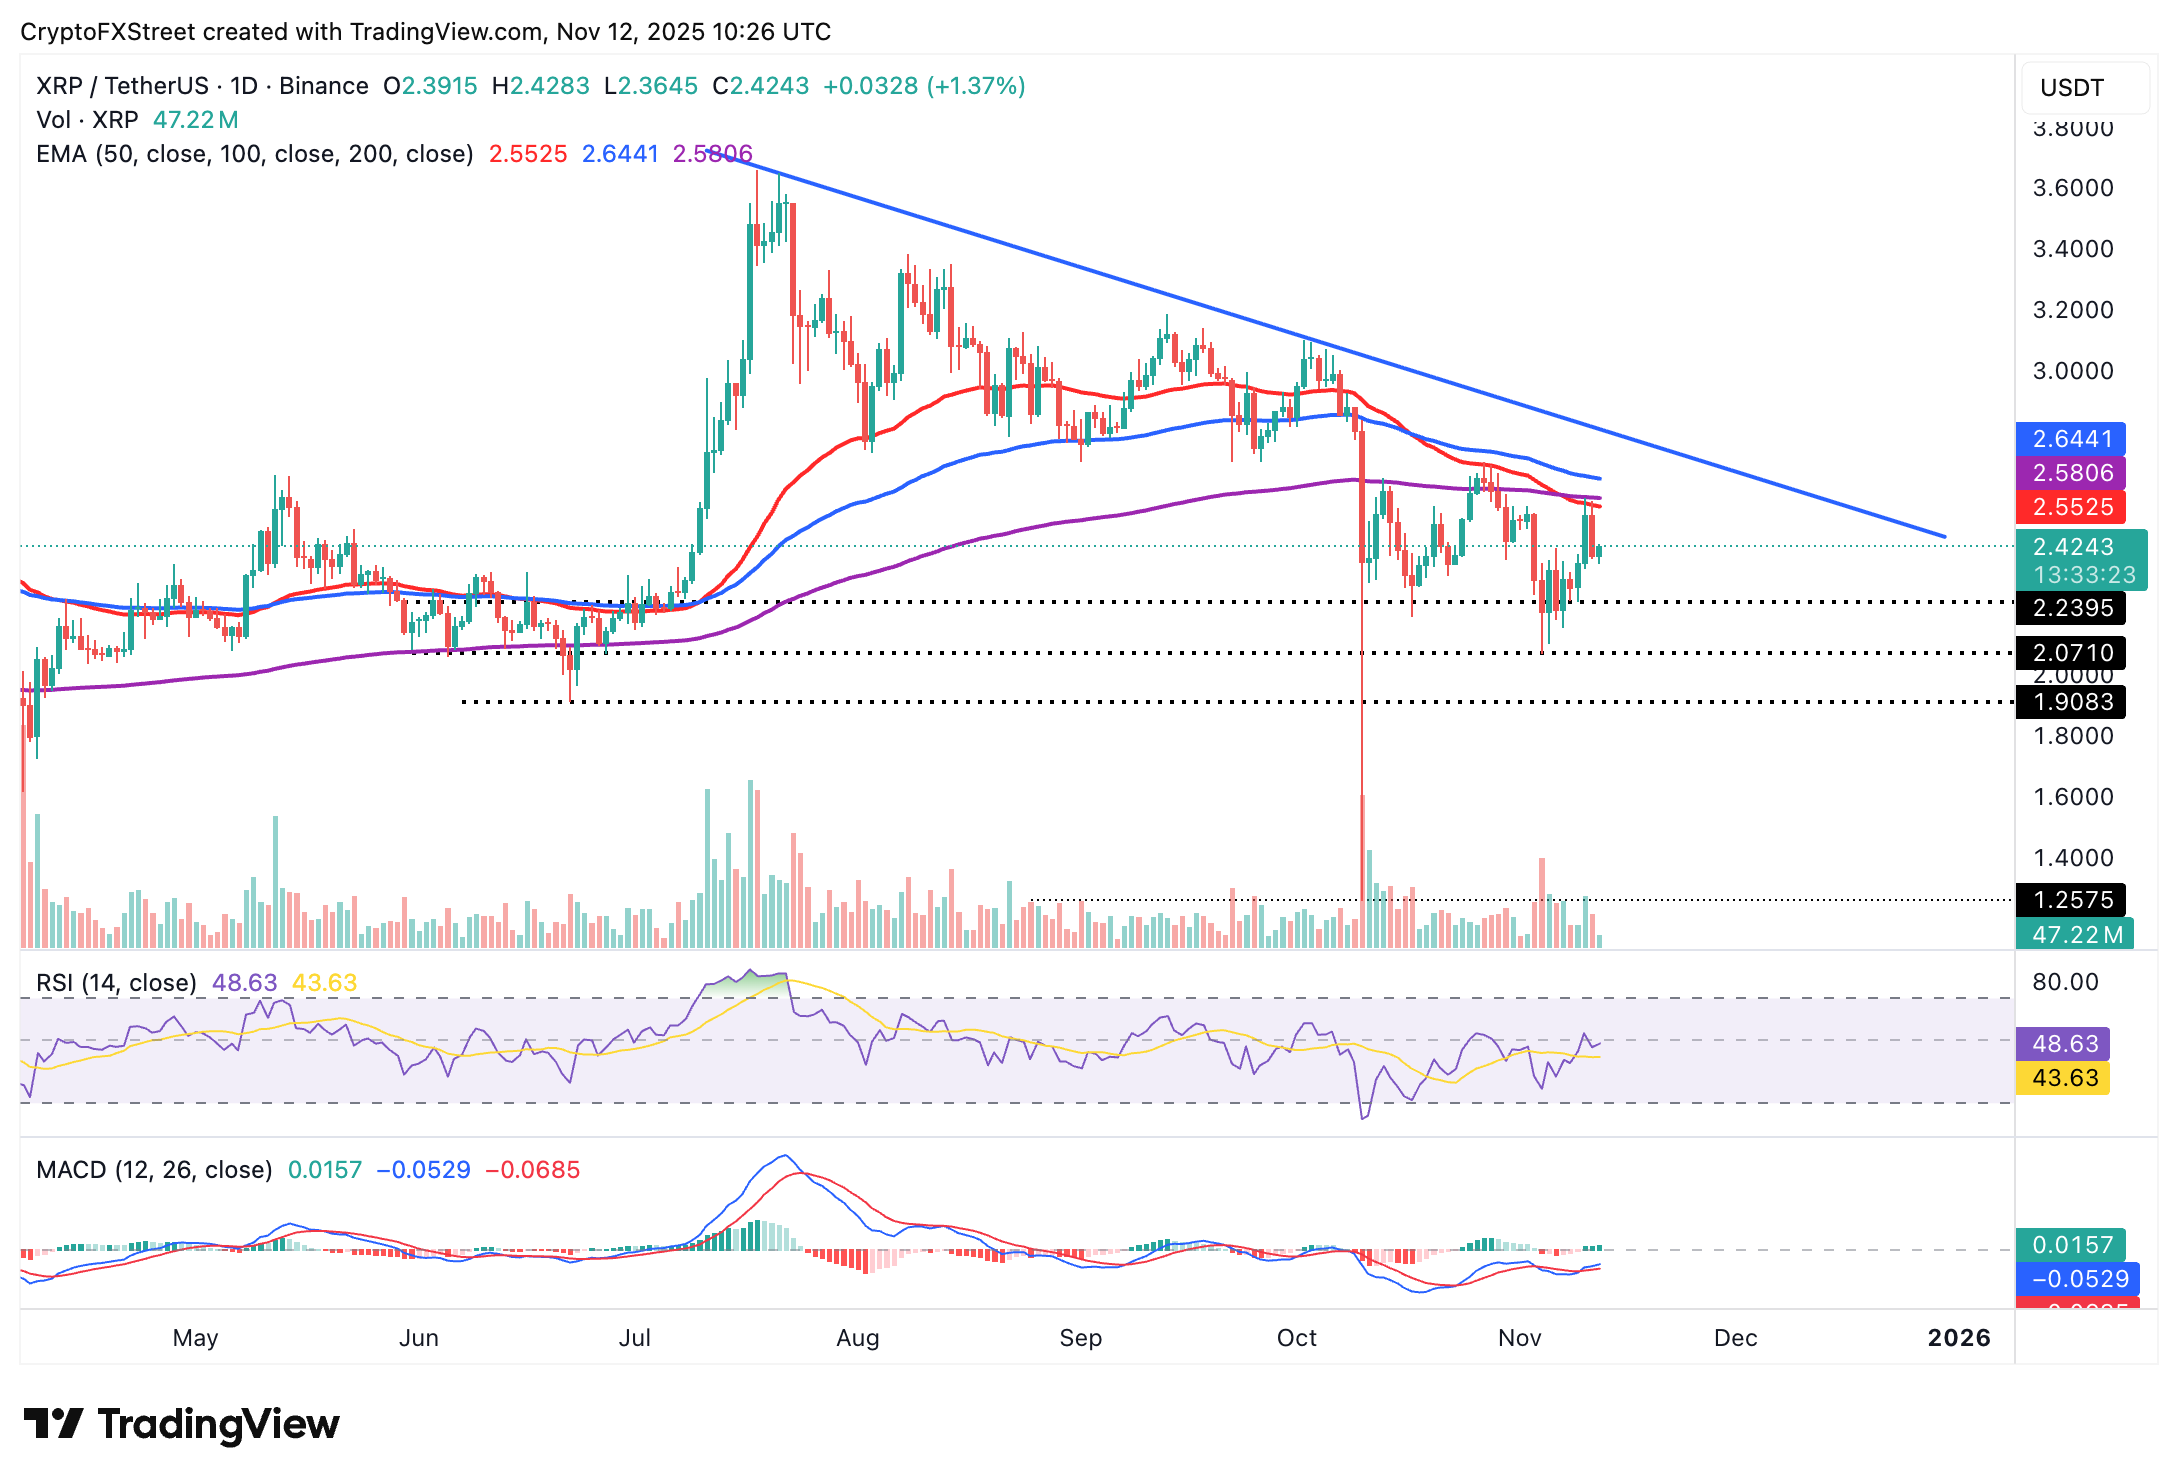
The RSI is at 48 and poised to cross into the bullish region, further reinforcing the positive outlook. Other key areas of interest for traders include the 200-day EMA at $2.58 and the 100-day EMA at $2.64, which are likely to limit the uptrend if investors start realizing profits early.
Crypto ETF FAQs
An Exchange-Traded Fund (ETF) is an investment vehicle or an index that tracks the price of an underlying asset. ETFs can not only track a single asset, but a group of assets and sectors. For example, a Bitcoin ETF tracks Bitcoin’s price. ETF is a tool used by investors to gain exposure to a certain asset.
Yes. The first Bitcoin futures ETF in the US was approved by the US Securities & Exchange Commission in October 2021. A total of seven Bitcoin futures ETFs have been approved, with more than 20 still waiting for the regulator’s permission. The SEC says that the cryptocurrency industry is new and subject to manipulation, which is why it has been delaying crypto-related futures ETFs for the last few years.
Yes. The SEC approved in January 2024 the listing and trading of several Bitcoin spot Exchange-Traded Funds, opening the door to institutional capital and mainstream investors to trade the main crypto currency. The decision was hailed by the industry as a game changer.
The main advantage of crypto ETFs is the possibility of gaining exposure to a cryptocurrency without ownership, reducing the risk and cost of holding the asset. Other pros are a lower learning curve and higher security for investors since ETFs take charge of securing the underlying asset holdings. As for the main drawbacks, the main one is that as an investor you can’t have direct ownership of the asset, or, as they say in crypto, “not your keys, not your coins.” Other disadvantages are higher costs associated with holding crypto since ETFs charge fees for active management. Finally, even though investing in ETFs reduces the risk of holding an asset, price swings in the underlying cryptocurrency are likely to be reflected in the investment vehicle too.
추천 기사


