

Crypto Today: Bitcoin, Ethereum and XRP struggle to regain momentum amid weak market signals
- Bitcoin edges below $113,000 on Wednesday, with momentum indicators pointing to the likelihood of further correction.
- Ethereum faces rejection from a key level despite spot ETFs recording mild inflows.
- XRP shows signs of weakness as futures Open Interest drops to levels not seen since November 2024.
Bitcoin (BTC), Ethereum (ETH), and Ripple (XRP) prices are struggling to regain upward momentum as broader market sentiment remains cautious on Wednesday. BTC and ETH face technical rejections at key levels, while XRP’s declining futures Open Interest reflects waning trader participation.
The broader crypto market continues to consolidate, and the recovery momentum appears to be losing steam due to resurfacing broader macroeconomic pressures. Renewed US-China trade tensions and the prolonged US government shutdown have dampened market sentiment, keeping investors cautious.
Data spotlight: Bitcoin and Ethereum record mild ETF inflows while XRP’s OI drops to 1-year low
Bitcoin institutional demand shows some signs of optimism. SoSoValue data shows that Bitcoin spot Exchange Traded Funds (ETFs) recorded a mild inflow of $102.58 million on Tuesday, breaking the two-day outflow streak. However, the size of the inflow is smaller compared to that seen during early October when BTC hit a new all-time high of $126,199.
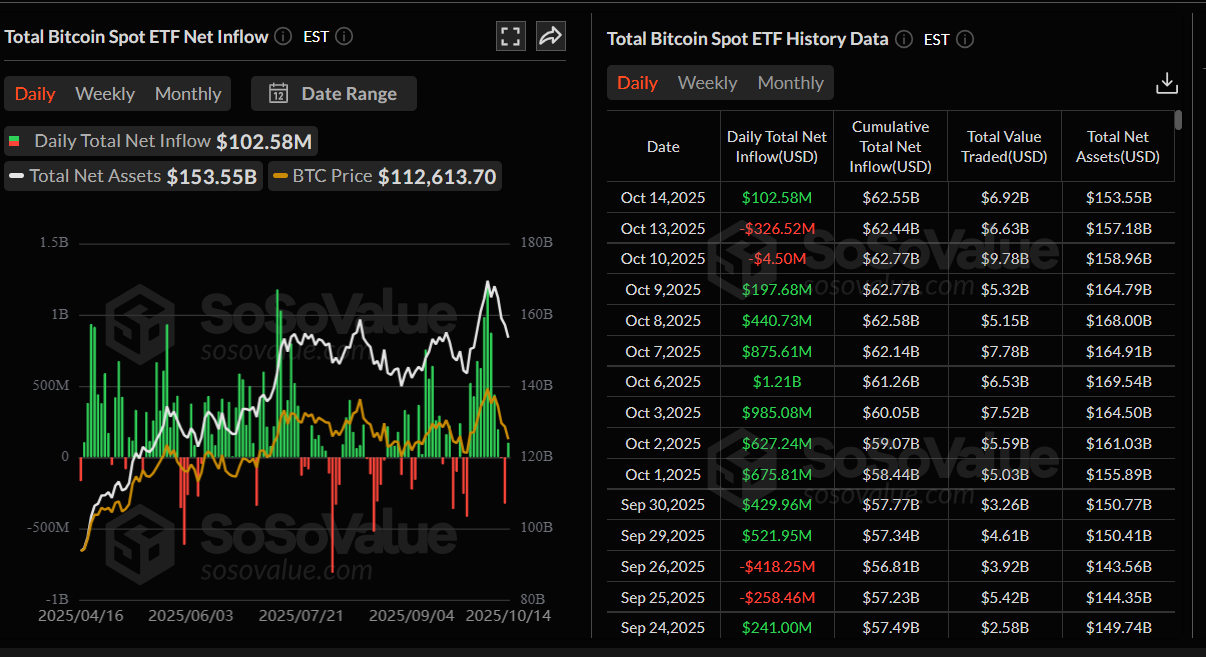
Total Bitcoin Spot ETF Net Inflow daily chart. Source: SoSoValue
Demand for Ethereum spot ETFs has also shown mild strength. The chart below shows that Ethereum spot ETFs recorded a mild inflow of $236.22 million on Tuesday, breaking the three-day outflow.
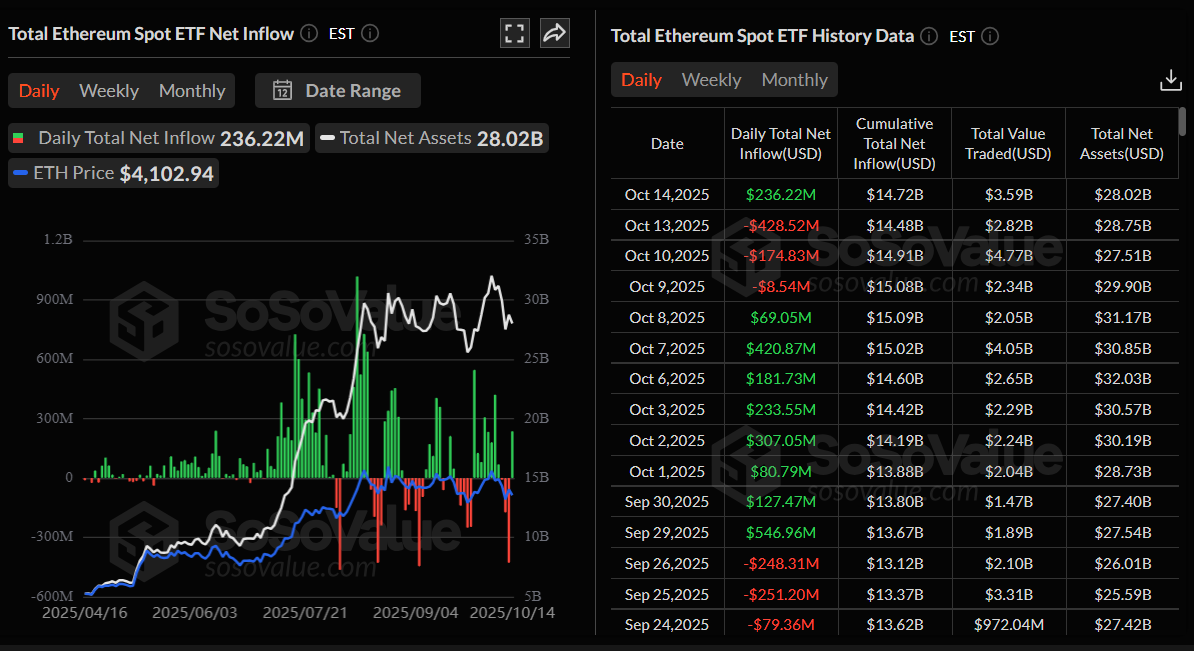
Total Ethereum Spot ETF net inflow daily chart. Source: SoSoValue
Meanwhile, XRP derivatives show signs of weakness, with futures Open Interest (OI) dropping to $563.57 million on Wednesday, reaching levels not seen since November 2024, reflecting waning investor participation.
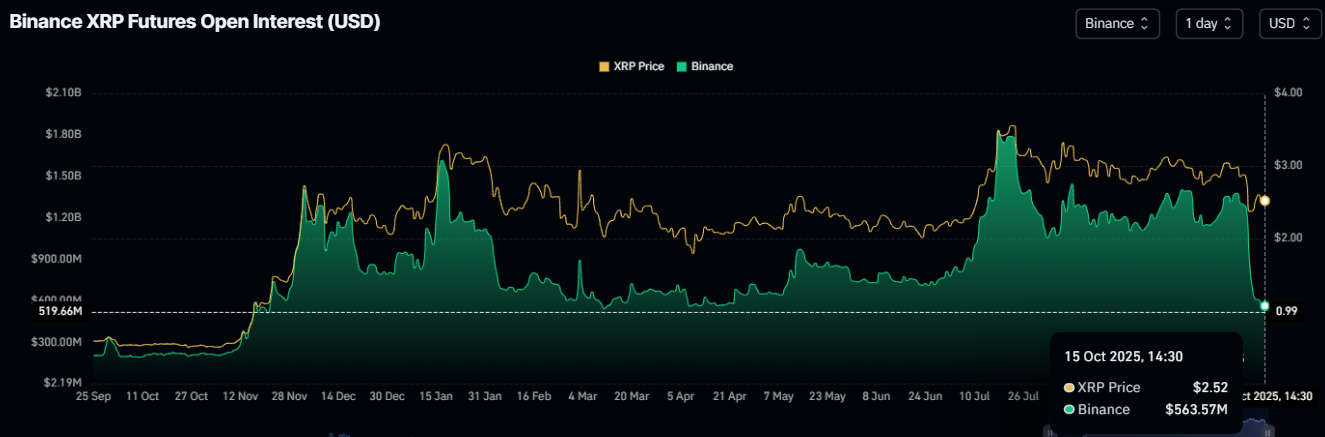
XRP Futures Open Interest | Source: CoinGlass
Chart of the day: Bitcoin momentum indicators signal potential for further correction
Bitcoin price recovered slightly on Sunday and closed above $114,900 after a sharp fall on Friday. At the time of writing on Wednesday, BTC hovers around $112,500 after being rejected from the 78.6% Fibonacci retracement level at $115,137, drawn from the April low of $74,508 to the October 6 high of $126,199, and the 50-day Exponential Moving Average (EMA) at $115,409 earlier in the week.
If BTC continues its correction, it could extend the decline toward the daily support level at $107,245.
The Relative Strength Index (RSI) indicator at 43 on the daily chart suggests that bearish momentum is gaining traction. Additionally, the Moving Average Convergence Divergence (MACD) showed a bearish crossover on Friday, further supporting the bearish view.
On the other side, if BTC recovers, it could extend the recovery toward the 50-day EMA at $115,400.
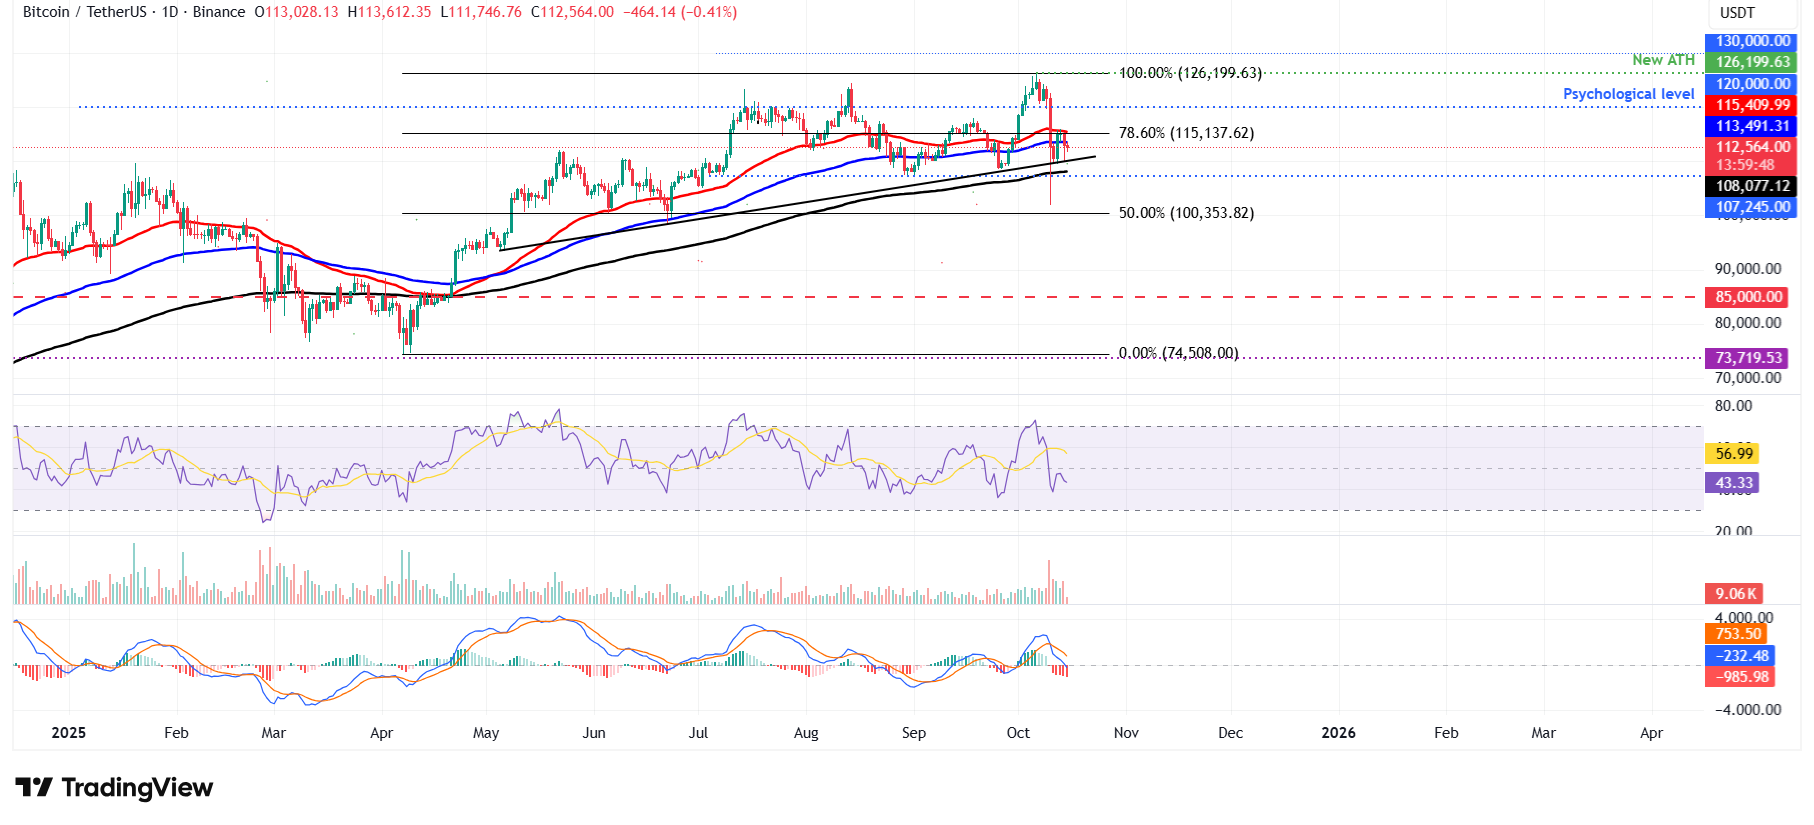
BTC/USDT daily chart
Altcoins update: Ethereum and XRP bears are in control of the momentum
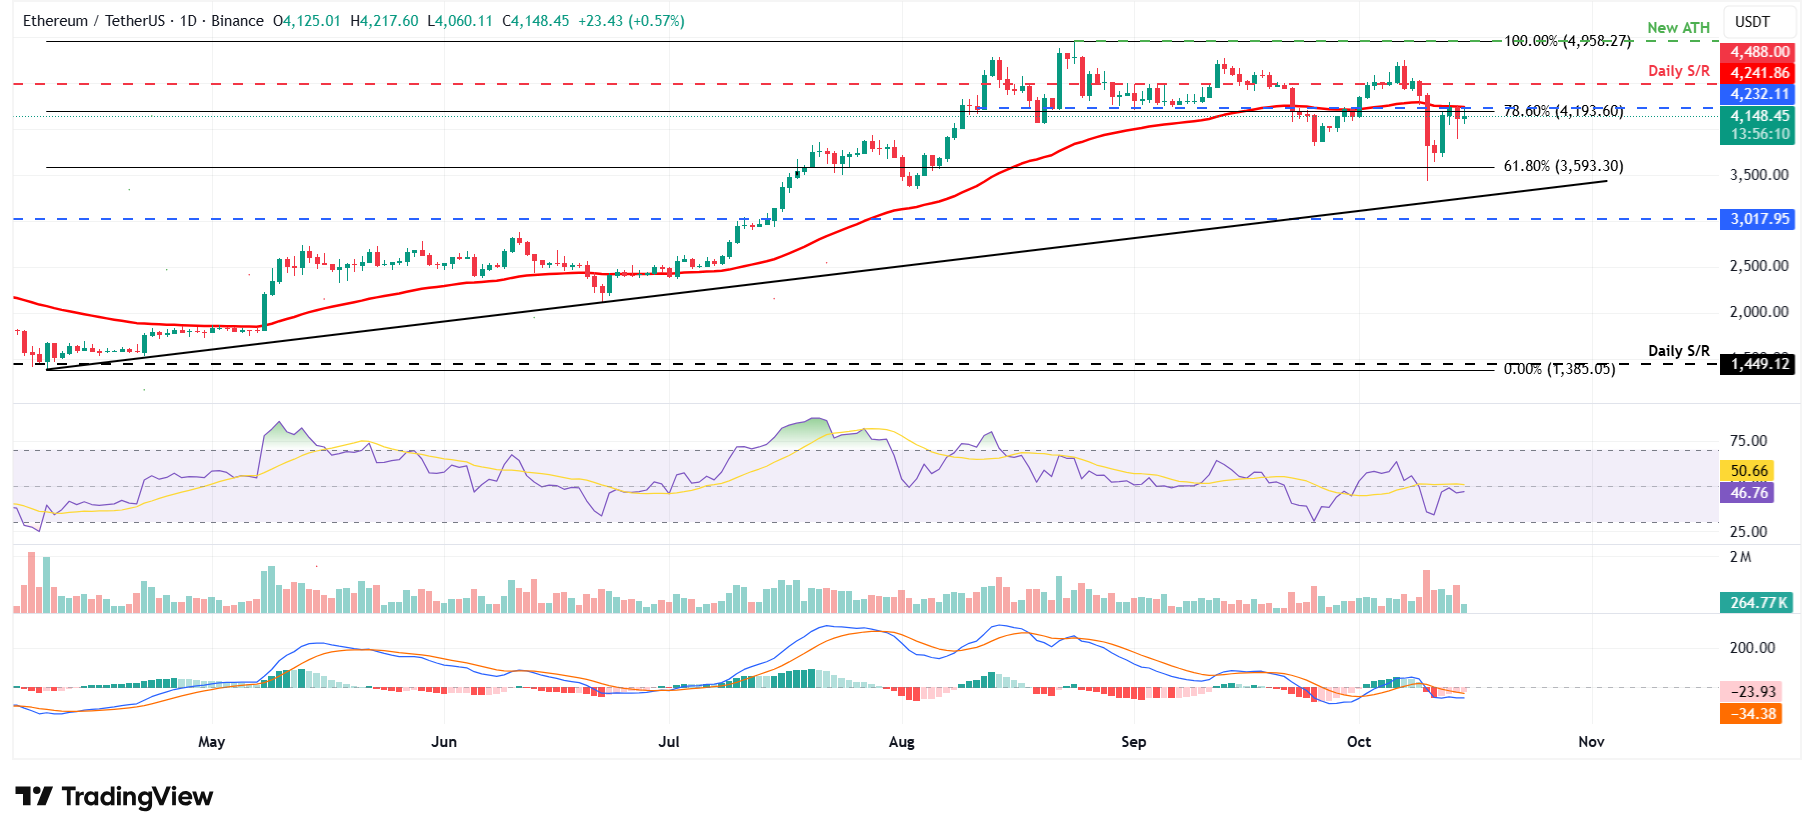
Ethereum price found support around the 61.8% Fibonacci retracement level at $3,953 (drawn from the April low of $1,385 to the record high of $4,956) on Saturday and recovered by 13% over the next two days. On Tuesday, ETH declined slightly after falling below the daily resistance level at $4,232, which roughly coincides with the 50-day EMA and the 78.6% Fibonacci retracement level. At the time of writing on Wednesday, it hovers around $4,140.
If ETH continues its pullback, it could extend the decline toward the 61.8% Fibonacci retracement level at $3,953.
The Relative Strength Index (RSI) reads 46 on the daily chart, indicating bearish momentum is gaining traction. Additionally, the Moving Average Convergence Divergence (MACD) showed a bearish crossover on Friday, further supporting the bearish view.
However, if ETH breaks above the $4,232 level and finds support around it, the rally could extend toward the next daily resistance at $4,488.
ETH/USDT daily chart
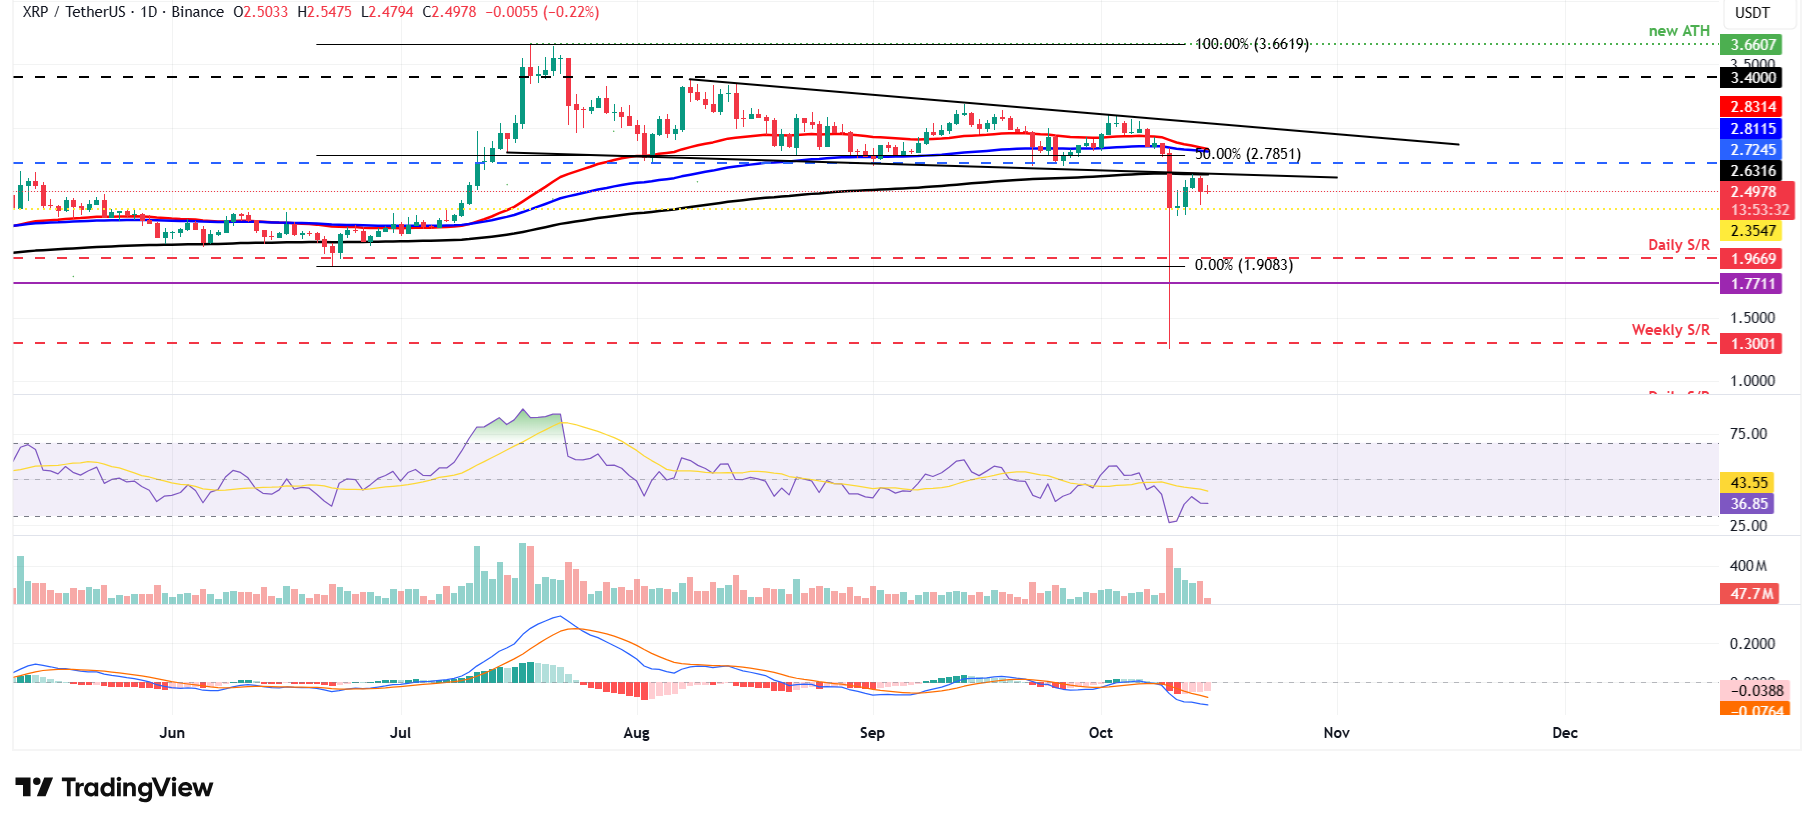
Ripple price found support around the daily support level at $2.35 on Saturday and recovered over 10% in the next two days. On Tuesday, XRP declined after founding resistance around the lower trendline of a falling wedge pattern. At the time of writing on Wednesday, it hovers around $2.49.
If XRP continues its correction, it could extend the decline toward the daily support at $2.35.
Like Ethereum, XRP’s momentum indicators RSI and MACD also support the bearish view.
On the other hand, if XRP recovers, it could extend the recovery toward the 50-day EMA at $2.83.
XRP/USDT daily chart
Cryptocurrency metrics FAQs
The developer or creator of each cryptocurrency decides on the total number of tokens that can be minted or issued. Only a certain number of these assets can be minted by mining, staking or other mechanisms. This is defined by the algorithm of the underlying blockchain technology. On the other hand, circulating supply can also be decreased via actions such as burning tokens, or mistakenly sending assets to addresses of other incompatible blockchains.
Market capitalization is the result of multiplying the circulating supply of a certain asset by the asset’s current market value.
Trading volume refers to the total number of tokens for a specific asset that has been transacted or exchanged between buyers and sellers within set trading hours, for example, 24 hours. It is used to gauge market sentiment, this metric combines all volumes on centralized exchanges and decentralized exchanges. Increasing trading volume often denotes the demand for a certain asset as more people are buying and selling the cryptocurrency.
Funding rates are a concept designed to encourage traders to take positions and ensure perpetual contract prices match spot markets. It defines a mechanism by exchanges to ensure that future prices and index prices periodic payments regularly converge. When the funding rate is positive, the price of the perpetual contract is higher than the mark price. This means traders who are bullish and have opened long positions pay traders who are in short positions. On the other hand, a negative funding rate means perpetual prices are below the mark price, and hence traders with short positions pay traders who have opened long positions.
추천 기사


