
VeChain Price Forecast: VET eyes 32% breakout amid gradual shift to institutional adoption
- VeChain consolidates above the 50-day and 100-day EMAs as bulls aim for a 32% run.
- VeChain is quietly building institutional rails to support decentralization and the next phase of real-world adoption.
- VeChain’s sideways price action suggests accumulation ahead of a technical breakout to $0.0338.
VeChain (VET) is trending up and trading above $0.0250 on Thursday as bulls aim for a 32% technical breakout to $0.0338. The token’s nearly 4% increase has the backing of the derivatives market, as evidenced by the futures-weighted funding rate rising and stabilizing at 0.0113%.
Traders are increasingly leveraging long positions in VET despite an extended range consolidation. If the funding rate steadies in the coming days, the VET price could gain bullish momentum and increase the chances of the 32% breakout.
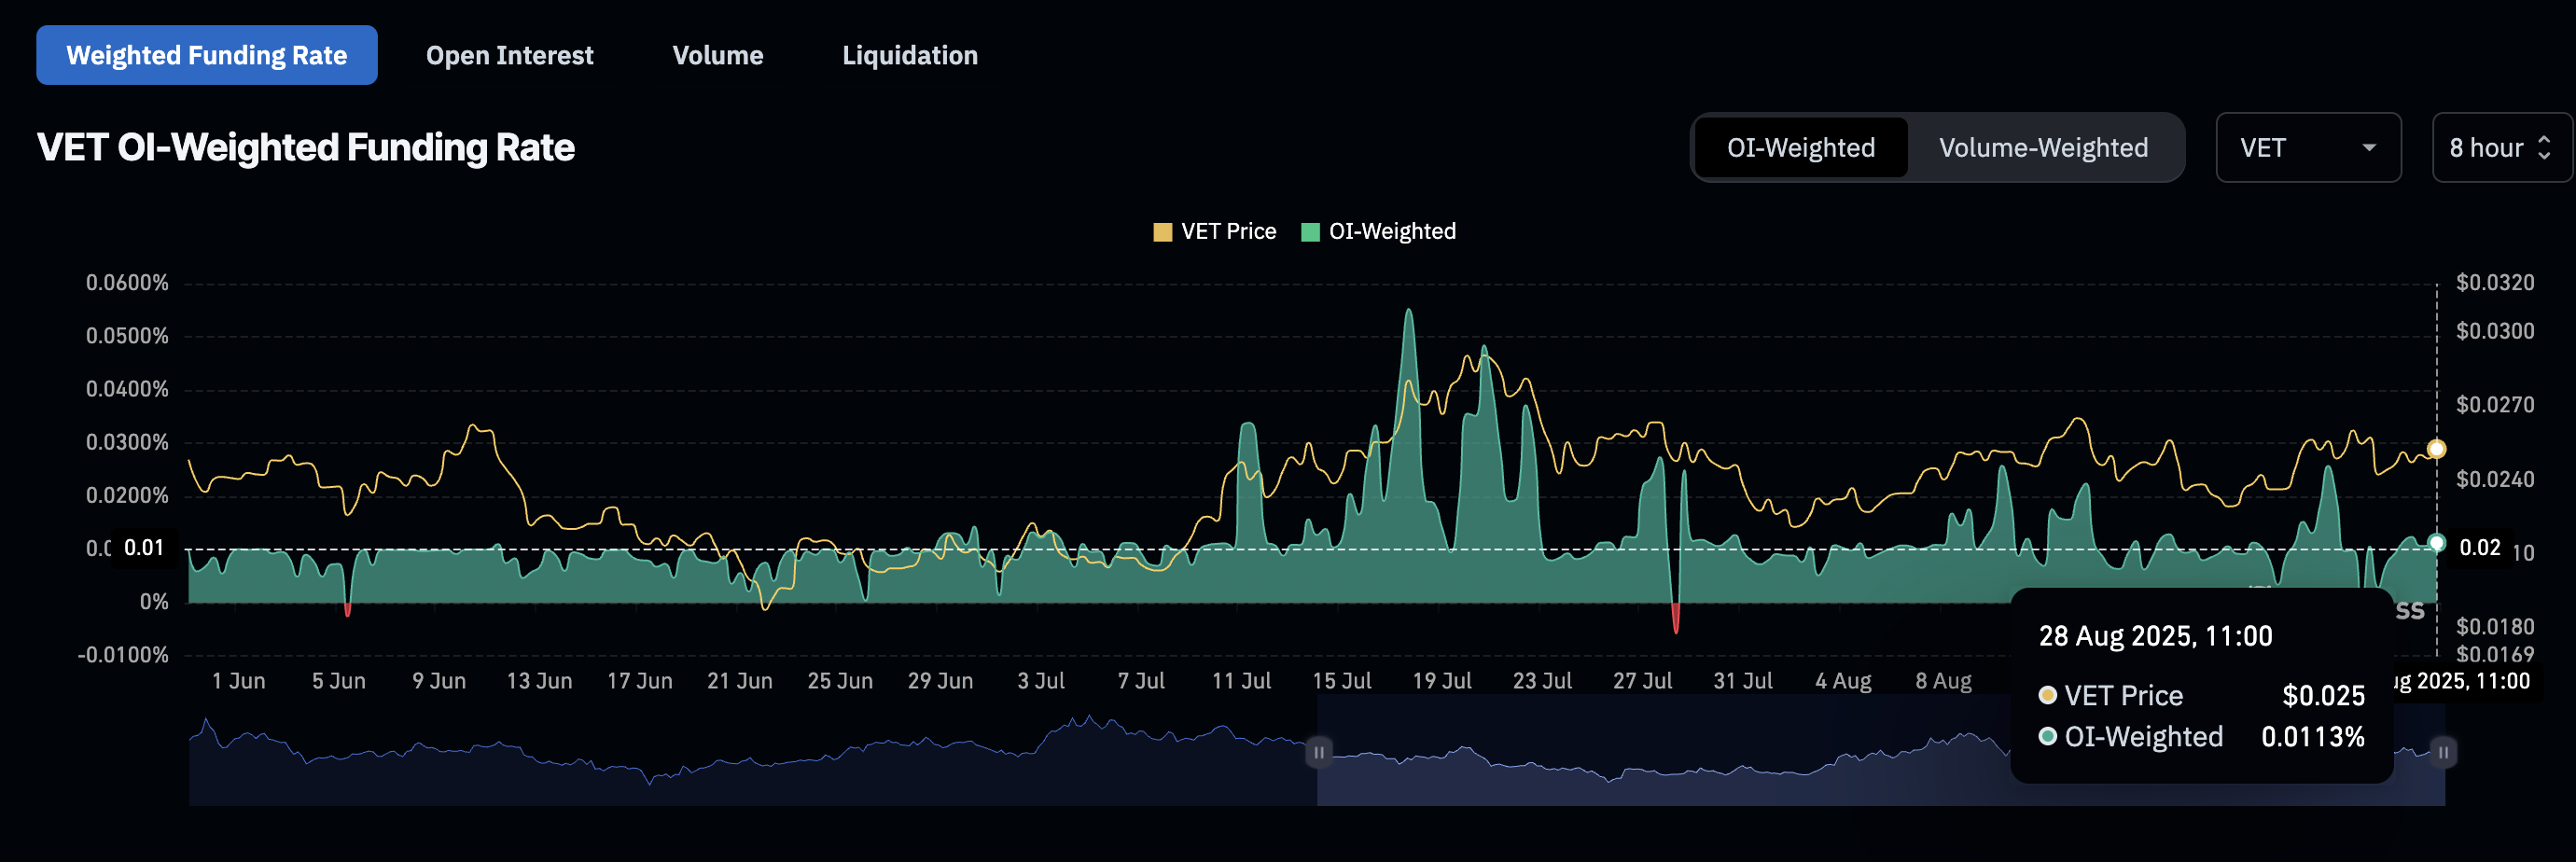
VeChain Weighted Funding Rate | Source: CoinGlass
VeChain targets institutional adoption
VeChain is gradually transitioning from a retail-focused platform to one that favors institutional adoption. In addition to building rails to support real-world assets (RWAs), the platform’s staking architecture has undergone significant changes. These modifications have been incorporated into VeChain’s StarGate, a platform launched on July 1 to revamp staking supported by the protocol’s latest software upgrade, called Galactica.
The new staking mechanism is tracked using non-fungible tokens (NFTs), ensuring transparency through on-chain minting and verification. Following the launch of StarGate, 5.8 billion VET had been locked in the smart contract as of Wednesday.
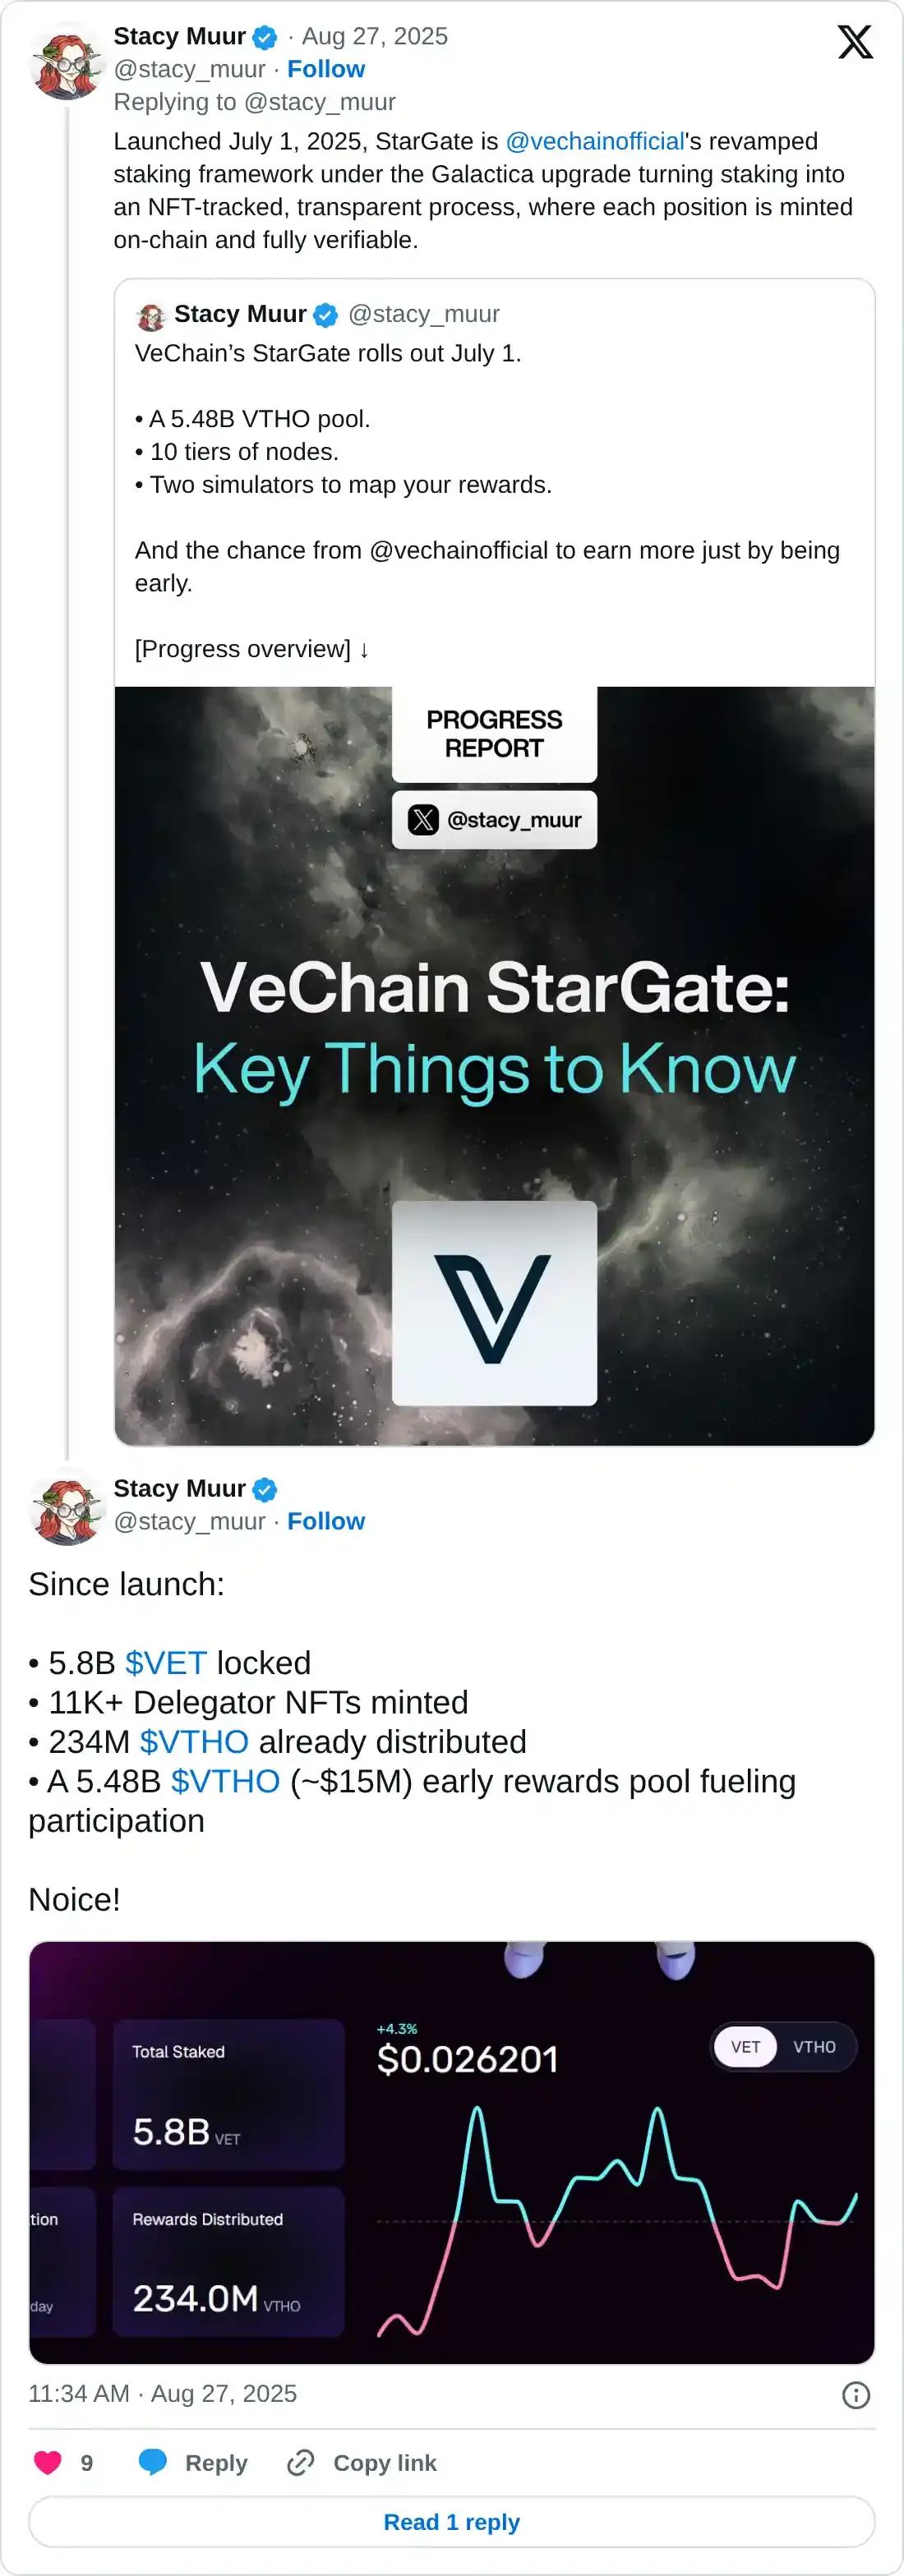
StarGate could position VeChain as an institutional-grade staking protocol by minting positions as NFTs, turning them into on-chain primitives that are traceable, portable, composable and built to scale.
VeChain is also collaborating with institutions like BitGo to build institutional-grade digital infrastructure. The integration with BitGo supports regulated custody and insurance-backed safeguards, which reduce operational risk for large stakeholders aiming for validator roles.
Technical outlook: VeChain poised for breakout
VeChain is positioned above the 50-day Exponential Moving Average (EMA) at $0.0245 and the 100-day EMA at $0.02484. Its bullish outlook is underpinned by the Relative Strength Index (RSI), which stands at 55, rising as buying pressure intensifies.
The Bollinger Bands indicator on the daily chart indicates low trading volume as consolidation extends widely. Further constriction of the bands would signal a potential breakout toward the supply around $0.0338.
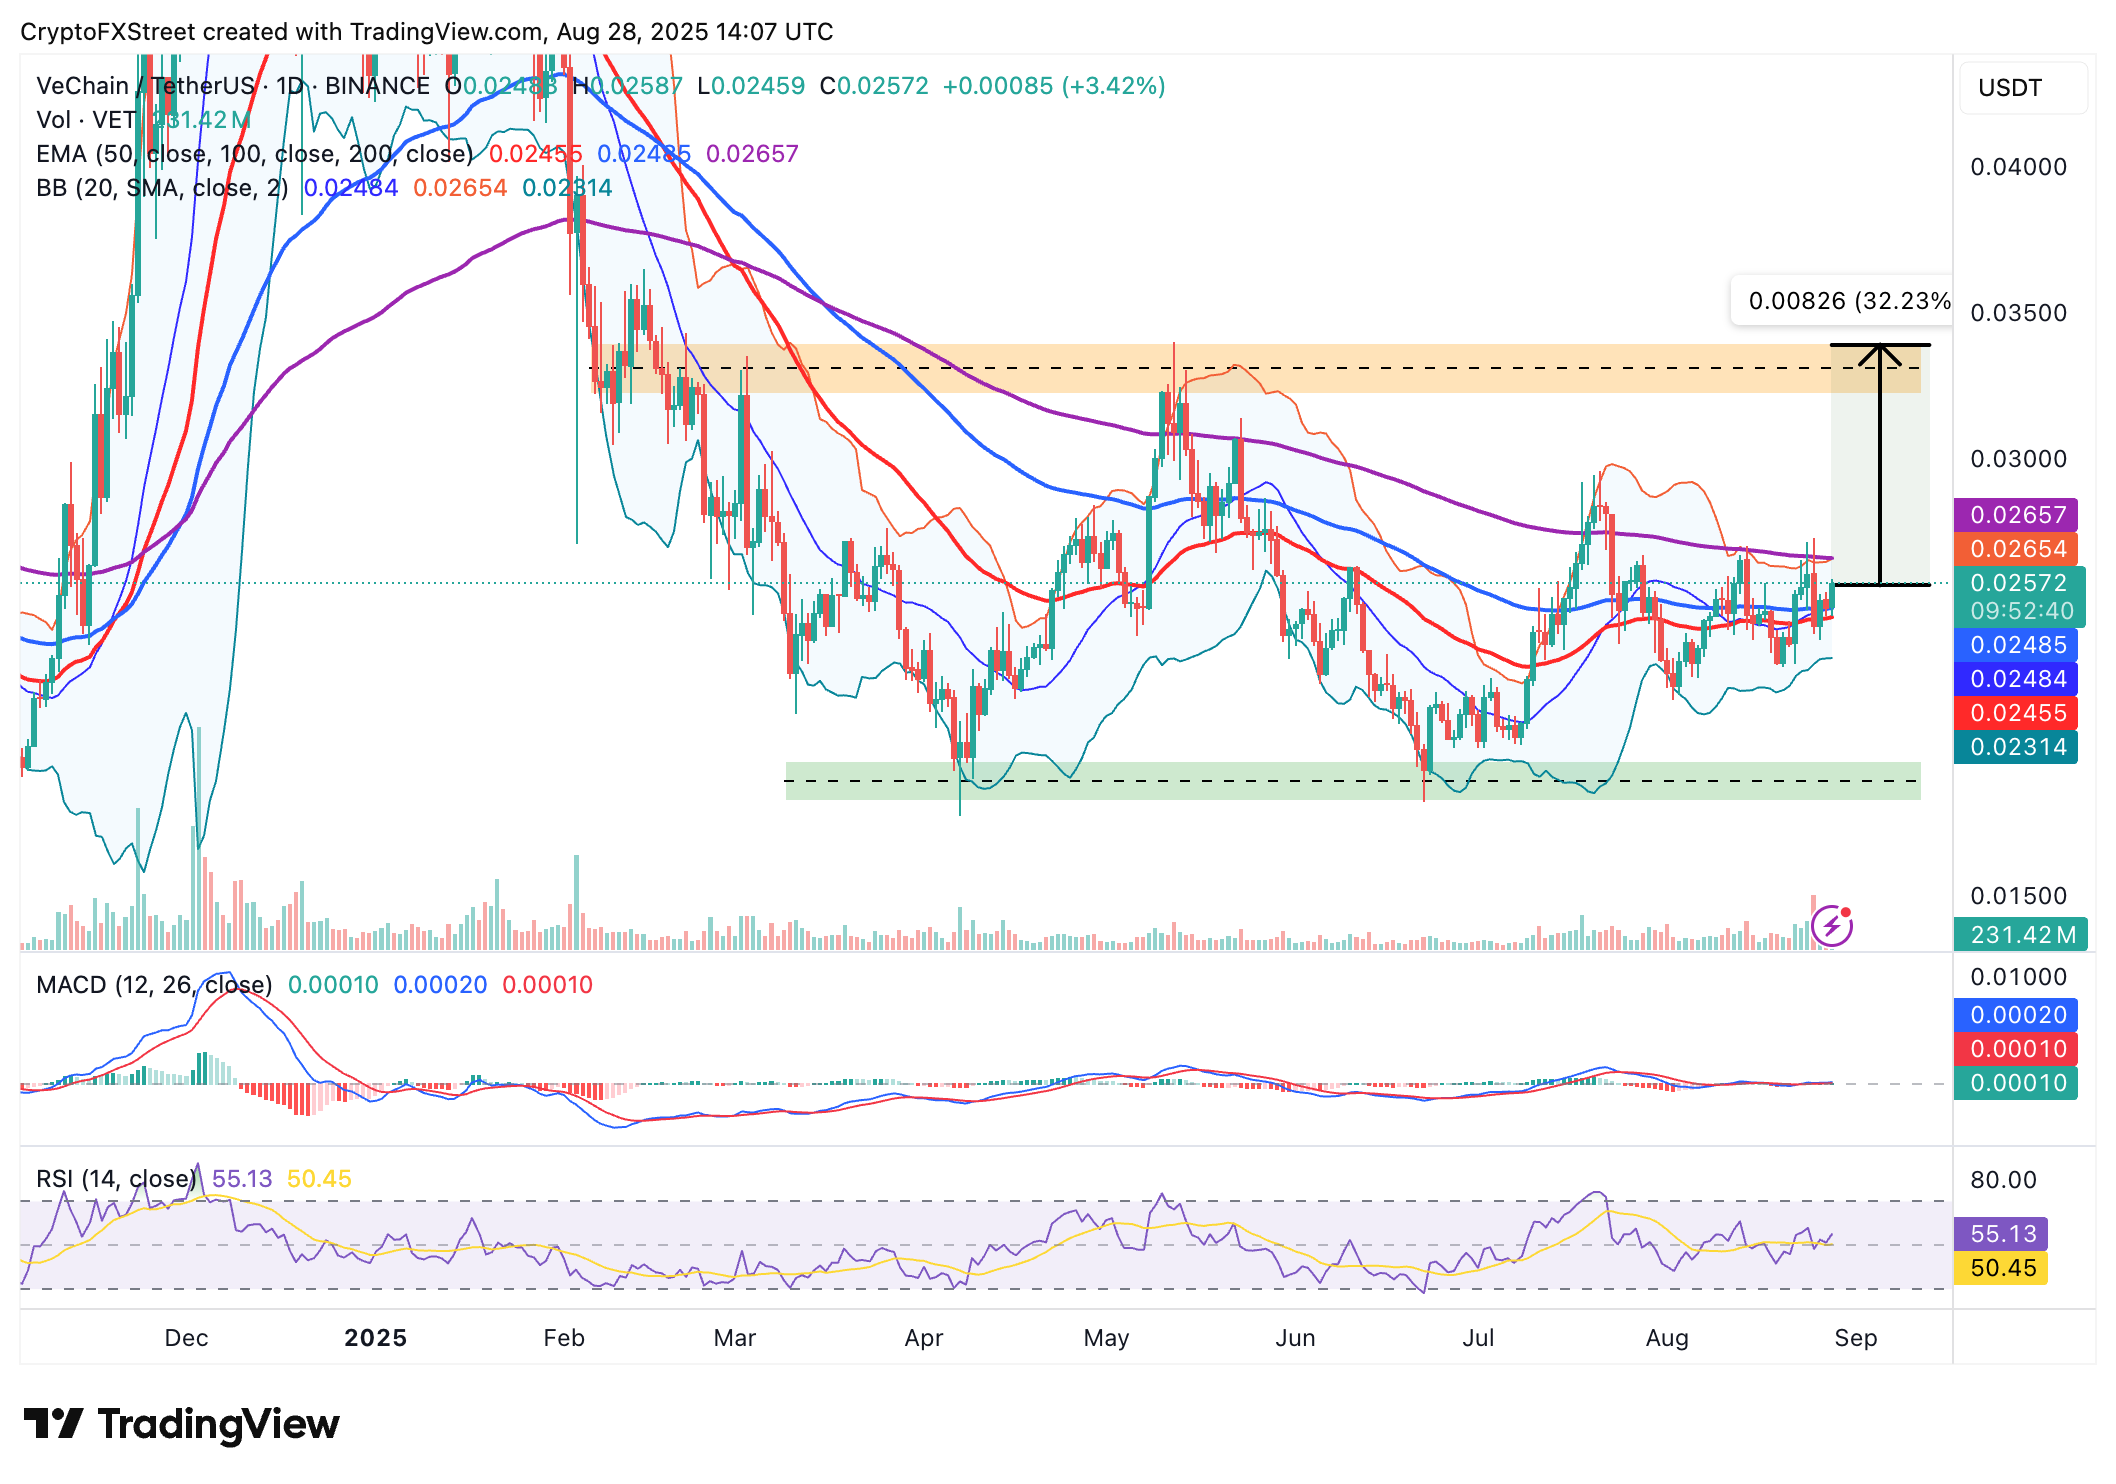
VET/USDT daily chart
Still, the Moving Average Convergence Divergence (MACD) indicator, currently sideways around the zero line, indicates that the current sideways trading could last longer than expected. Traders will look for a break above the 200-day EMA at $0.0265 to assess recovery strength, with eyes fixed on the seller congestion at $0.0338.
Open Interest, funding rate FAQs
Higher Open Interest is associated with higher liquidity and new capital inflow to the market. This is considered the equivalent of increase in efficiency and the ongoing trend continues. When Open Interest decreases, it is considered a sign of liquidation in the market, investors are leaving and the overall demand for an asset is on a decline, fueling a bearish sentiment among investors.
Funding fees bridge the difference between spot prices and prices of futures contracts of an asset by increasing liquidation risks faced by traders. A consistently high and positive funding rate implies there is a bullish sentiment among market participants and there is an expectation of a price hike. A consistently negative funding rate for an asset implies a bearish sentiment, indicating that traders expect the cryptocurrency’s price to fall and a bearish trend reversal is likely to occur.
추천 기사


