

Pi Network Price Analysis: Bears eye record low as Pi Foundation moves 500 million PI
- Pi Network’s token edges lower on Monday, risking a crucial support level breakdown.
- The social dominance score hits its 30-day moving average.
- Pi Foundation wallet made a strategic transfer of 500 million PI tokens on Friday.
Pi Network (PI) edges lower by over 1% at press time on Monday, marking a bearish start to the week. The mobile mining cryptocurrency is eyeing a record low as selling pressure grows alongside social chatter.
Furthermore, the Pi Foundation made a strategic transfer of 500 million tokens on Friday to a new wallet, coinciding with the start of the ongoing correction.
Large transfer from Pi Foundation creates buzz
PiScan data shows the Pi Foundation #14 wallet made five consecutive transactions of 100 million PI tokens to different wallets. The move comes as a strategic transfer with no official announcement, days after the hints of a second migration phase from a PI moderator.
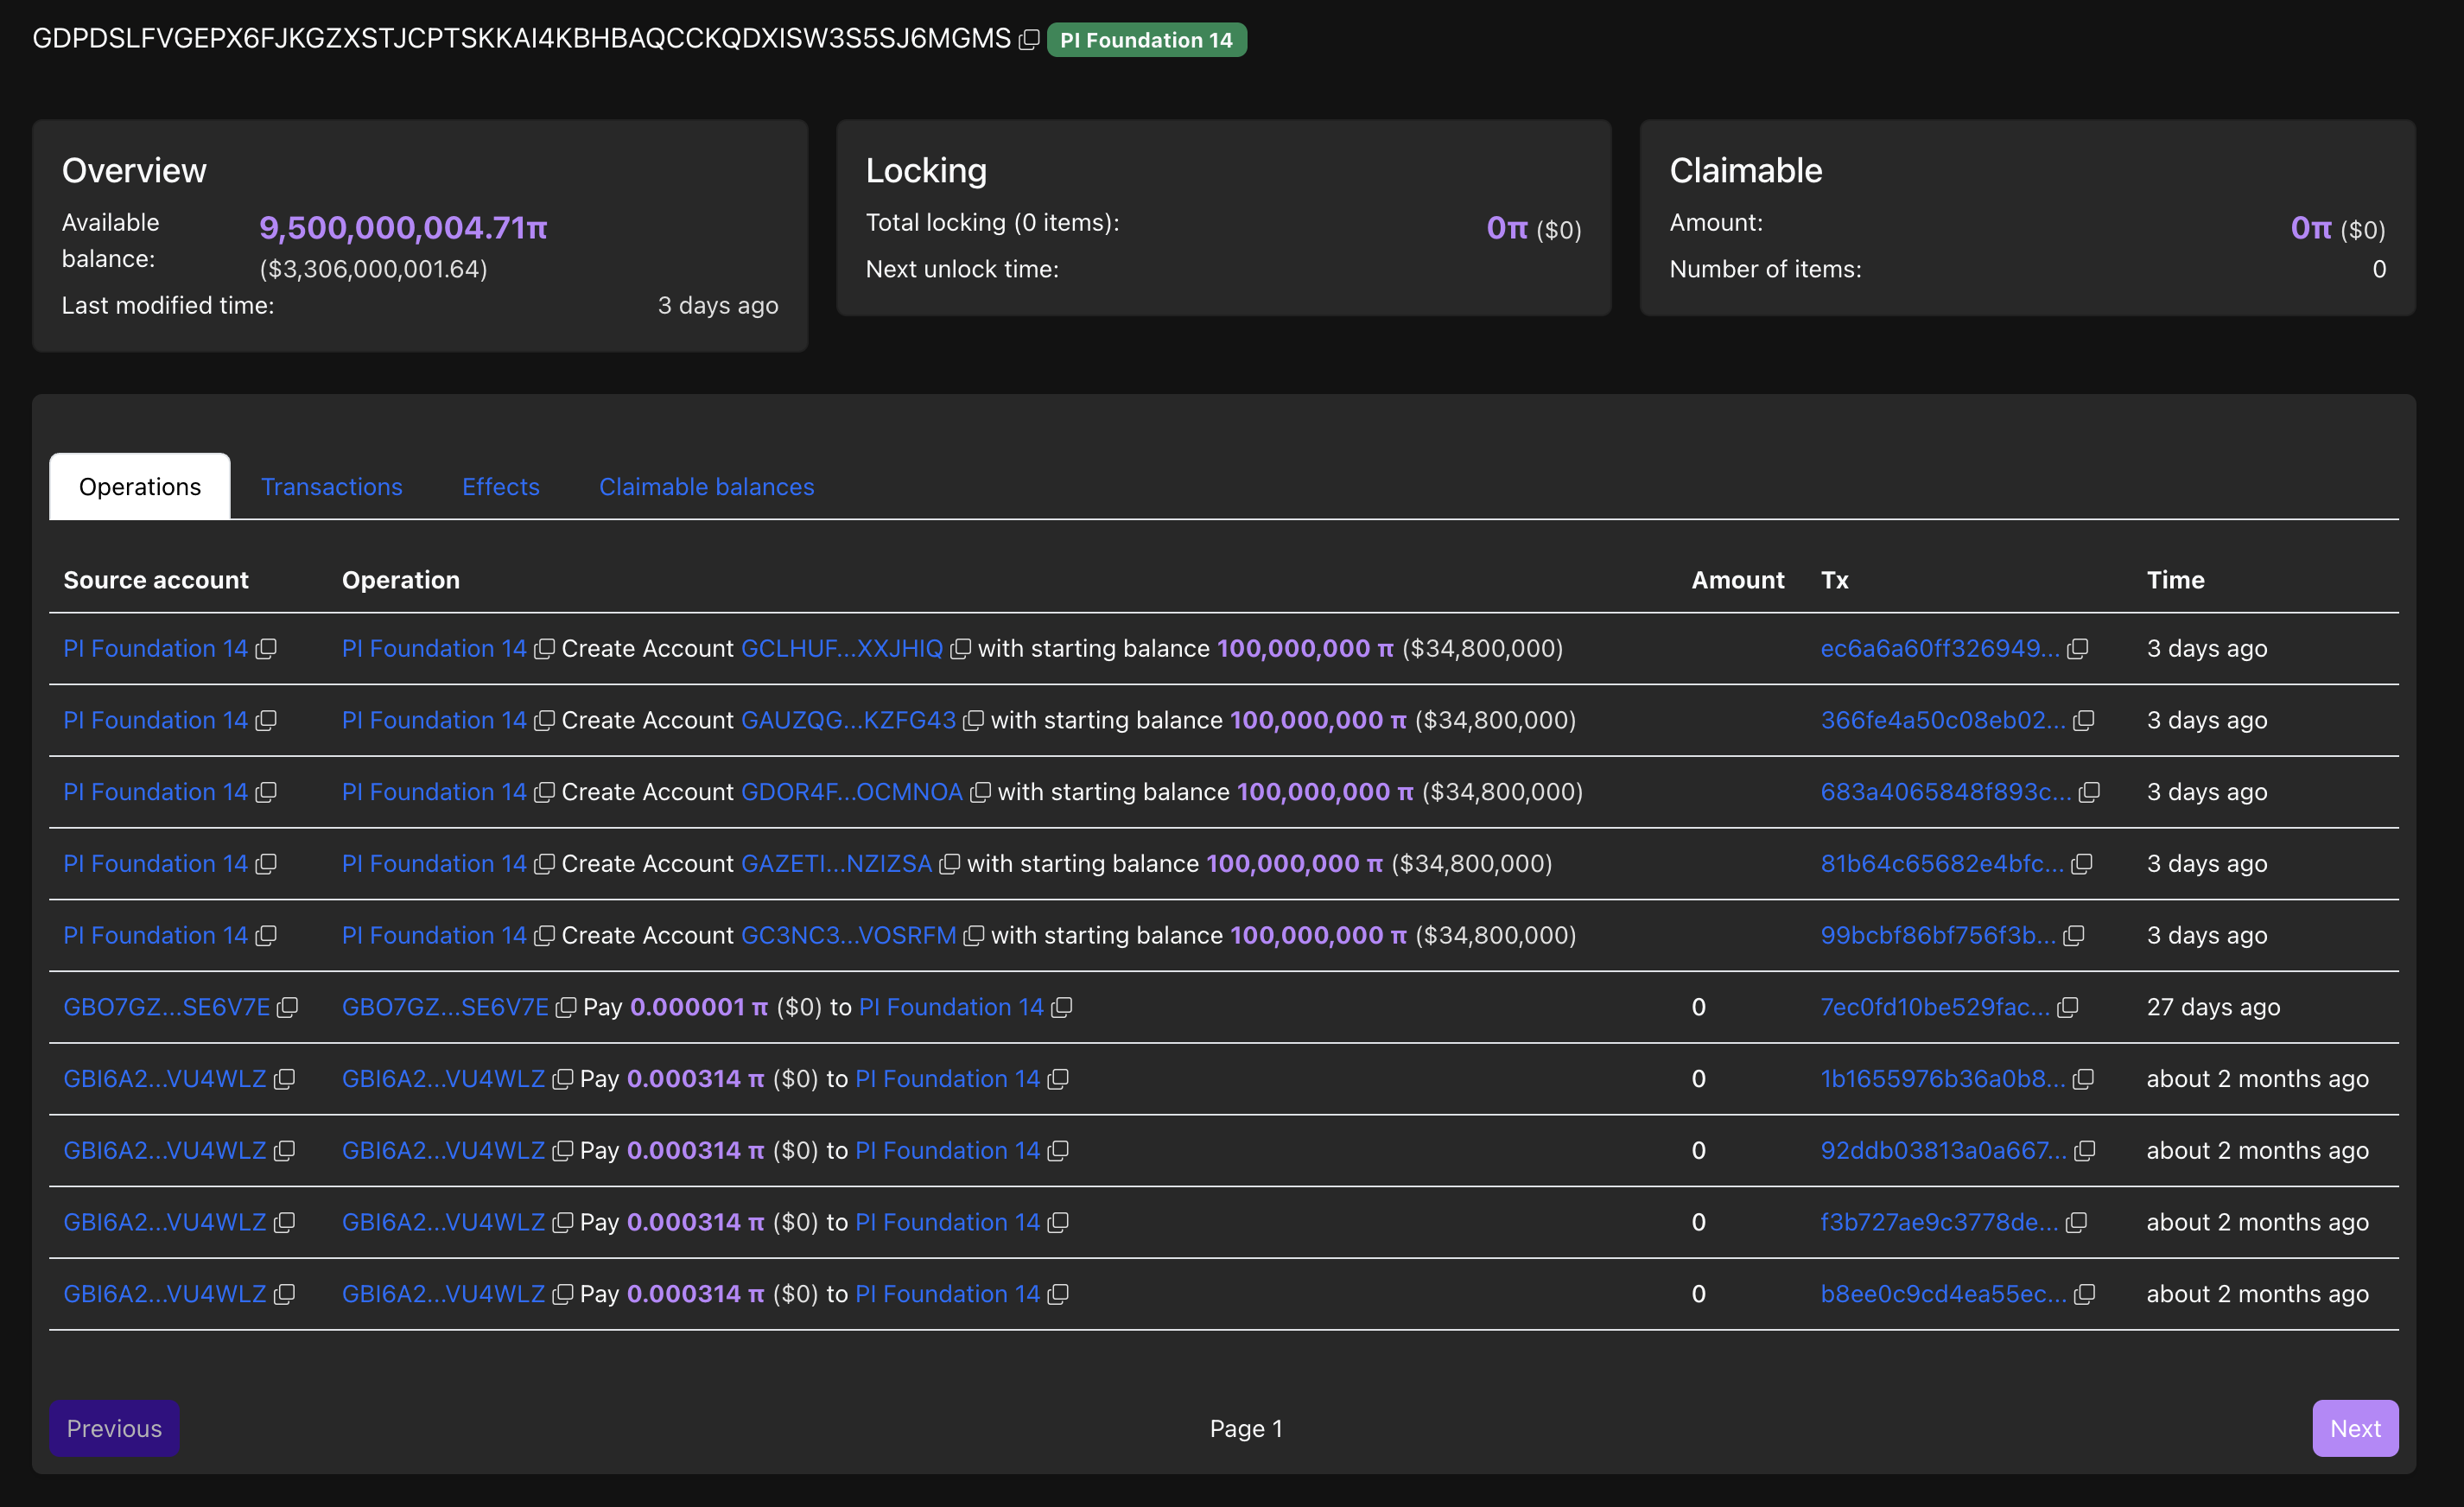
Pi Foundation wallet transactions. Source: PiScan
Still, the sudden shift marks the first-ever withdrawal from the Pi Foundation #14 wallet, following an initial starting balance of 10 billion PI tokens.
Furthermore, the social chatter surrounding the large transactions has increased the social dominance score of Pi Network to 0.202% among all crypto-related social media posts, crossing the 30-day average of 0.195%.
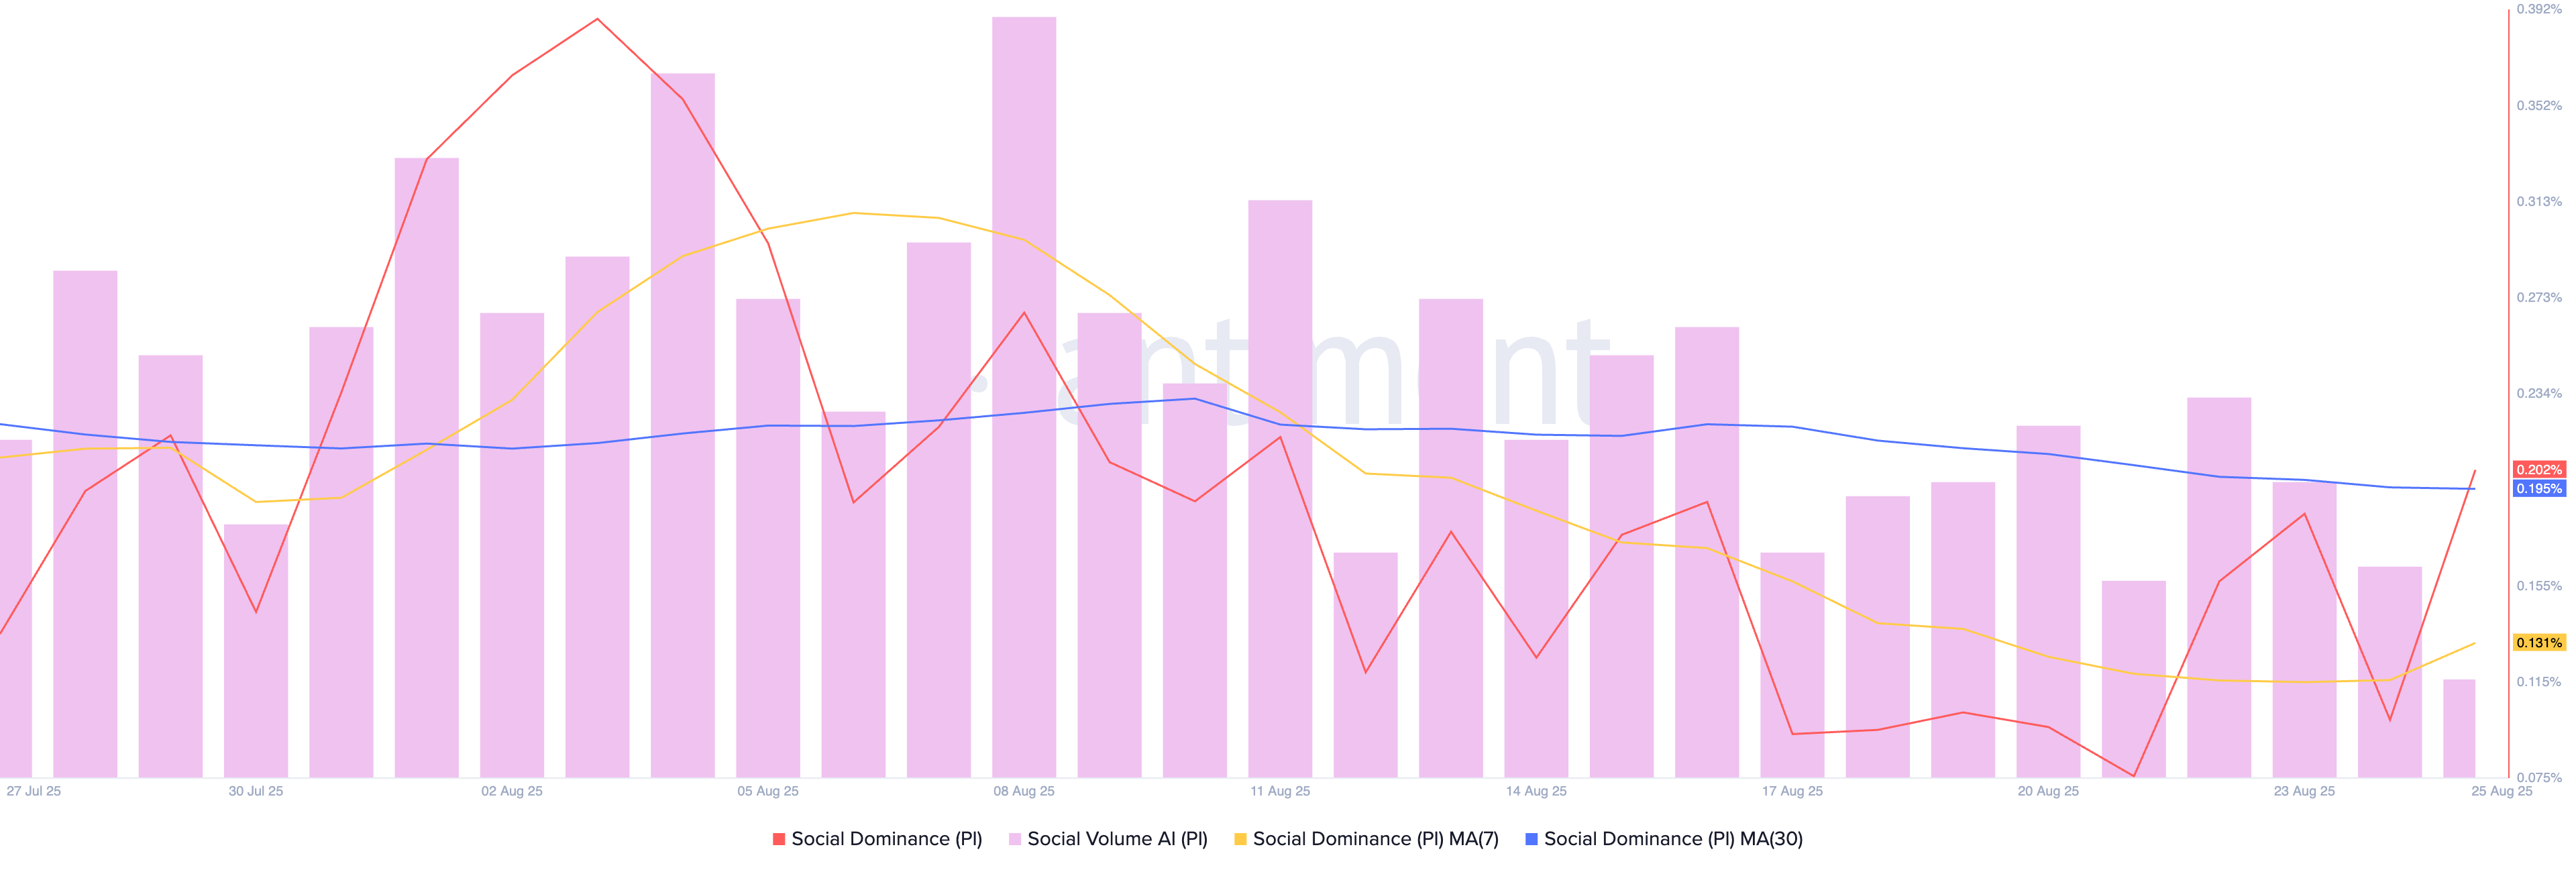
Pi Network social score. Source: Santiment
Pi Network at a crucial crossroads
The declining Pi Network’s PI token puts pressure on the $0.3442 support level marked by the August 5 close. A bearish close to the day below this support level would extend the downcycle within the larger falling channel pattern, marked on the daily chart (shared below).
Pi Network’s downtrend could find support at its record low of $0.3220 from August 1, before reaching the channel’s lower boundary line near the $0.2567 level.
The momentum indicators are on the verge of flashing a sell signal on the daily chart as the declining trend gains traction. The Moving Average Convergence Divergence (MACD) indicates a potential crossover below its signal line, which would signal a bearish shift in trend momentum and trigger a sell signal.
Furthermore, the downward-sloping Relative Strength Index (RSI) reads 38 as selling pressure increases. The indicator also signals extended room for correction before reaching oversold levels.
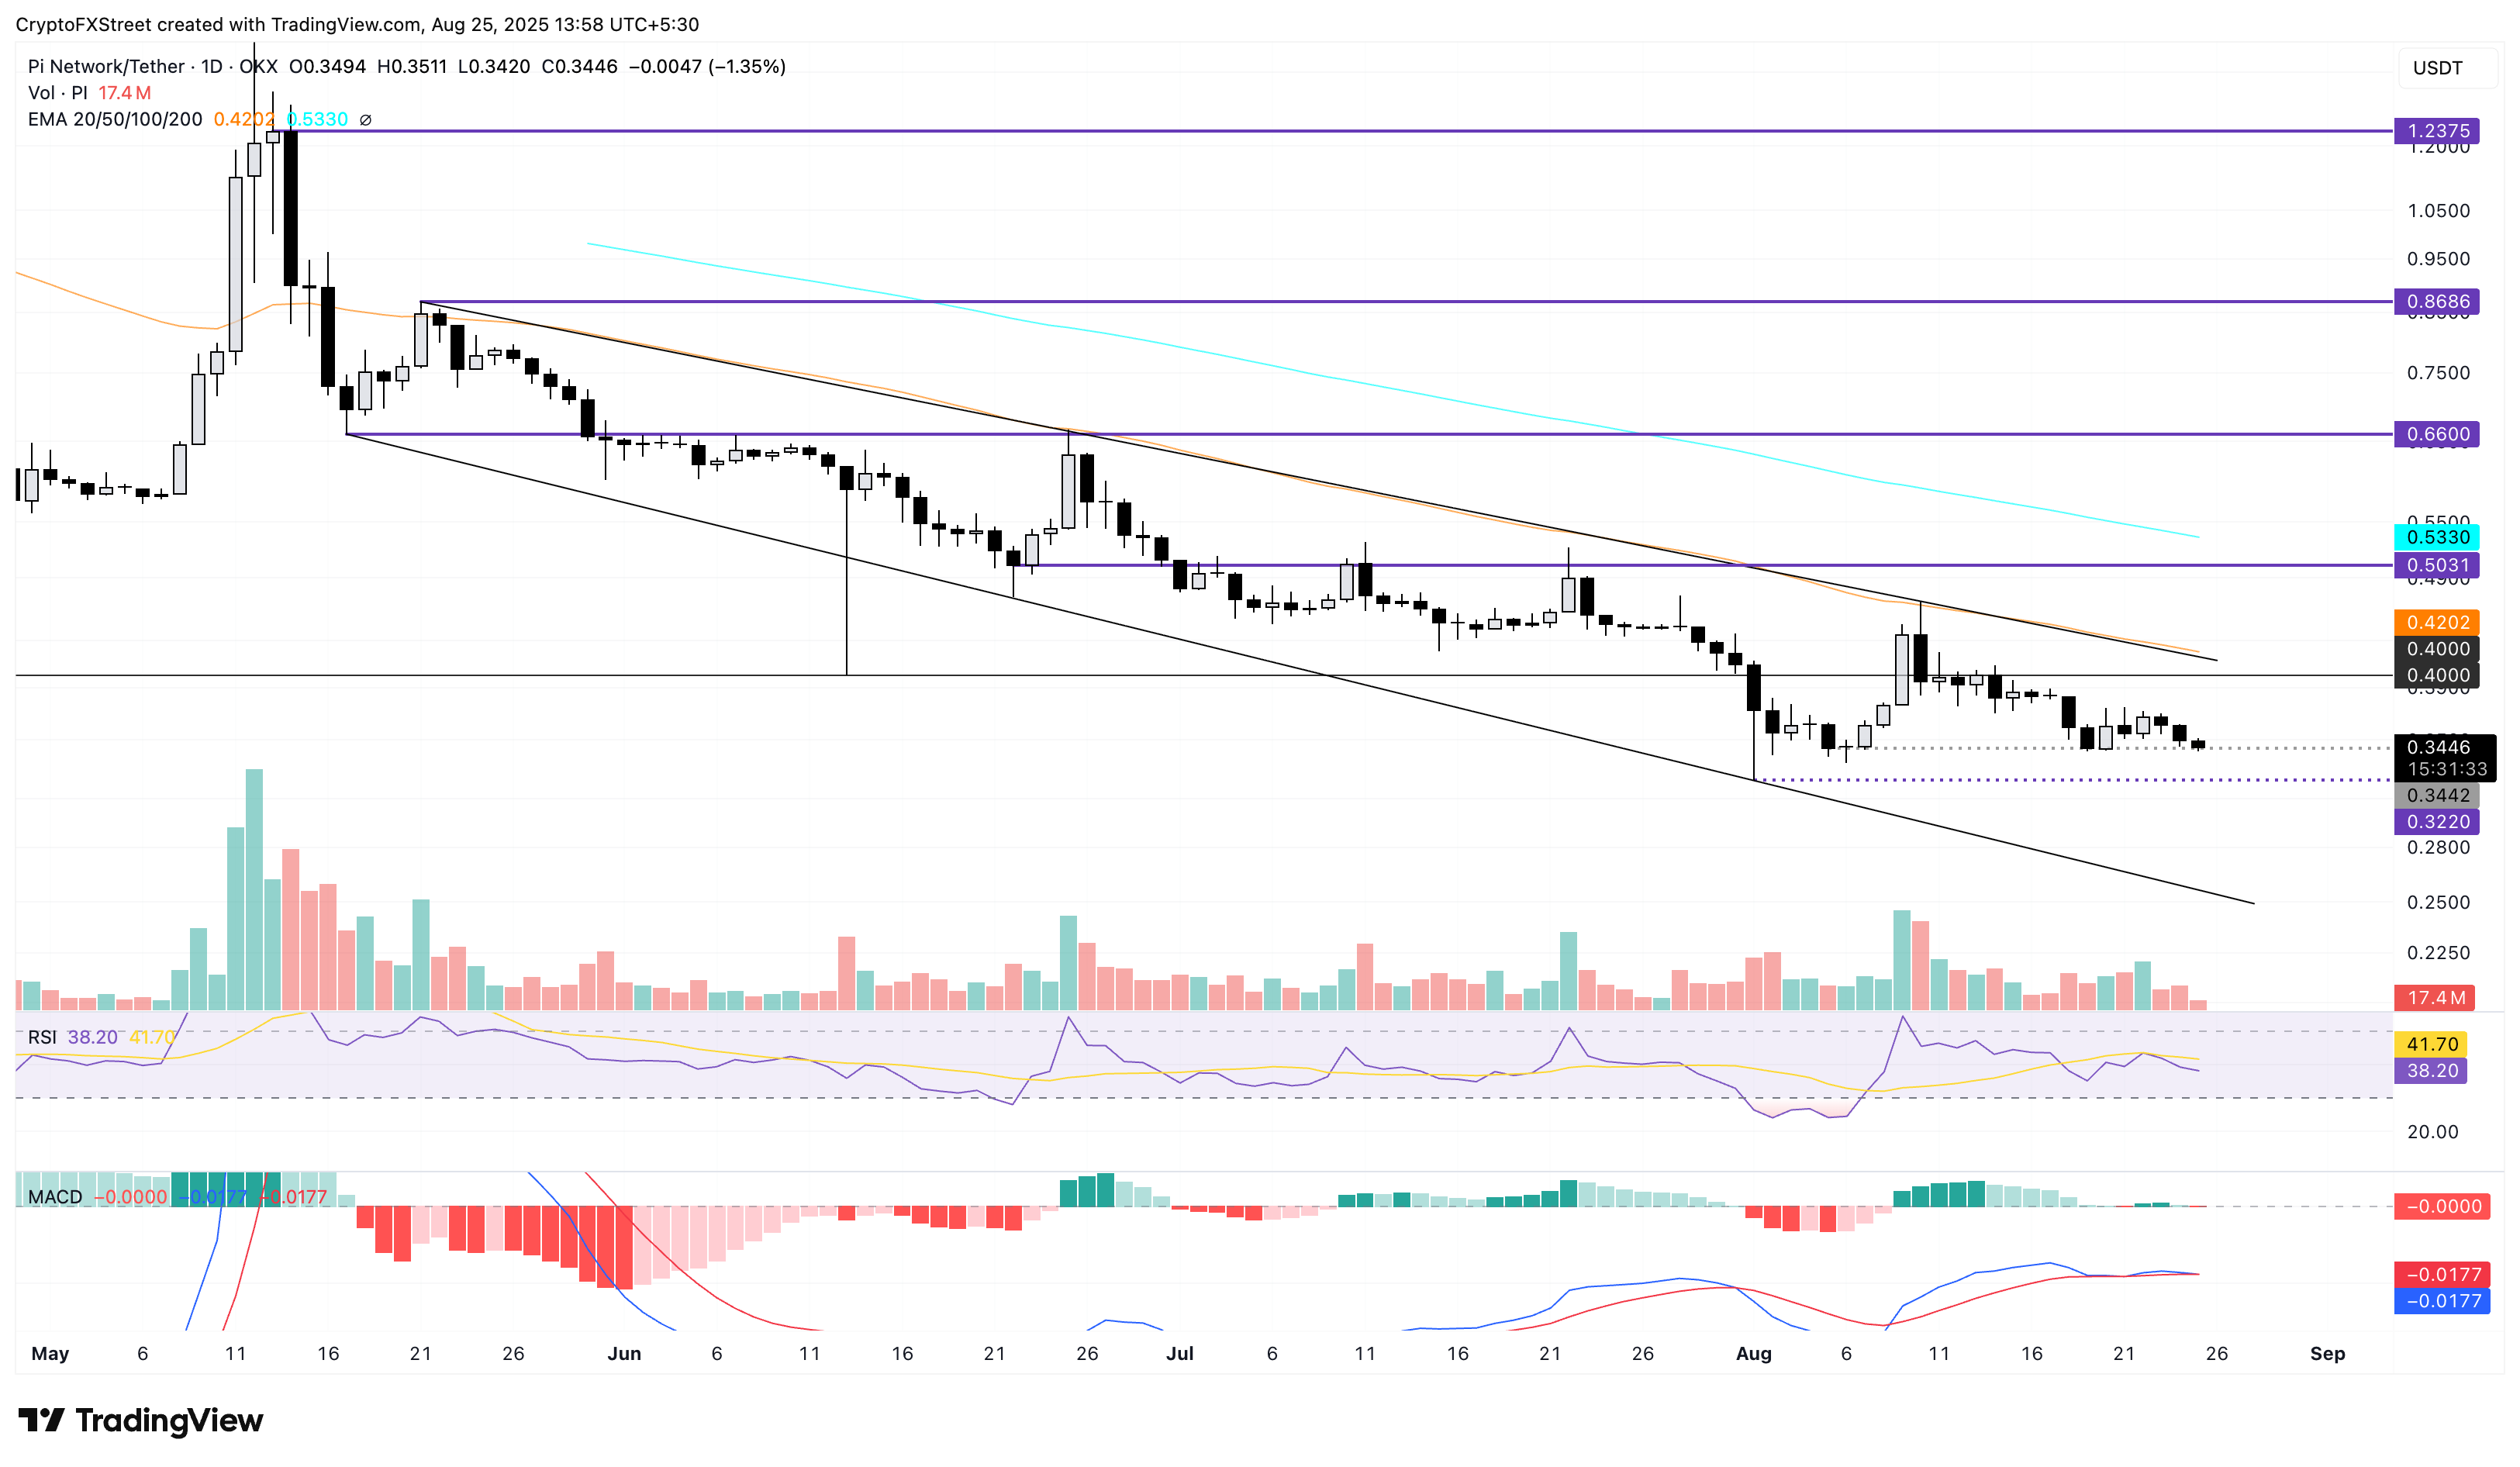
PI/USDT daily price chart.
Looking up, a potential rebound from the $0.3442 support level could retest the 50-day Exponential Moving Average (EMA), which roughly coincides with the downtrend resistance of the falling channel pattern, at $0.4202.
Bitcoin, altcoins, stablecoins FAQs
Bitcoin is the largest cryptocurrency by market capitalization, a virtual currency designed to serve as money. This form of payment cannot be controlled by any one person, group, or entity, which eliminates the need for third-party participation during financial transactions.
Altcoins are any cryptocurrency apart from Bitcoin, but some also regard Ethereum as a non-altcoin because it is from these two cryptocurrencies that forking happens. If this is true, then Litecoin is the first altcoin, forked from the Bitcoin protocol and, therefore, an “improved” version of it.
Stablecoins are cryptocurrencies designed to have a stable price, with their value backed by a reserve of the asset it represents. To achieve this, the value of any one stablecoin is pegged to a commodity or financial instrument, such as the US Dollar (USD), with its supply regulated by an algorithm or demand. The main goal of stablecoins is to provide an on/off-ramp for investors willing to trade and invest in cryptocurrencies. Stablecoins also allow investors to store value since cryptocurrencies, in general, are subject to volatility.
Bitcoin dominance is the ratio of Bitcoin's market capitalization to the total market capitalization of all cryptocurrencies combined. It provides a clear picture of Bitcoin’s interest among investors. A high BTC dominance typically happens before and during a bull run, in which investors resort to investing in relatively stable and high market capitalization cryptocurrency like Bitcoin. A drop in BTC dominance usually means that investors are moving their capital and/or profits to altcoins in a quest for higher returns, which usually triggers an explosion of altcoin rallies.
추천 기사


