
Crypto Today: Bitcoin, Ethereum, XRP under pressure as derivatives data signals risk-off
- Bitcoin drops below the $115,000 level, risking the loss of the 50-day EMA.
- Ethereum descends within a rising channel, with bears targeting the $4,000 psychological level.
- Ripple’s XRP dangles at the $3.00 psychological support amid mounting selling pressure.
A risk-off sentiment prevails in the cryptocurrency market, as Bitcoin (BTC), Ethereum (ETH), and Ripple (XRP) continue their downward trend. The worsening market mood is supported by the surprise increase in the US Producer Price Index (PPI) last week, which surged by 0.9% in July, exceeding the 0.2% forecast.
As inflation increases, a 50 basis point (bps) interest rate cut by the Federal Reserve (Fed) is off the table, while a 25 bps rate reduction in September remains a possibility at 83% as of Tuesday, according to the CME FedWatch tool. As the market sentiments remain down, the top cryptocurrencies retest crucial support levels while downside risk escalates.
Derivatives market signals risk-off
CoinGlass data shows the Open Interest (OI) of the broader cryptocurrency derivatives market is at $201.80 billion, down from $208.30 billion on Monday. The decrease in OI indicates capital outflow as traders cash out, opting to avoid market turbulence.
Adding credence to the thesis that trades are exiting the market, the volumes have surged to $372.07 billion, from $221.40 billion. Typically, the spike in volume with a decline in OI translates to heightened short-covering, or long liquidations in this case.
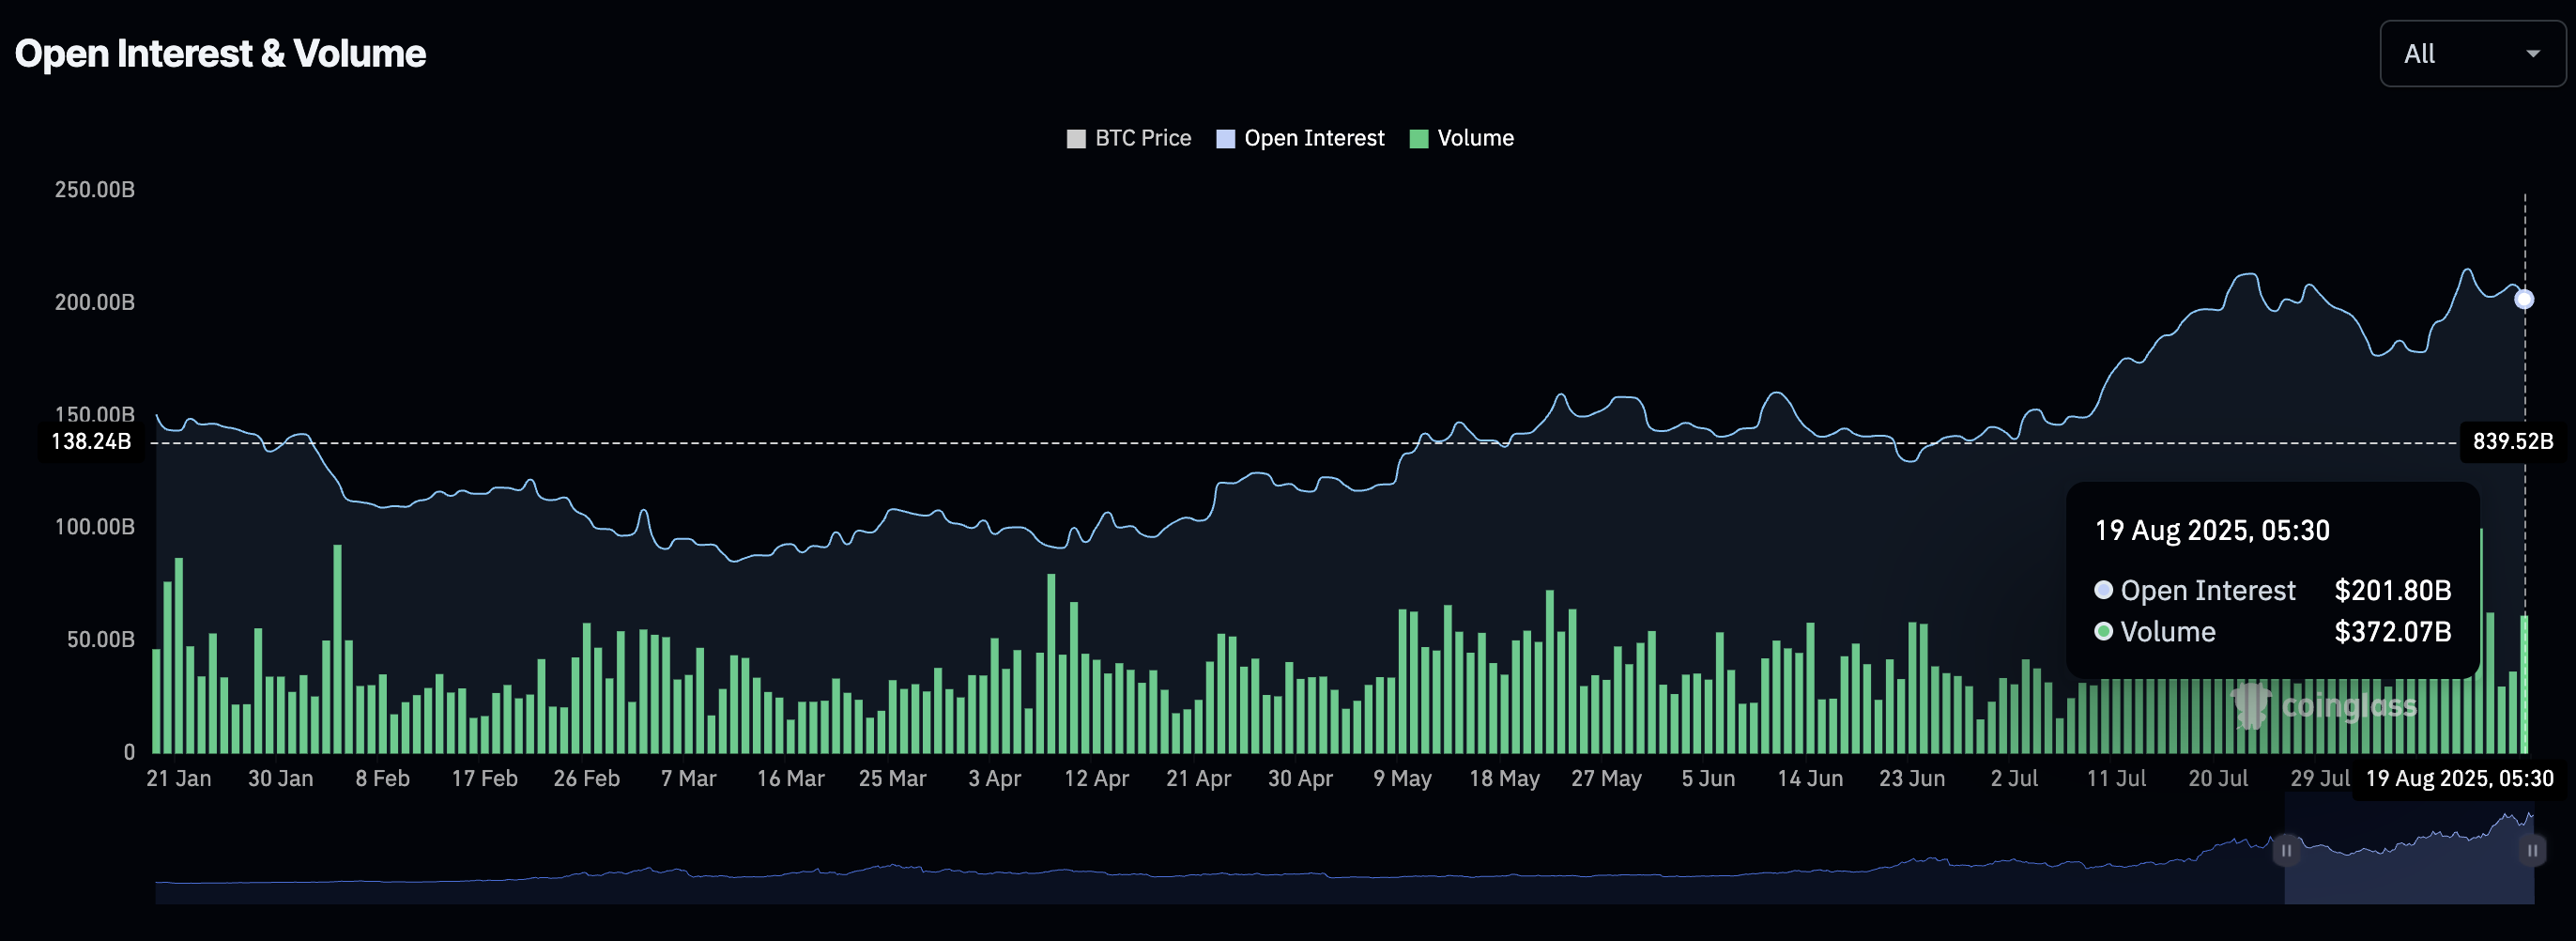
Crypto market Open Interest. Source: Coinglass
The Open Interest of Bitcoin and XRP took a more than 1% hit over the last 24 hours, approaching $81.41 billion and $7.84 billion, respectively. The ETH OI remains relatively stable at $61.07 billion, suggesting heightened confidence among Ethereum traders.
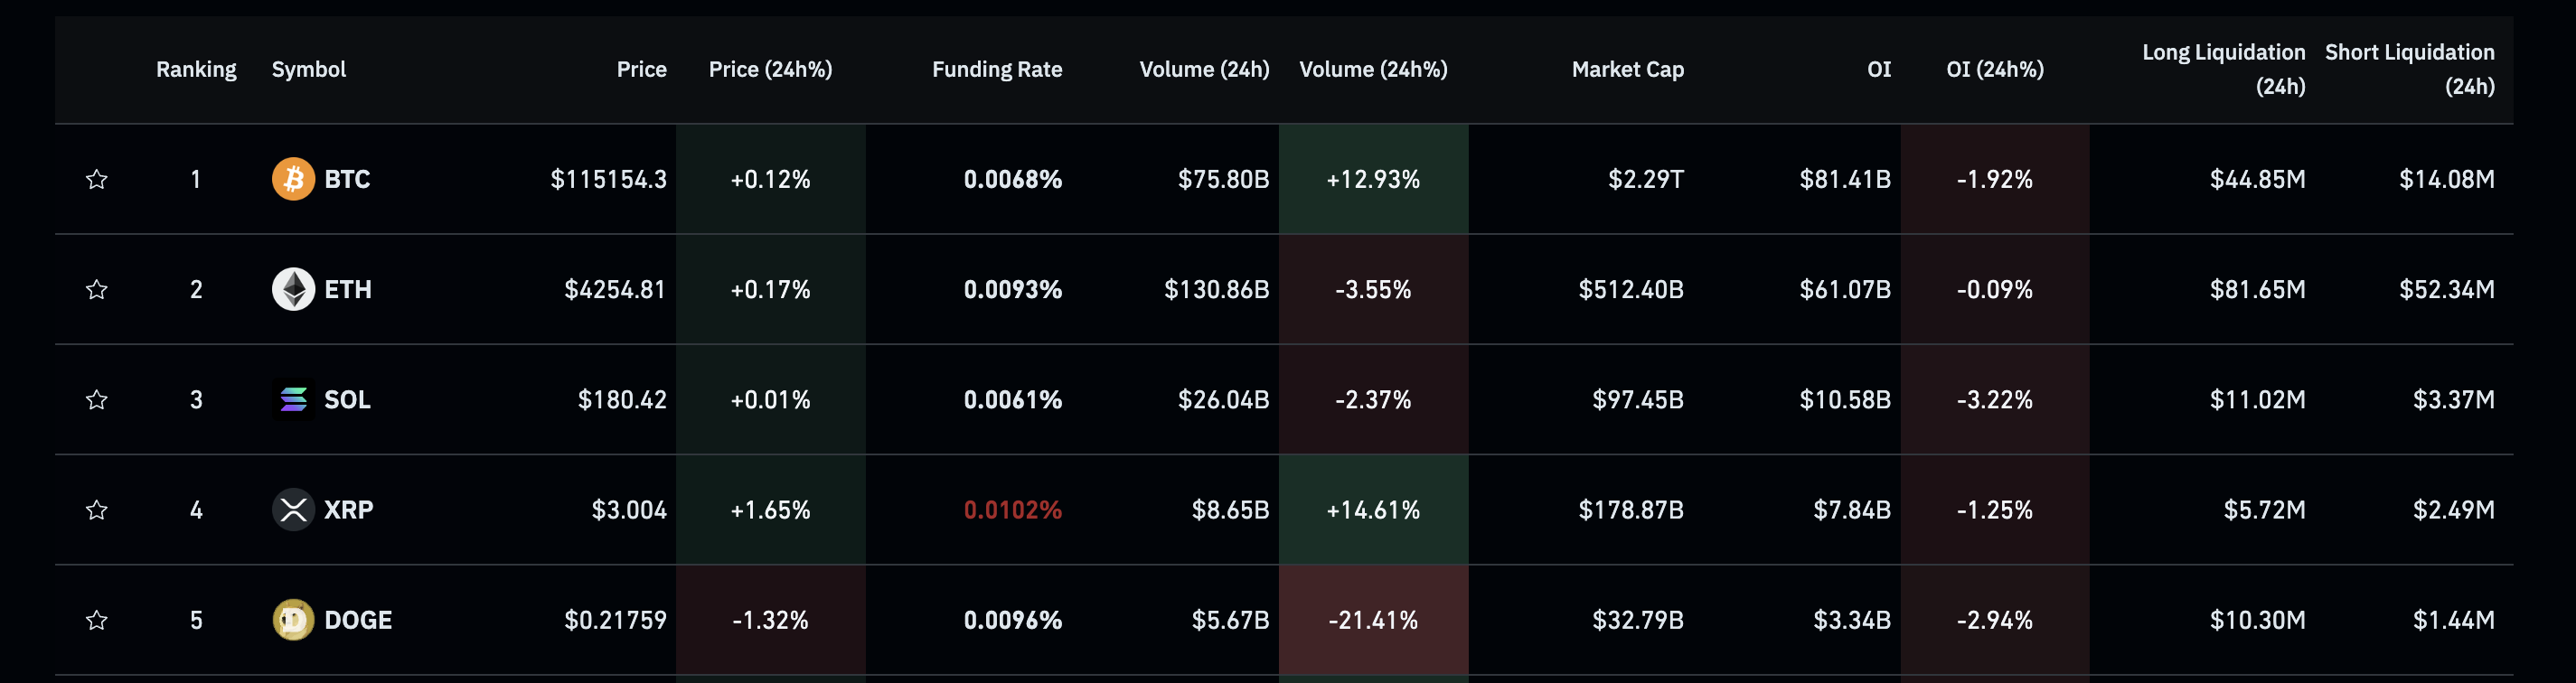
Open Interests. Source: Coinglass
Bitcoin risks losing its 50-day EMA
Bitcoin trades above $115,000 after a minor dip below this psychological level at press time on Tuesday, holding above the 50-day Exponential Moving Average (EMA) at $115,063. A decisive push below this dynamic support could extend the decline to the $111,980 support level, marked by the May 22 high.
The momentum indicators suggest a loss in bullish momentum. On the daily chart, the Relative Strength Index (RSI) at 45 is in a declining slope, indicating an increase in bearish momentum.
Additionally, the Moving Average Convergence Divergence (MACD) and its signal advance a declining trend after a crossover on Saturday. The rising red histogram bars below the zero line also indicate a surge in bearish momentum.
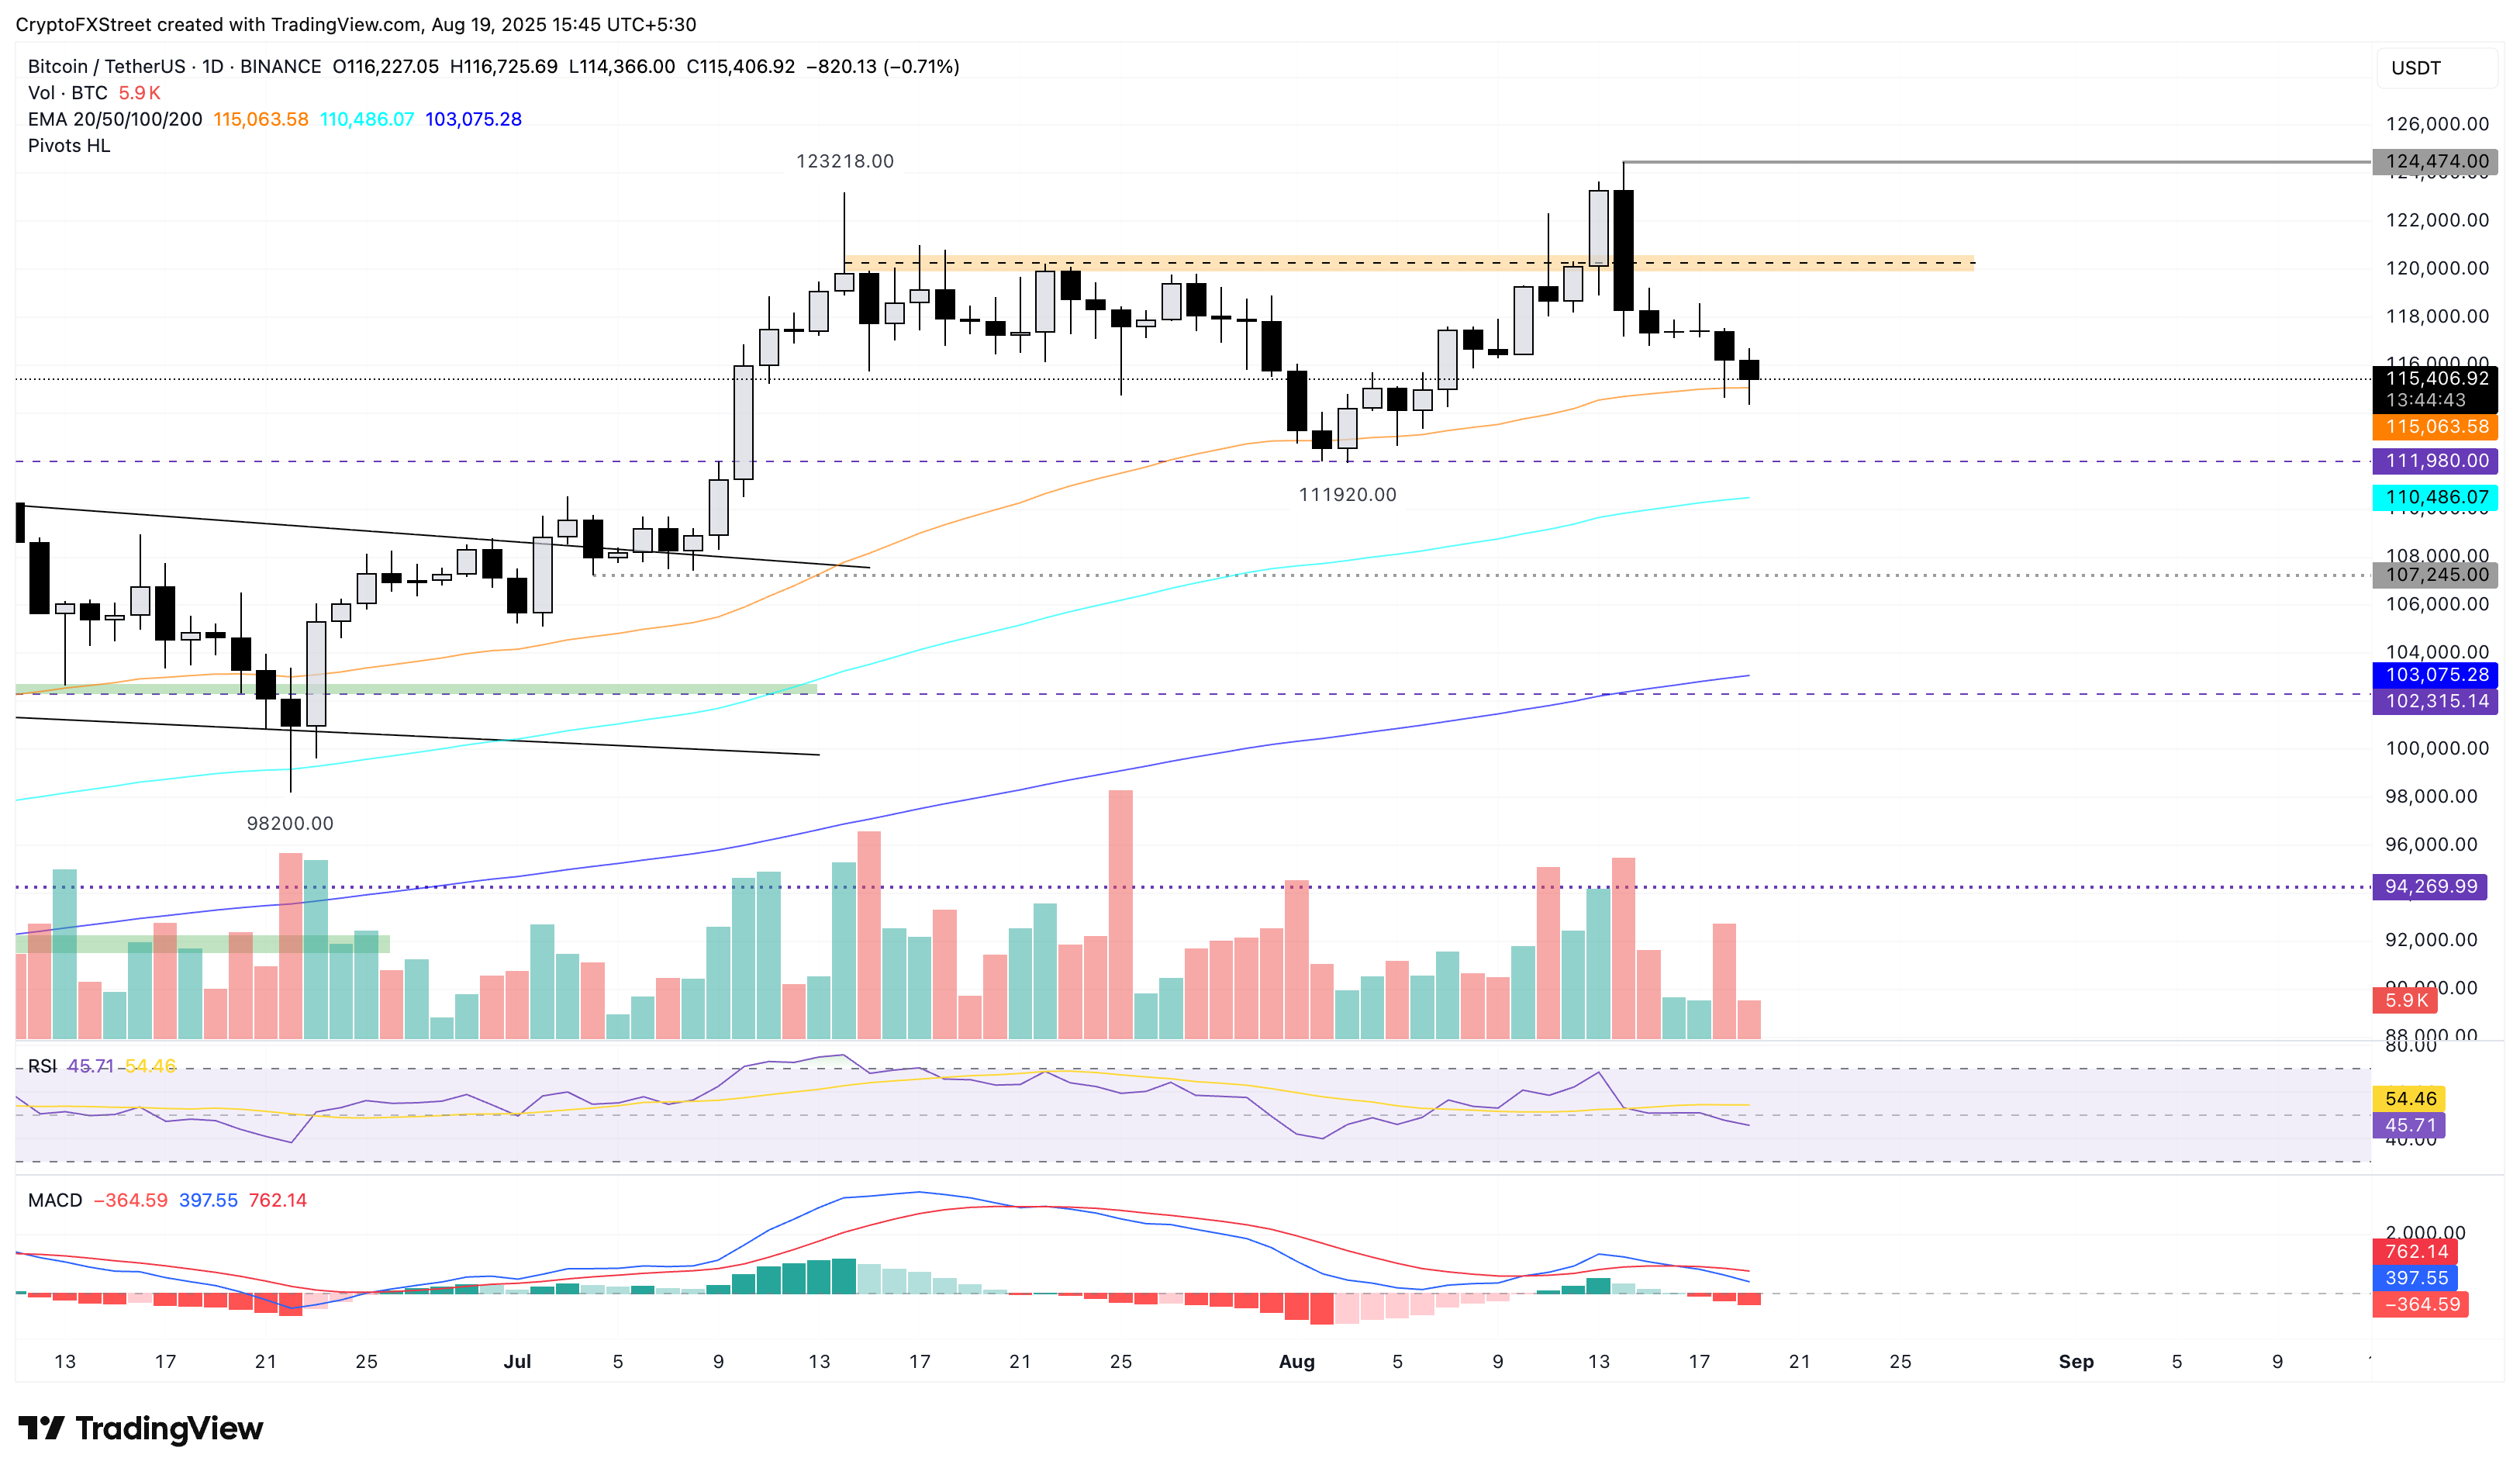
BTC/USDT daily price chart.
On the other hand, a reversal from the 50-day EMA could propel Bitcoin to the $120,000 supply zone.
Ethereum’s free fall in a rising channel
Ethereum declines by over 0.50% at press time on Tuesday, extending the 3.56% fall from the previous day. The declining trend targets a support trendline formed by connecting the lows of June 22 and August 3.
The support trendline completes a rising channel pattern on the daily chart (shared below) and is located near the $4,000 psychological level.
The MACD crosses below its signal line, providing a sell signal to traders and indicating a bearish momentum shift. Additionally, the RSI at 68 edges below the overbought boundary line, indicating a loss in buying pressure.
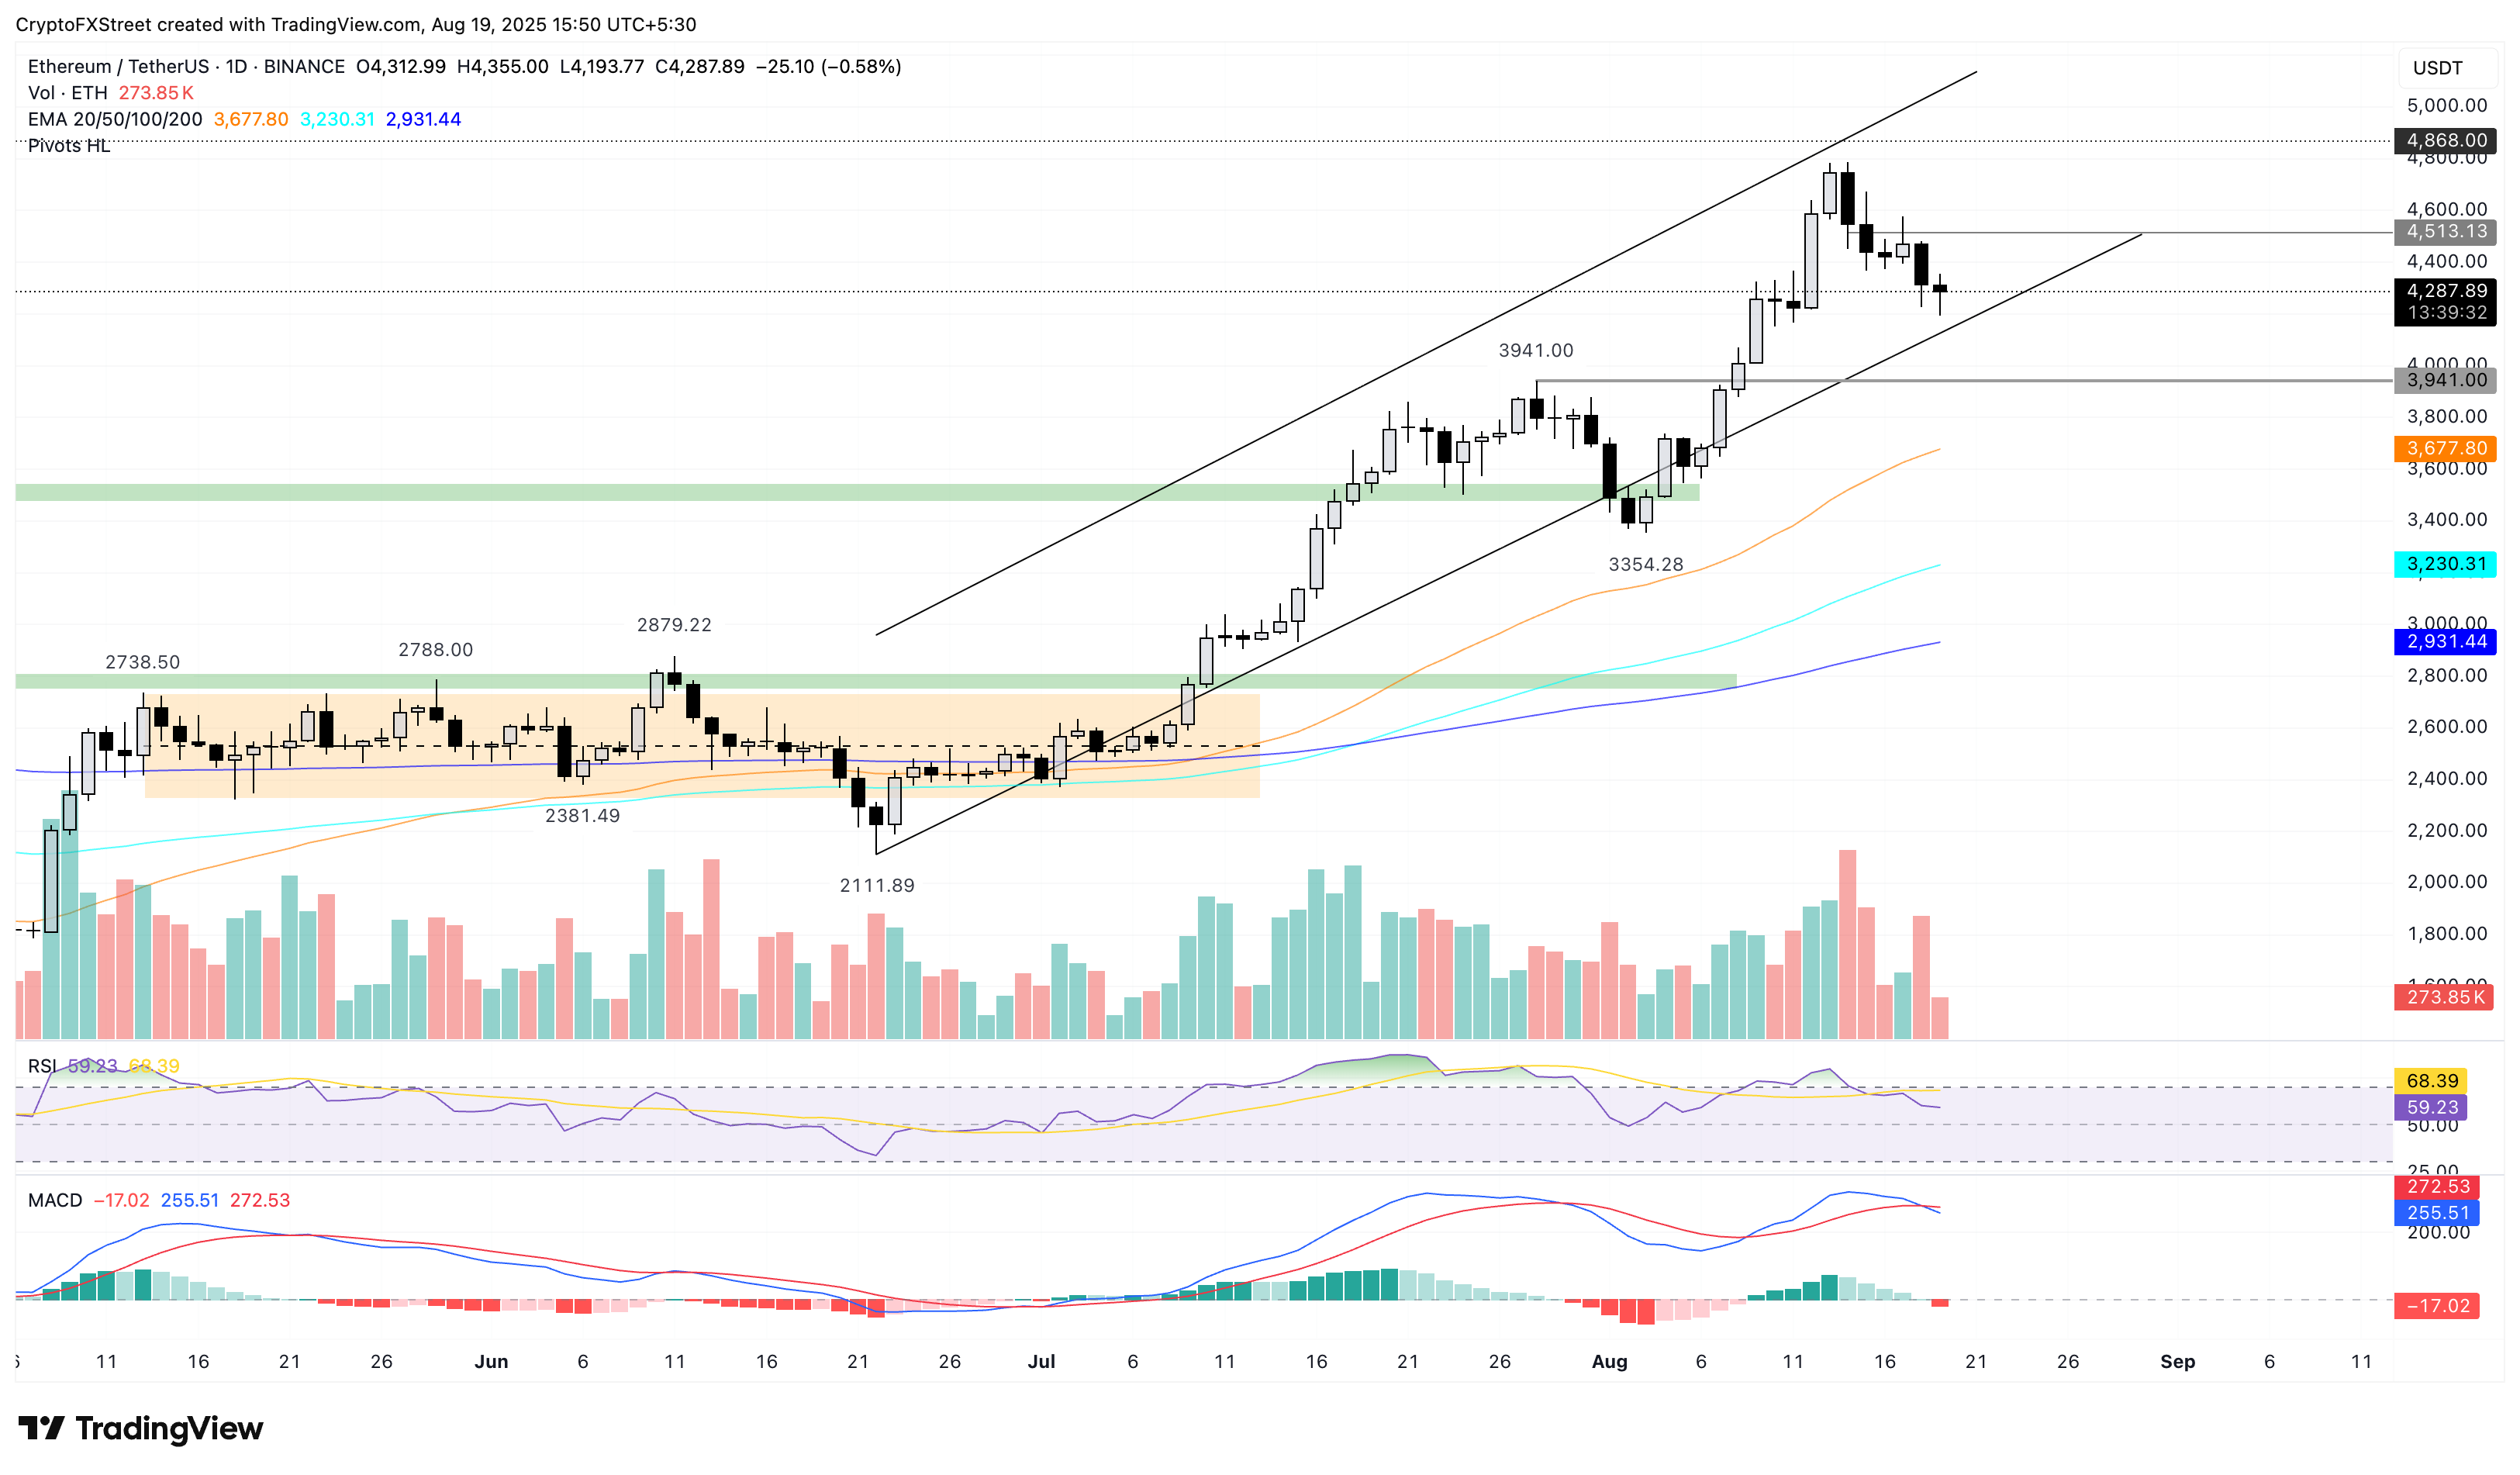
ETH/USDT daily price chart.
On the flip side, Ethereum should reclaim the Monday open at $4,472 to reverse the declining trend.
XRP hits a crucial crossroads
Ripple’s XRP is at a crucial juncture, testing the 50-day EMA, a support trendline connected by June 23 and August 3 lows, and the 38.2% Fibonacci retracement level, which is drawn from the June 22 low of $1.90 and the July 18 peak of $3.66, at $2.99.
A decisive close below the support junction could extend the decline to the 50% retracement level at $2.78, with bears targeting the 100-day EMA at $2.72.
The MACD and its signal line continue to decline, approaching the zero line. A wave of red histogram bars from the same line indicates rising bearish momentum.
The RSI at 46 slopes downward, crossing below the midpoint line. This indicates increasing bearish momentum, with further room for correction.
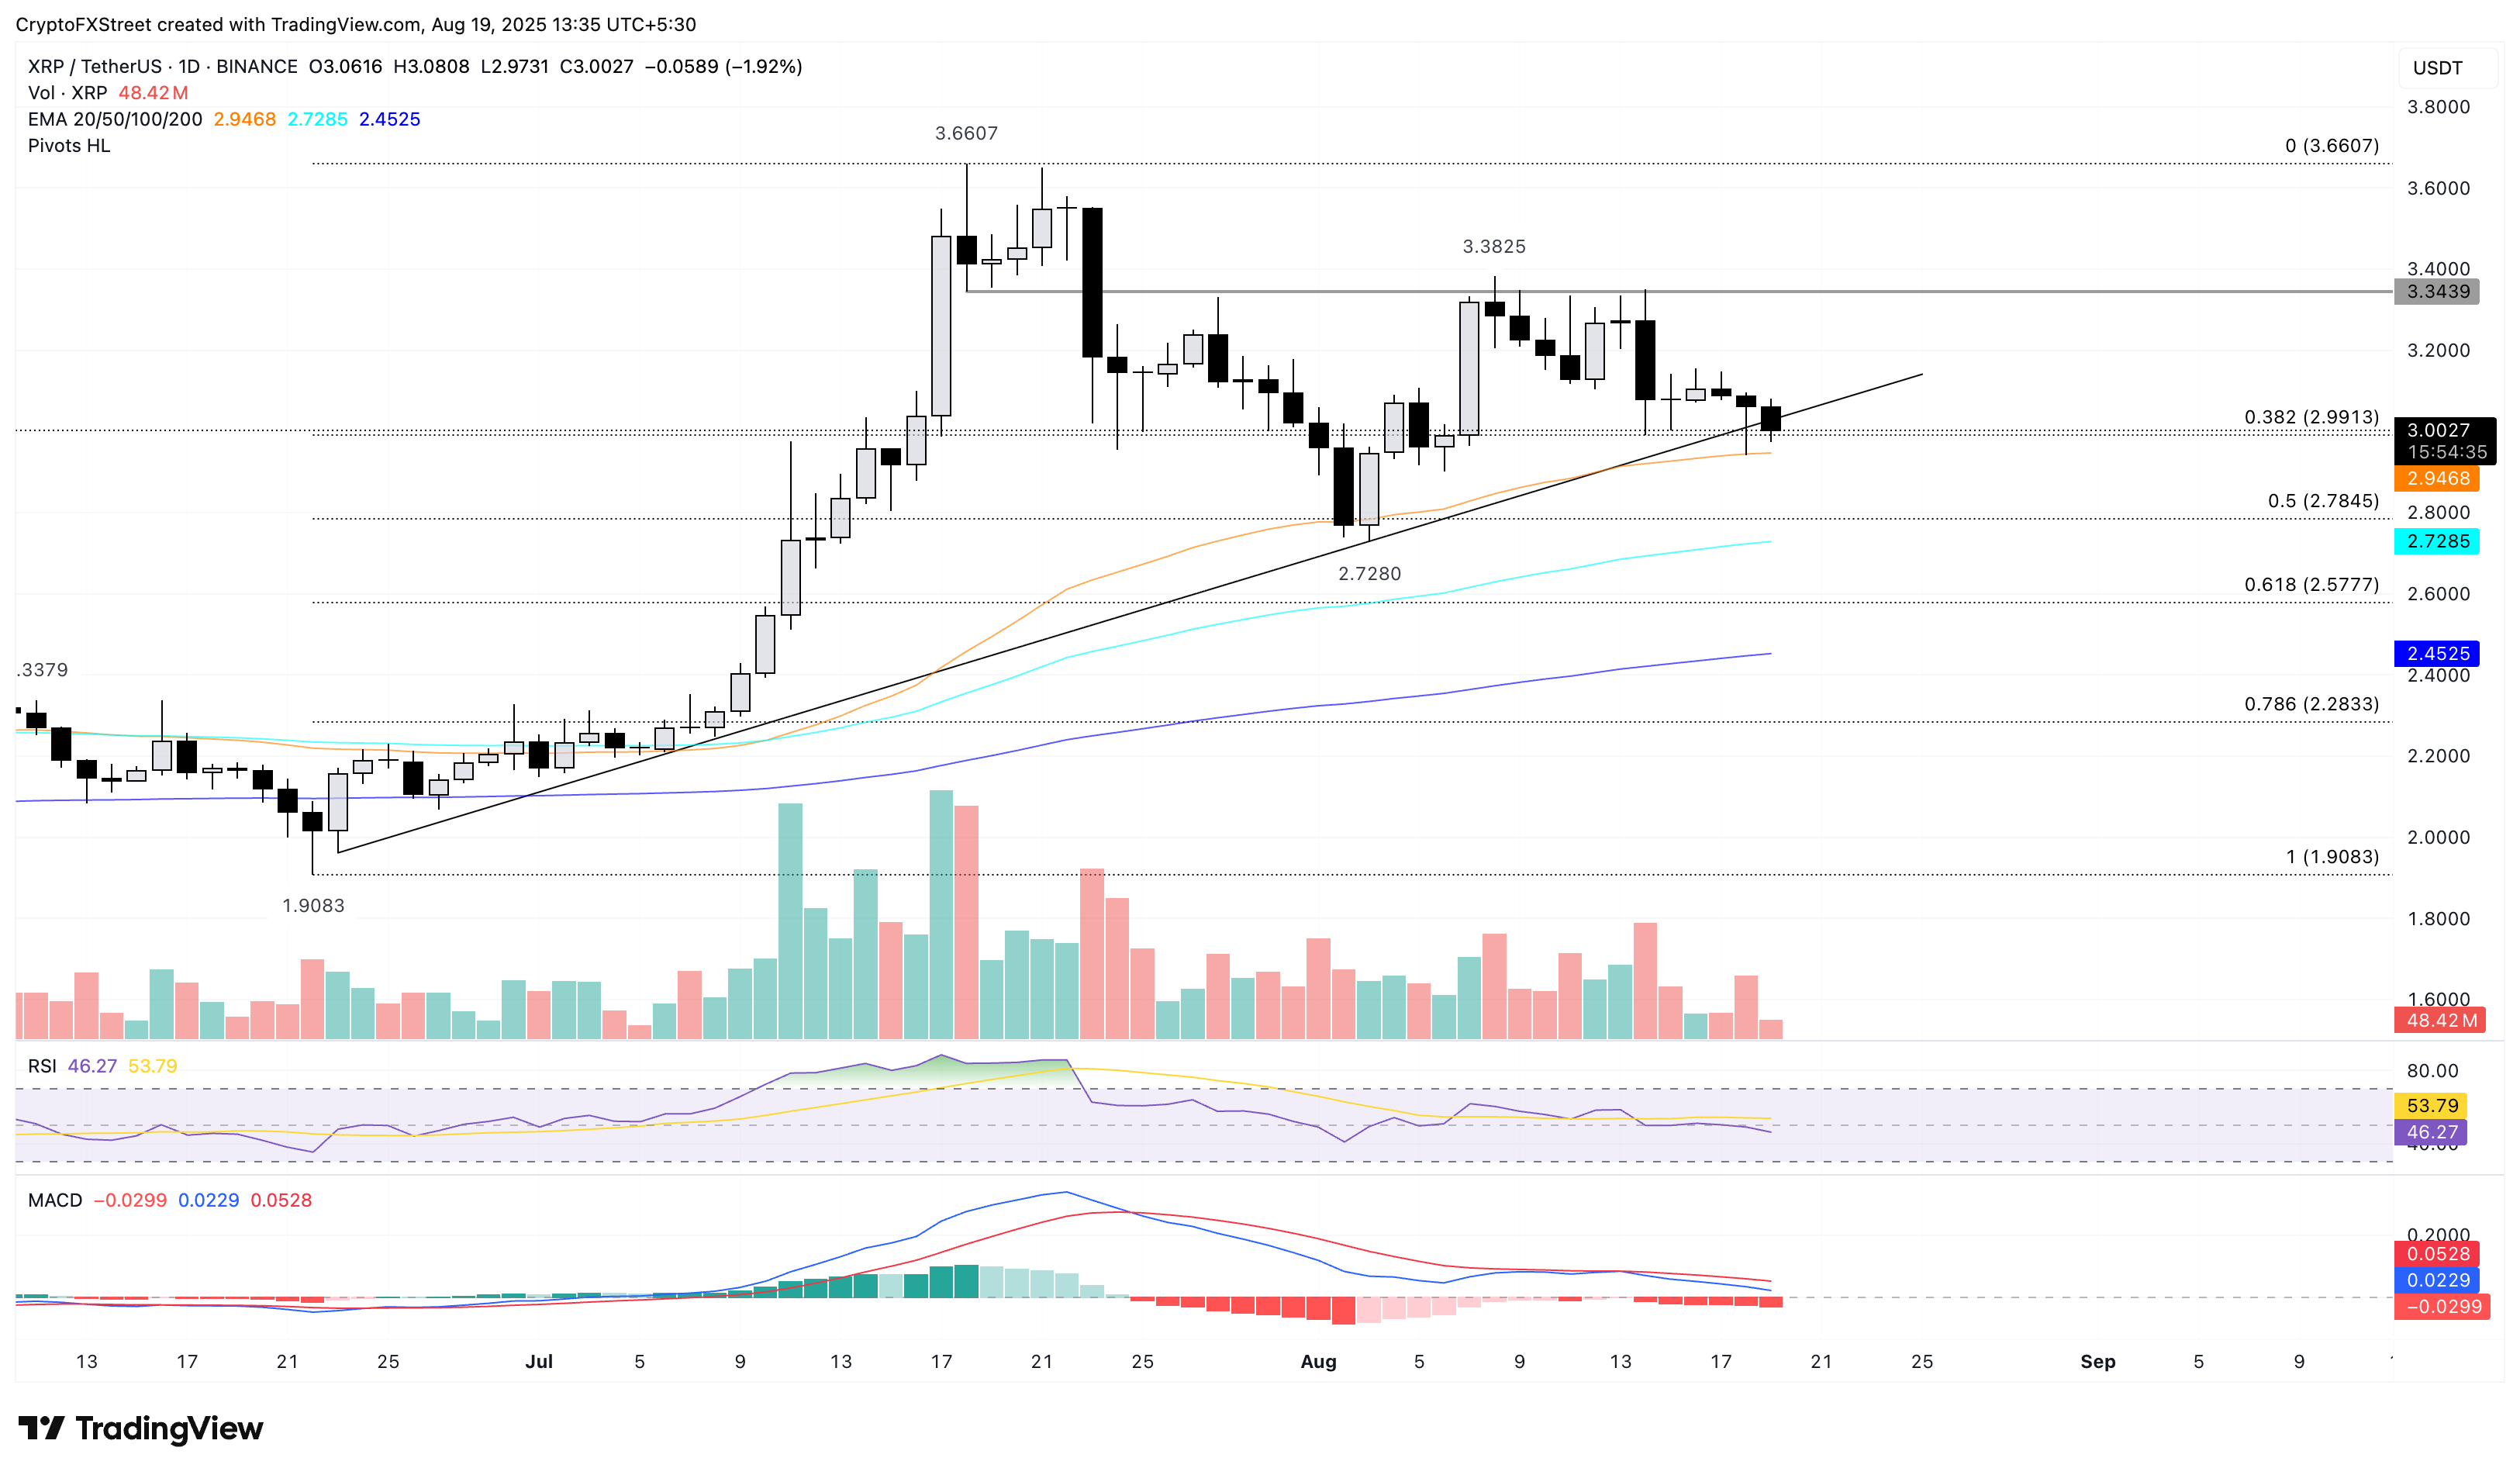
XRP/USDT daily price chart.
Looking up, XRP could bounce back from the support zone to retest the $3.34 resistance, last tested on Thursday.
Bitcoin, altcoins, stablecoins FAQs
Bitcoin is the largest cryptocurrency by market capitalization, a virtual currency designed to serve as money. This form of payment cannot be controlled by any one person, group, or entity, which eliminates the need for third-party participation during financial transactions.
Altcoins are any cryptocurrency apart from Bitcoin, but some also regard Ethereum as a non-altcoin because it is from these two cryptocurrencies that forking happens. If this is true, then Litecoin is the first altcoin, forked from the Bitcoin protocol and, therefore, an “improved” version of it.
Stablecoins are cryptocurrencies designed to have a stable price, with their value backed by a reserve of the asset it represents. To achieve this, the value of any one stablecoin is pegged to a commodity or financial instrument, such as the US Dollar (USD), with its supply regulated by an algorithm or demand. The main goal of stablecoins is to provide an on/off-ramp for investors willing to trade and invest in cryptocurrencies. Stablecoins also allow investors to store value since cryptocurrencies, in general, are subject to volatility.
Bitcoin dominance is the ratio of Bitcoin's market capitalization to the total market capitalization of all cryptocurrencies combined. It provides a clear picture of Bitcoin’s interest among investors. A high BTC dominance typically happens before and during a bull run, in which investors resort to investing in relatively stable and high market capitalization cryptocurrency like Bitcoin. A drop in BTC dominance usually means that investors are moving their capital and/or profits to altcoins in a quest for higher returns, which usually triggers an explosion of altcoin rallies.
추천 기사


