

Crude Oil finds support as market focus shifts back to supply
- Crude Oil consolidates after a downbeat Tuesday with more than 4% losses.
- Markets are assessing the situation in the Middle East, and President Biden is set to speak to Israel’s Prime Minister Netanyahu.
- The US Dollar Index swings up and recovers initial weekly losses.
Crude Oil finds some support and stabilzes on Wednesday after over 4% correction the previous day when Israel refrained from responding firmly to the recent attacks from Iran. Israel has been halted by United States (US) President Joe Biden, who asked not to attack Iranian oil fields and vital infrastructure. With a call between US President Biden and Israel’s Prime Minister Benjamin Netanyahu later this Wednesday, a risk for a large strike is still a present danger that could get priced in very quickly.
The US Dollar Index (DXY), which tracks the performance of the Greenback against six other currencies, is recovering its earlier poor performance from the beginning of this week. On Wednesday, markets await the publication of the September meeting's Federal Open Market Committee (FOMC) Minutes, as traders will be able to get more information on the main drivers for the big 50 basis points rate cut and what this could mean going forward.
At the time of writing, Crude Oil (WTI) trades at $73.40 and Brent Crude at $77.36
Oil news and market movers: Supply is healthy despite tensions
- The American Petroleum Institute (API) reported a build of 10.9 million barrels on the week ending October 4, compared to the smaller 1.95 million barrels expected and following the drawdown of 1.5 million barrels the previous week.
- At 14:30 GMT, the Energy Information Administration (EIA) will release the Crude Oil stockpile change for the week ending October 4. Expectations are for a small build of 2.0 million barrels compared to the build of 3.889 million barrels the previous week.
- Angola Oil exports are set to pick up, with the company stepping up efforts to increase output from existing developments, Equinor reports. The company exports around 175,000 barrels per day, Bloomberg reports.
- Pemex stated that it shut down oil platforms and crude-exporting terminals in the Gulf of Mexico due to Hurricane Milton. The storm is approaching Florida’s west coast on Wednesday, where flooding and high winds are expected to inflict widespread damage and put lives at risk, Bloomberg reports.
Oil Technical Analysis: Wash out for bulls
Crude Oil price has been purified from opportunistic traders that have been piling into the price action with bets on a further escalation in the Middle East. Several stop losses from traders have been filled, and some consolidation might be seen in the coming days. Expect some easing and sideways movement, with support being tested around $72.60.
Monday’s false break is to be ignored, as the move was fully paired back on Tuesday. It means that current pivotal levels on the upside are still valid: the red descending trendline in the chart below, and the 100-day Simple Moving Average (SMA) at $75.67 just hovering above it, makes that region very difficult to surpass. Once holding above there, the 200-day SMA at $77.16 should refute any further upticks as it did in early trading on Tuesday.
On the downside, old resistances have turned into supports. First is the 55-day SMA at $72.62, which acts as a potential first line of defence in case of any retreat. A bit further down, $71.46 (the February 5 low) comes into play as second support before looking back to the $70.00 big figure and $67.11 as ultimate support for traders to buy the dip.
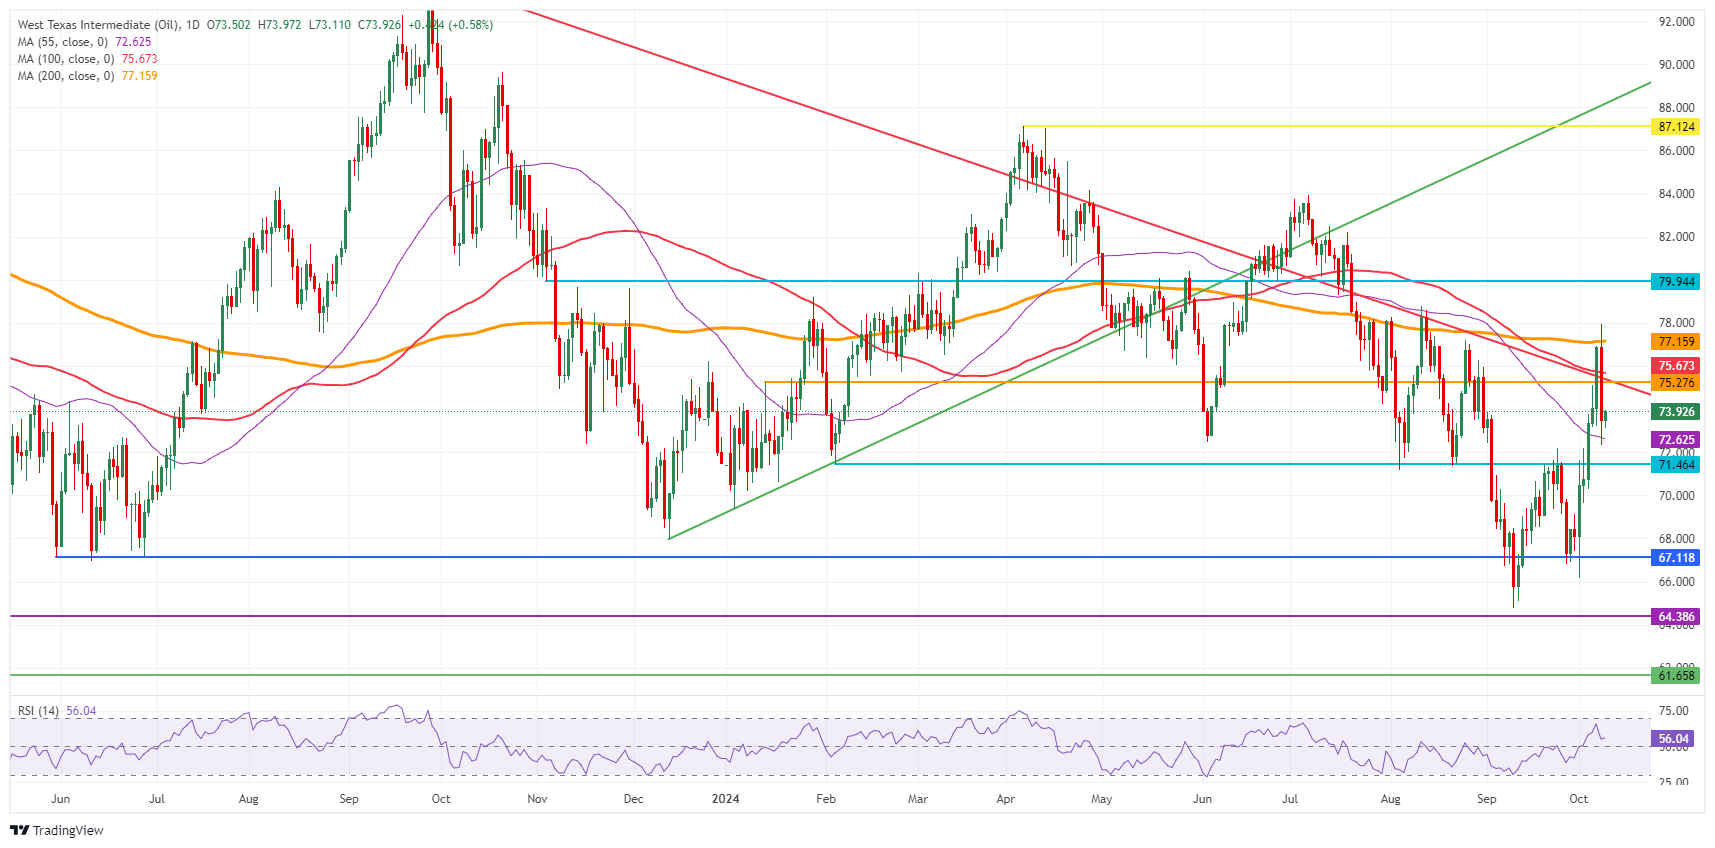
US WTI Crude Oil: Daily Chart
WTI Oil FAQs
WTI Oil is a type of Crude Oil sold on international markets. The WTI stands for West Texas Intermediate, one of three major types including Brent and Dubai Crude. WTI is also referred to as “light” and “sweet” because of its relatively low gravity and sulfur content respectively. It is considered a high quality Oil that is easily refined. It is sourced in the United States and distributed via the Cushing hub, which is considered “The Pipeline Crossroads of the World”. It is a benchmark for the Oil market and WTI price is frequently quoted in the media.
Like all assets, supply and demand are the key drivers of WTI Oil price. As such, global growth can be a driver of increased demand and vice versa for weak global growth. Political instability, wars, and sanctions can disrupt supply and impact prices. The decisions of OPEC, a group of major Oil-producing countries, is another key driver of price. The value of the US Dollar influences the price of WTI Crude Oil, since Oil is predominantly traded in US Dollars, thus a weaker US Dollar can make Oil more affordable and vice versa.
The weekly Oil inventory reports published by the American Petroleum Institute (API) and the Energy Information Agency (EIA) impact the price of WTI Oil. Changes in inventories reflect fluctuating supply and demand. If the data shows a drop in inventories it can indicate increased demand, pushing up Oil price. Higher inventories can reflect increased supply, pushing down prices. API’s report is published every Tuesday and EIA’s the day after. Their results are usually similar, falling within 1% of each other 75% of the time. The EIA data is considered more reliable, since it is a government agency.
OPEC (Organization of the Petroleum Exporting Countries) is a group of 12 Oil-producing nations who collectively decide production quotas for member countries at twice-yearly meetings. Their decisions often impact WTI Oil prices. When OPEC decides to lower quotas, it can tighten supply, pushing up Oil prices. When OPEC increases production, it has the opposite effect. OPEC+ refers to an expanded group that includes ten extra non-OPEC members, the most notable of which is Russia.
추천 기사


