


The world has enough Crude Oil and not enough diesel
- WTI Crude Oil trades just under $91.00, up 1.6%, at seven-week highs.
- Hormuz tanker traffic has fallen to its lowest rate since May.
- Distillate stocks sit 14% below their five-year average and Crude Oil 1% above.
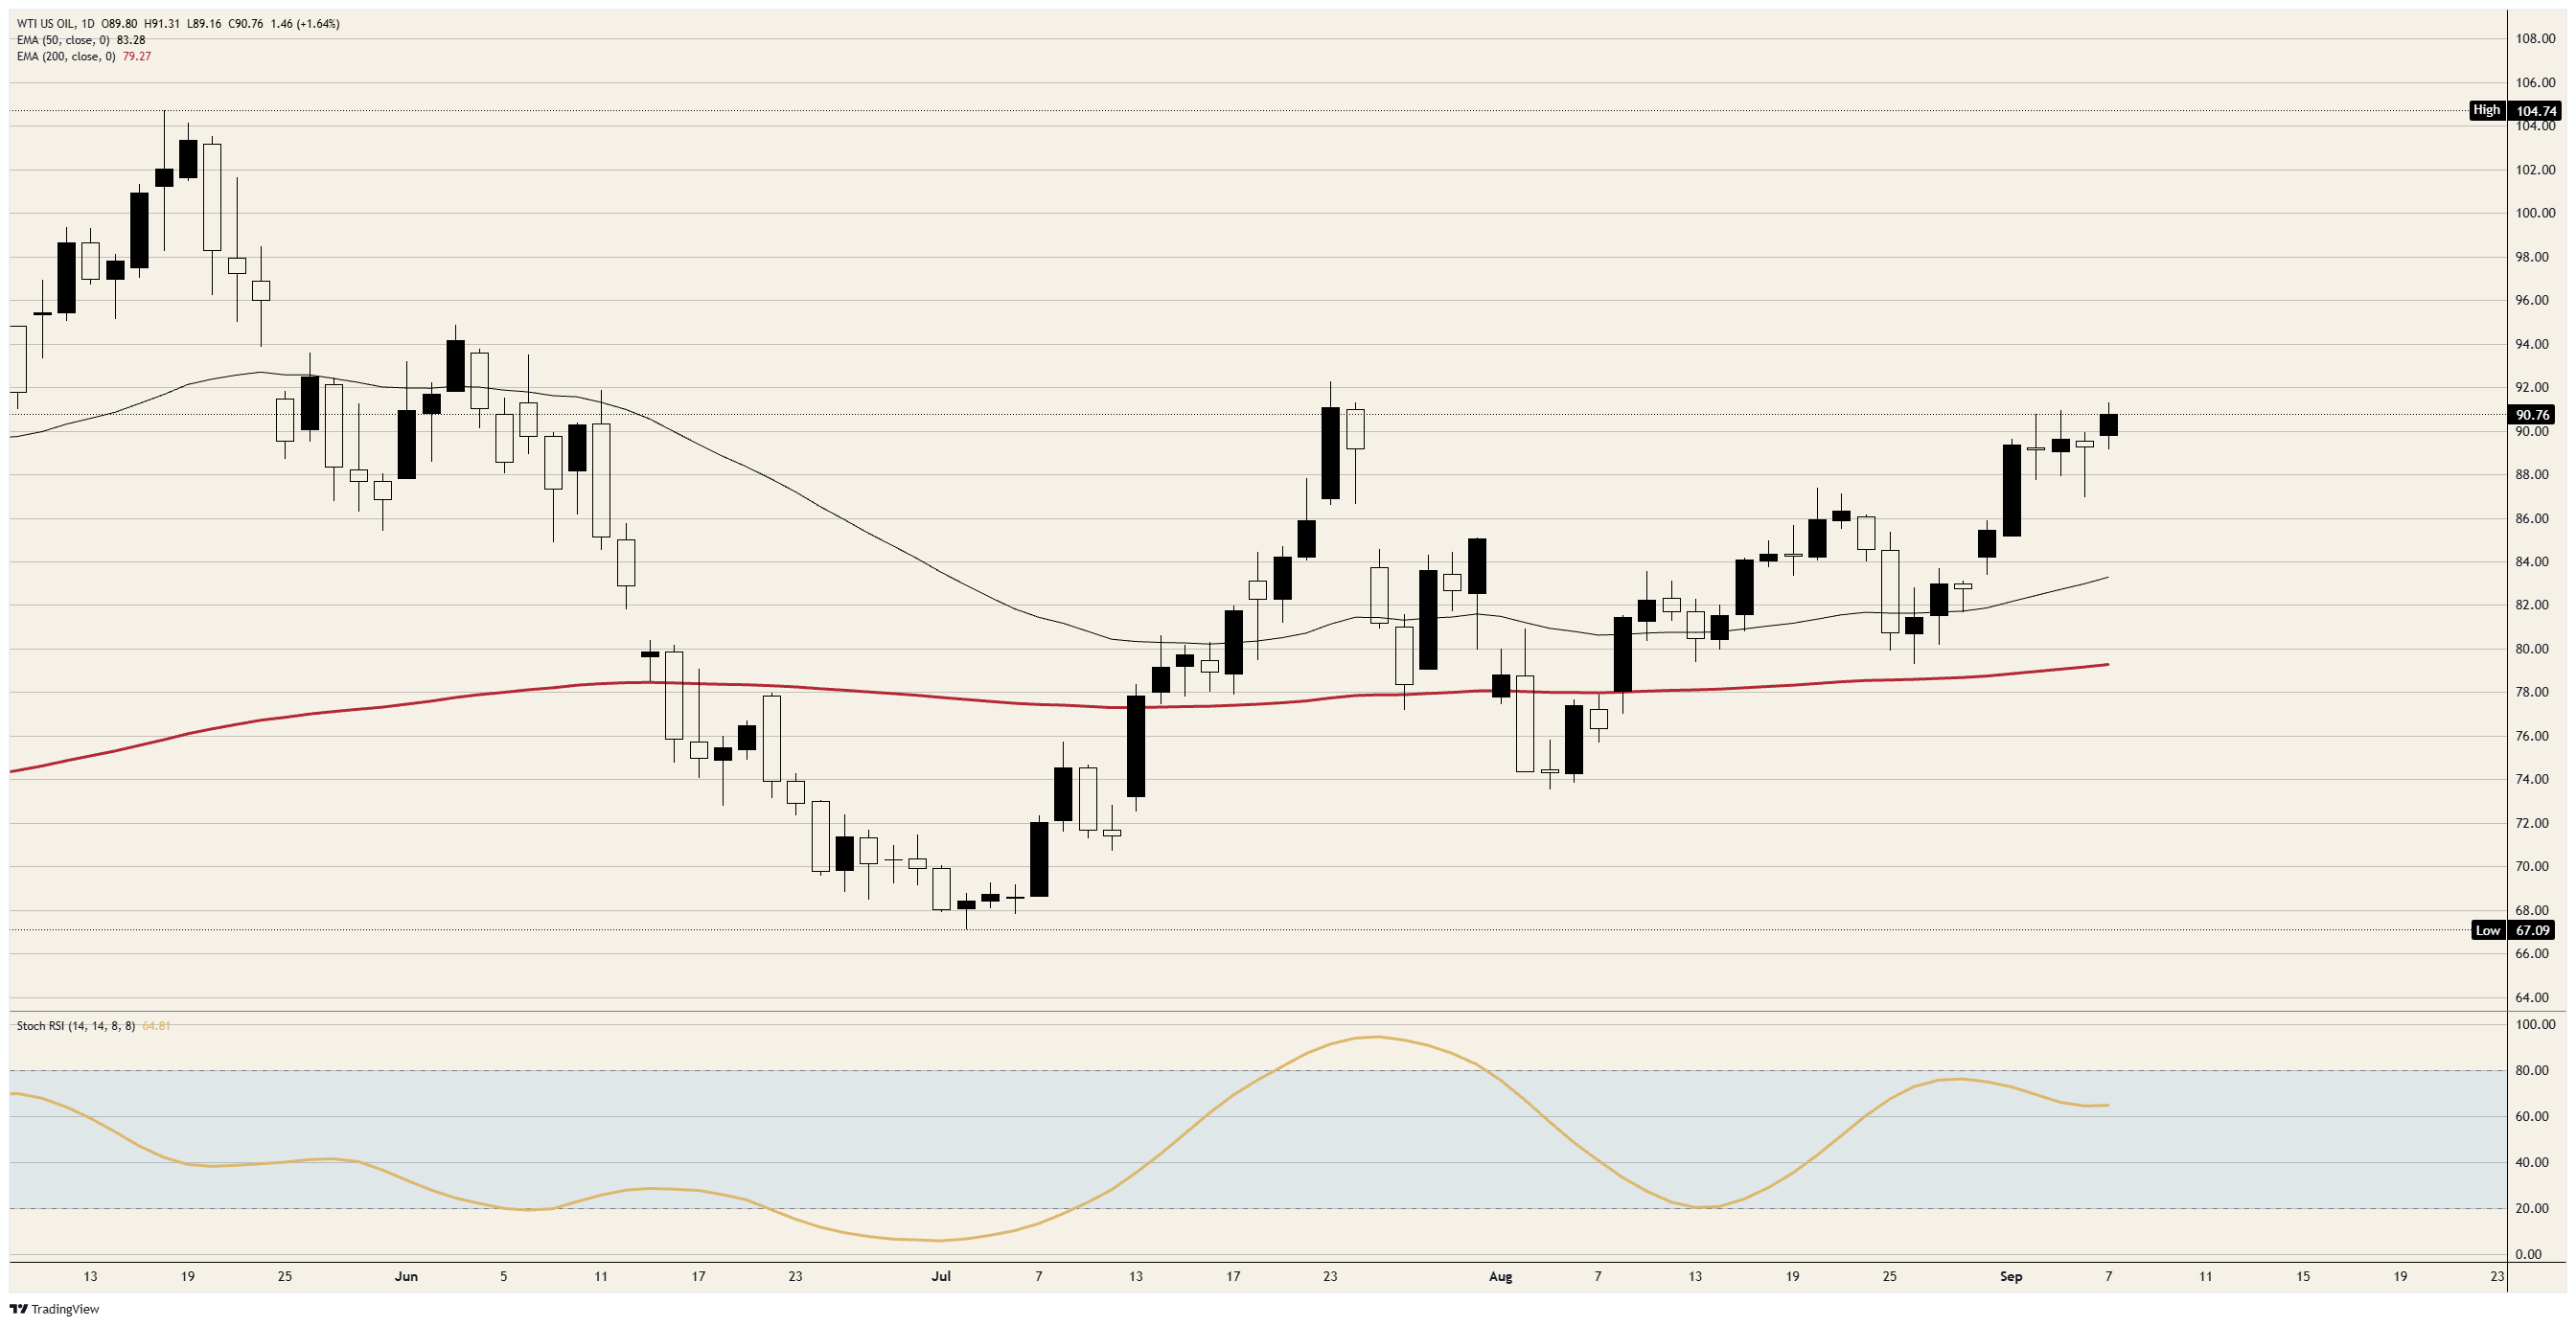
Crude Oil trades just under $91.00 after adding 1.6% on Monday. The grind has run roughly $10 from the $81.00 area in nine sessions, and not a barrel has stopped being produced in any of them. The rally is about where barrels can go and what can be done with them once they arrive, and only one of those two problems is in the headlines.
Nothing has stopped being pumped
American forces struck Iranian vessels over the weekend, and Tehran is preparing to declare a restricted shipping zone in the Gulf along with maps for a corridor of its own design through the Strait of Hormuz. It has said a deal with Oman to manage passage is close, and warned that ships face attack near the Omani coast. The strait has been a live front since the war opened on February 28.
An average of roughly 10 commodity vessels a day crossed the strait in the latest 10-day period, the lowest rate since May. That is a transit number rather than a production number, and the market is not pricing barrels already lost so much as the possibility that more could be. Tehran's stated condition for keeping the water open is that the country attacking it stops first.
The barrels are there and the plants are not
United States commercial Crude Oil inventories sit about 1% above their five-year average. Distillate stocks, which cover diesel and heating fuel, sit about 14% below theirs, and the week to August 21 took them to the lowest seasonal level in the Energy Information Administration (EIA) record and the lowest for any August since 1951. Gasoline comes out of the same refineries from the same barrels and is 17% below its own record.
The New York Harbor diesel crack against the barrel reached roughly $107 on September 1, against something in the $60s and low $70s during the record week of June 2022. Retail diesel printed an all-time high of $5.85 a gallon on September 4. The barrel is cheaper than it was in 2022 and the fuel is dearer, which is what a refining shortage looks like rather than a supply one.
Last week's inventory report cut across both stories. Crude Oil stocks drew 4.45 million barrels in the week to August 28, the first fall in five weeks and four times the expected draw, while distillates built 0.796 million against forecasts for a 1.3 million drop, their first build in five weeks.
OPEC+ paused the wrong tap
OPEC+ spent the weekend leaving October output unchanged after six consecutive months of increases, with members still working toward new quotas. The group had spent those six months unwinding cuts into a market that still had a buffer to absorb the barrels. Withdrawing the one reliable source of new supply while a risk premium builds has an obvious price consequence, and the barrel moved on it.
It matters less than it looks. The spare capacity the group holds sits mostly inside the Gulf, so the barrels it declined to add would have had to leave through the strait that is the problem. A barrel shortage is answered by pumping, and a refining shortage is answered by plants that take years to permit and build. OPEC+ can only turn the tap that is already open.
The rally is feeding the print that could cap it
The Producer Price Index (PPI) lands Thursday at 12:30 GMT with the headline seen at 0.4% on the month after a flat July and 5.3% YoY after 4.7%, which is energy pass-through already sitting in the producer number. The Consumer Price Index (CPI) follows Friday at 12:30 GMT, seen at 0.4% on the month after 0.1% with the annual rate steady at 3.4%.
Record diesel at the pump goes into that print. The Dollar Index sits at two-week lows on Monday, which is part of why the barrel has had an easy run, and Friday's number decides a Federal Reserve meeting on September 15-16 where a quarter point is priced near 58%. A Fed that hikes lifts the Dollar the barrel is quoted in. The chokepoint rally is feeding the data that could take a piece of it back, on a schedule published weeks ago.
Levels and bias
Resistance: Monday's high stopped short of $91.50, and the $92.00 area is the late-July peak that caps the whole advance. A daily close above it opens the $93.00 and $94.00 shelf from early June, with the May highs just below $105.00 the extreme beyond that.
Support: The $89.00 handle held on Monday with the session low a shade above it, and Friday's low just under $87.00 is the first real floor beneath. Under that the move has no tested structure until the $85.00 area. The 50-day Exponential Moving Average (EMA) just above $83.00 sits some $7.50 beneath the price, which is how extended this run has become, and the 200-day EMA near $79.00 is not in play.
Bias: Bullish while $89.00 holds, with the $92.00 area the objective. The daily Stochastic Relative Strength Index (Stoch RSI) sits near 65 and has not reached overbought through a $10 advance, which is the reading a grind produces rather than a squeeze, and the intraday measure near 14 has already worked off Monday's push. The invalidation is a daily close beneath $87.00, which puts the move back under Friday's low. Any credible improvement in Hormuz passage does that job faster than any chart level will.
WTI daily chart
WTI Oil FAQs
WTI Oil is a type of Crude Oil sold on international markets. The WTI stands for West Texas Intermediate, one of three major types including Brent and Dubai Crude. WTI is also referred to as “light” and “sweet” because of its relatively low gravity and sulfur content respectively. It is considered a high quality Oil that is easily refined. It is sourced in the United States and distributed via the Cushing hub, which is considered “The Pipeline Crossroads of the World”. It is a benchmark for the Oil market and WTI price is frequently quoted in the media.
Like all assets, supply and demand are the key drivers of WTI Oil price. As such, global growth can be a driver of increased demand and vice versa for weak global growth. Political instability, wars, and sanctions can disrupt supply and impact prices. The decisions of OPEC, a group of major Oil-producing countries, is another key driver of price. The value of the US Dollar influences the price of WTI Crude Oil, since Oil is predominantly traded in US Dollars, thus a weaker US Dollar can make Oil more affordable and vice versa.
The weekly Oil inventory reports published by the American Petroleum Institute (API) and the Energy Information Agency (EIA) impact the price of WTI Oil. Changes in inventories reflect fluctuating supply and demand. If the data shows a drop in inventories it can indicate increased demand, pushing up Oil price. Higher inventories can reflect increased supply, pushing down prices. API’s report is published every Tuesday and EIA’s the day after. Their results are usually similar, falling within 1% of each other 75% of the time. The EIA data is considered more reliable, since it is a government agency.
OPEC (Organization of the Petroleum Exporting Countries) is a group of 12 Oil-producing nations who collectively decide production quotas for member countries at twice-yearly meetings. Their decisions often impact WTI Oil prices. When OPEC decides to lower quotas, it can tighten supply, pushing up Oil prices. When OPEC increases production, it has the opposite effect. OPEC+ refers to an expanded group that includes ten extra non-OPEC members, the most notable of which is Russia.
추천 기사


