


Gold soars toward $4,500 as Treasury buyback sinks US yields
- Gold jumps as Treasury buyback drives long-end yields lower.
- US Dollar weakness adds support as XAU/USD nears the $4,500 threshold.
- Fed minutes and jobless claims remain key market catalysts.
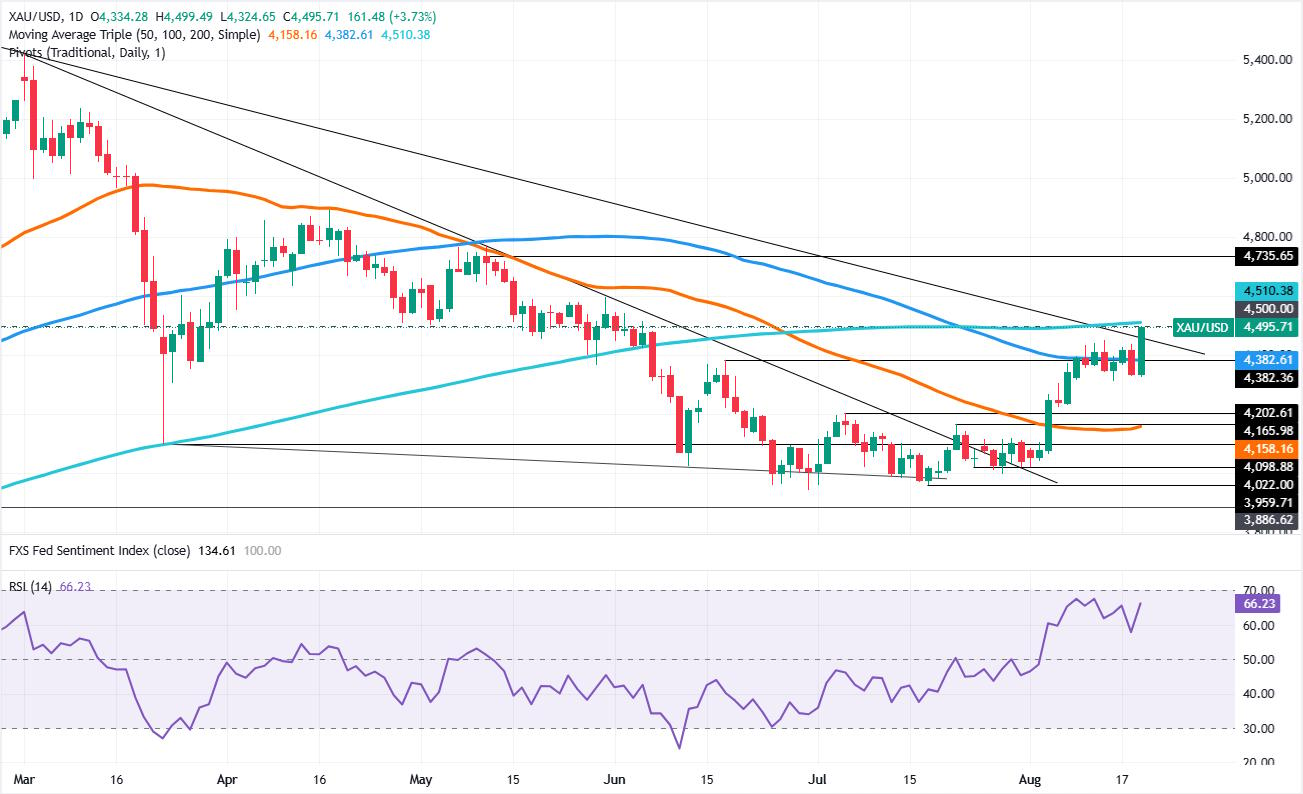
Gold (XAU/USD) skyrockets on Wednesday as the Greenback edges lower amid falling US bond yields, driven by the US Treasury's buyback of long-dated bonds. At the time of writing, the XAU/USD pair trades at $4,495, up by over 3.70% in the day and at its highest level since June 4.
XAU/USD rallies as falling yields and Dollar weakness boost bullion
The US Treasury buyback is behind bullion’s advance as US Treasury yields continued to dive further during the session. The US 30-year yield, which hit its highest level since 2007 on Tuesday, drops by over eight basis points to 5.20%. At the same time, the yield of the US 10-year benchmark note is down almost five basis points, down to 4.660%.
Sources cited by Bloomberg said that “This administration needs a win and maybe that comes in the form of artificially trying to keep long Treasury rates contained.”
Worth noting that US bond yields have risen sharply since July, sponsored by high energy prices as the Middle East conflict continues, which has increased inflation expectations in the US. Also, the Federal Reserve (Fed) has held interest rates unchanged at its last five meetings, amid cooling prices.
The non-yielding metal is also boosted by the Dollar's decline. The US Dollar Index (DXY), which measures the performance of the buck’s value against a basket of six peers, is down 0.80% at 98.85.
Ahead, the Federal Reserve is expected to unveil its last meeting minutes amid a sparse economic docket this week. Left there’s the release of Initial Jobless Claims, a speech by St. Louis Fed President Alberto Musalem and S&P Global Flash PMIs.
XAU/USD technical outlook: Gold hovers near $4,500 as bulls target the 200-day SMA
Gold seems to be gaining traction as it approaches the 200-day Simple Moving Average (SMA) at $4,510, a move triggered by news of the US Treasury bond buyback. Bulls are gaining momentum, as depicted by the Relative Strength Index (RSI), which favors further upside, and are aiming higher.
If bulls want to test higher prices, they must end Wednesday’s session above $4,500. In that outcome, the 200-day SMA would be the next resistance area, followed by $4,700 and the May 12 daily high at $4,735, surrounded by a cluster of six candles.
On the flip side, a false breakout above $4,500 could trigger a drop back below $4,400, followed by a test of the weekly low at $4,324. The next stop would be the last week’s low at $4,311, seen as the last line of defense, before aiming towards the 50-day SMA at $4,158.
Gold FAQs
Gold has played a key role in human’s history as it has been widely used as a store of value and medium of exchange. Currently, apart from its shine and usage for jewelry, the precious metal is widely seen as a safe-haven asset, meaning that it is considered a good investment during turbulent times. Gold is also widely seen as a hedge against inflation and against depreciating currencies as it doesn’t rely on any specific issuer or government.
Central banks are the biggest Gold holders. In their aim to support their currencies in turbulent times, central banks tend to diversify their reserves and buy Gold to improve the perceived strength of the economy and the currency. High Gold reserves can be a source of trust for a country’s solvency. Central banks added 1,136 tonnes of Gold worth around $70 billion to their reserves in 2022, according to data from the World Gold Council. This is the highest yearly purchase since records began. Central banks from emerging economies such as China, India and Turkey are quickly increasing their Gold reserves.
Gold has an inverse correlation with the US Dollar and US Treasuries, which are both major reserve and safe-haven assets. When the Dollar depreciates, Gold tends to rise, enabling investors and central banks to diversify their assets in turbulent times. Gold is also inversely correlated with risk assets. A rally in the stock market tends to weaken Gold price, while sell-offs in riskier markets tend to favor the precious metal.
The price can move due to a wide range of factors. Geopolitical instability or fears of a deep recession can quickly make Gold price escalate due to its safe-haven status. As a yield-less asset, Gold tends to rise with lower interest rates, while higher cost of money usually weighs down on the yellow metal. Still, most moves depend on how the US Dollar (USD) behaves as the asset is priced in dollars (XAU/USD). A strong Dollar tends to keep the price of Gold controlled, whereas a weaker Dollar is likely to push Gold prices up.
추천 기사


