


Bitcoin reclaims key moving averages, altering bear cycle pattern — K33
- Bitcoin reclaimed its 50-day, 100-day, 200-day and 200-week moving averages, a structure historically associated with cycle bottoms.
- The top crypto's recent 54% drawdown is shallower than the 77.5%-85% declines recorded in previous bear markets.
- Bitcoin ETPs absorbed more than 14,000 BTC after the cryptocurrency broke above its ETF cost basis for the first time since January.
Bitcoin (BTC) may have altered its bear-cycle pattern after climbing above its 50-day, 100-day, 200-day, and 200-week moving averages, according to K33.
In a Tuesday report, K33 noted that every time Bitcoin reclaimed all four major averages before now, it happened after the market had already established its cycle low.
“Every instance prior to 2026 occurred after BTC had already made its cycle low, with BTC subsequently pushing higher with solid momentum after reclaiming its major moving averages,” K33 wrote.
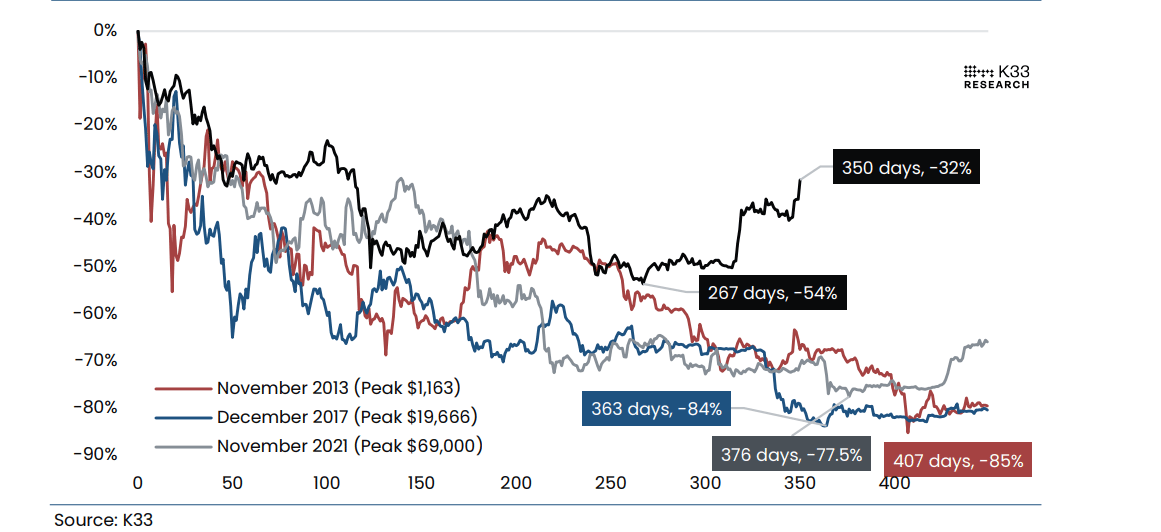
Bitcoin remains 32% below its October 6 all-time high of $126,296, but the recent drawdown reached a 54% decline from that peak before a subsequent recovery. In contrast, the three previous drawdowns in 2013, 2017 and 2021, which lasted between 363 and 407 days, produced declines ranging from 77.5% to 85%. The report also said 50% of Bitcoin's supply traded at a loss faster than in previous market downturns.
K33 shared that neither recent derivatives positioning nor market sentiment currently indicates meaningful near-term downside risk.
“Neither recent changes in derivatives nor sentiment point to meaningful downside risks in the near term, while BTC still has considerable catch-up potential versus gold and equities amid a favorable broader backup,” K33 wrote.
Bitcoin ETF flows signal stronger external demand
On the institutional side, Bitcoin moved above the average entry price of US spot BTC exchange-traded funds (ETFs) for the first time since January, ending a record 236-day period below the ETF cost basis. The move was accompanied by more than 14,000 BTC entering into Bitcoin products on Monday.
“The recent behavioral pattern of ETF investors adding to BTC near the cost basis rather than exiting is very encouraging,” K33 wrote.
In May, Bitcoin approached the ETF cost basis but was rejected. That episode was followed by 127,900 BTC in ETF redemptions over seven weeks, marking the worst Bitcoin ETF outflow period on record. This time, Bitcoin spent roughly four weeks near the ETF cost basis without triggering comparable selling. Flows remained marginally positive before accelerating after the breakout. K33 added that 63% of trading days over the past 30 days recorded net inflows, while total Bitcoin ETP holdings remain about 99,000 BTC below their previous peak.
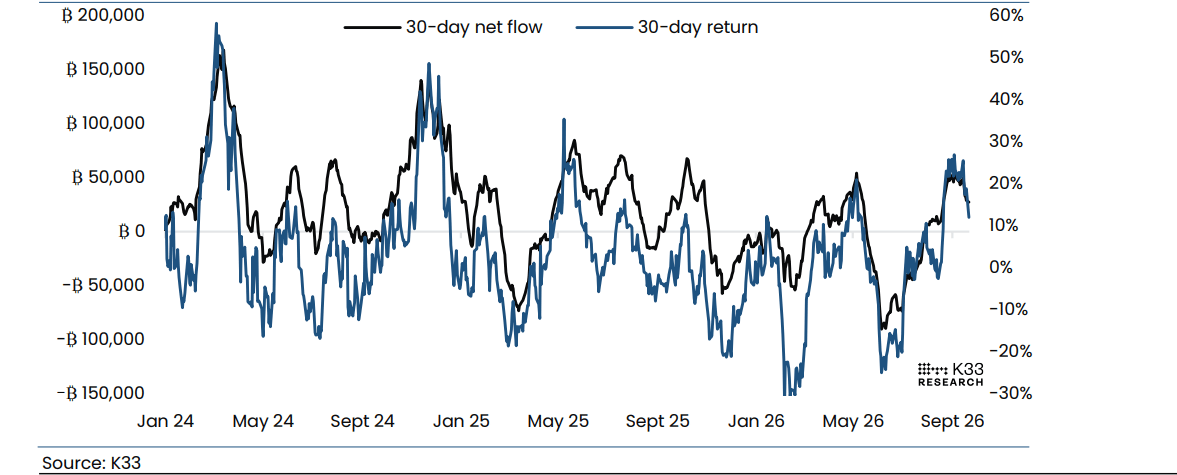
The improvement across spot Bitcoin ETF products has been accompanied by higher market activity. K33 reported that average daily Bitcoin spot volume increased to $3.5 billion from $2.6 billion last week.
Seven-day Bitcoin volatility has also risen to 3.5%, approaching monthly highs, while 30-day volatility stands at 2.2%.
The report also highlighted that Bitcoin’s Fear and Greed Index had entered extreme greed territory at 78, its first move into that zone since 2025.
Bitcoin is trading at $86,400, up 0.7% in the past 24 hours at the time of writing.
추천 기사


