


Hedera Price Forecast: HBAR extends bullish breakout near $0.10 amid rising retail interest
- Hedera gains momentum for a sixth straight day as the price approaches the critical $0.1000 level.
- The derivatives market shows growing demand and activity, as evidenced by higher futures Open Interest and volume.
- HBAR bulls tighten their grip, supported by strengthening momentum indicators and trailing moving averages.
Hedera (HBAR) ticks up near $0.1000 on Tuesday, reinforcing growing investor interest in the broader cryptocurrency market. This marks the sixth consecutive day that HBAR has posted gains, building on an improving technical structure, regulatory developments and ecosystem growth.
A decisive move above $0.1000 would reinforce the bullish scenario and likely prompt investors to take on more risk. However, traders should remain cautious, as a failure to overcome and hold this level may trigger profit-taking.
Hedera gains as retail demand remains steady
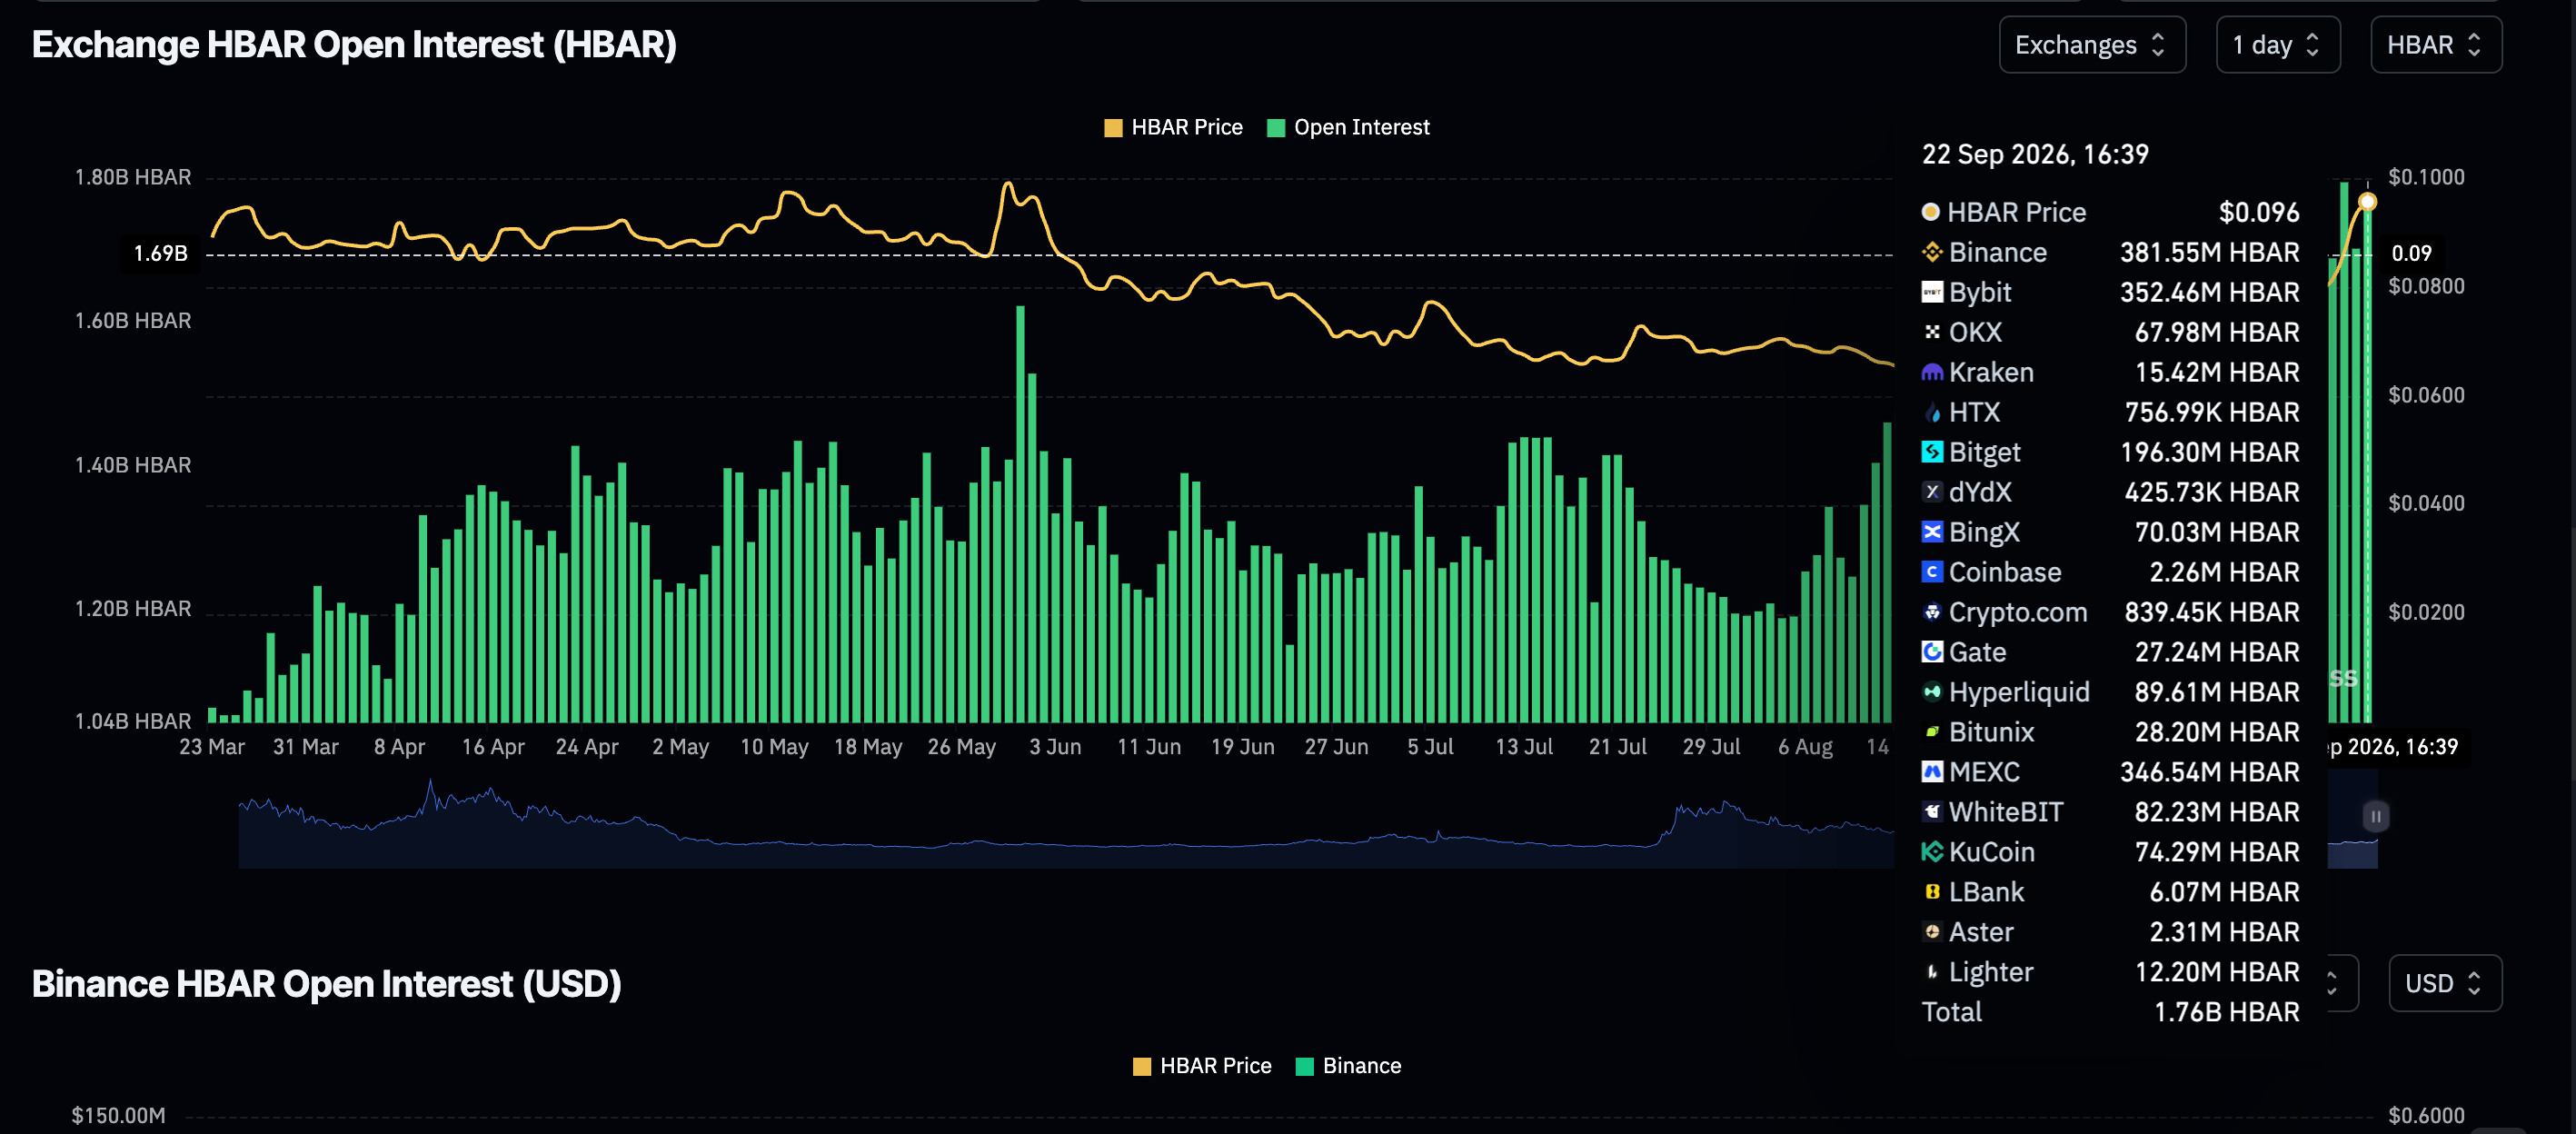
The Hedera derivatives market holds firm, as reflected in perpetual futures Open Interest (OI) climbing to roughly 1.8 billion HBAR on Tuesday from 1.7 billion, according to CoinGlass. Broadly, OI has increased from 1.4 billion HBAR recorded last Wednesday, underscoring growing investor interest in the token. If sustained, higher OI would back Hedera’s bullish picture, raising the odds of long-term gains.
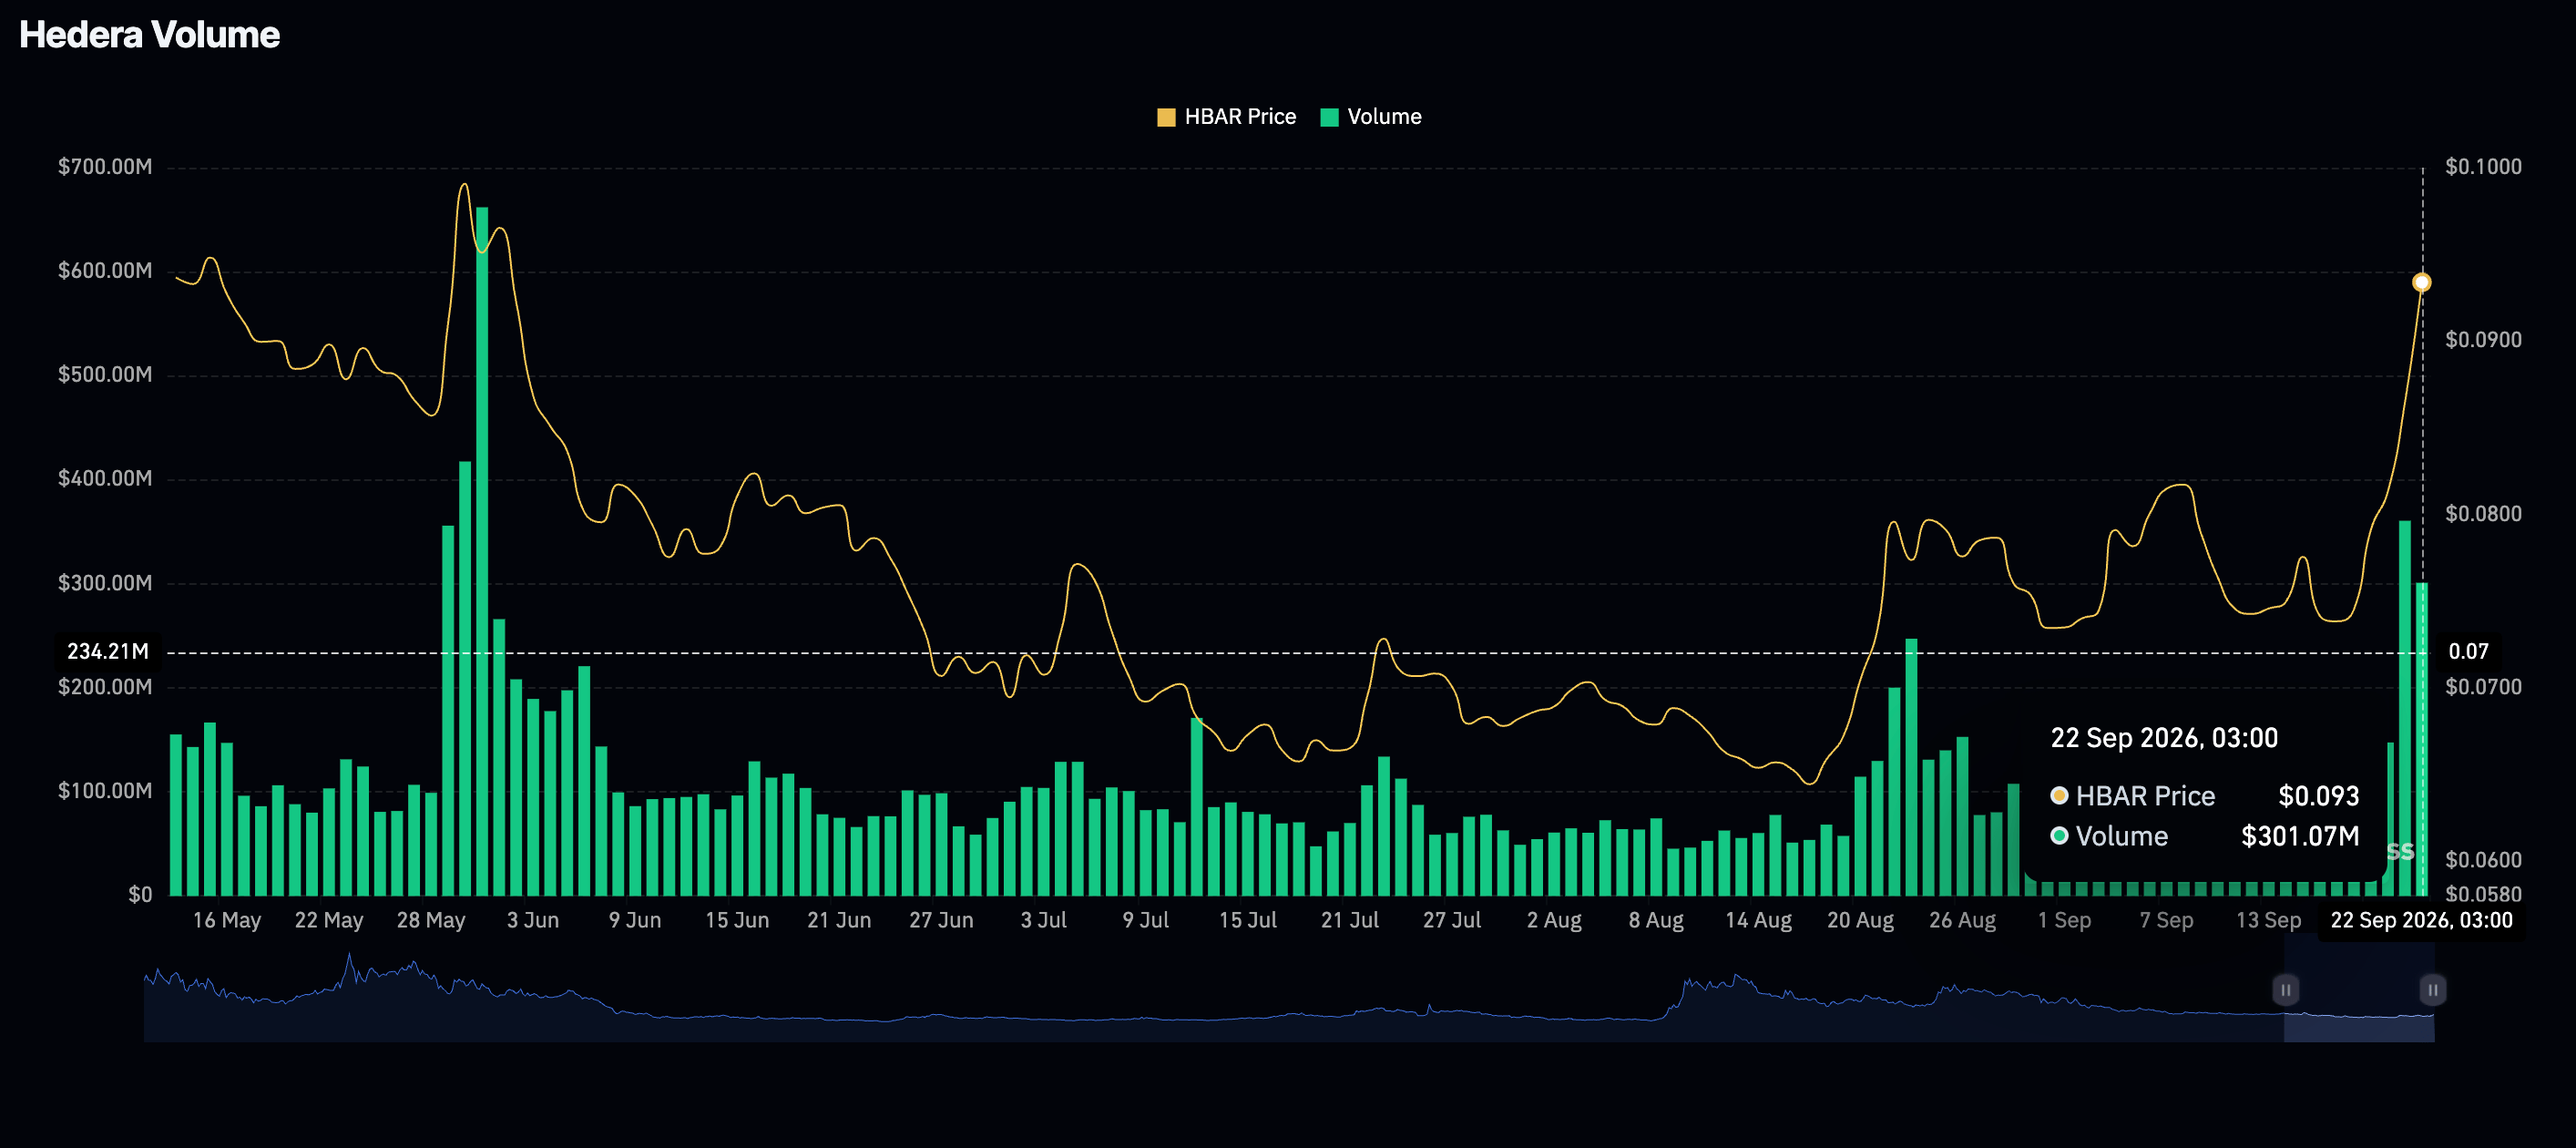
On top of the elevated OI, trading volume holds higher at $301 million despite a correction from the previous day’s $360 million. Compared to $138 million in volume last Wednesday, the current trading activity is much higher. That said, trading volume alone does not signal bullish momentum; it reflects overall market participation and should be evaluated alongside metrics like open interest and technical indicators.
Technical analysis: HBAR eyes extended gains
Hedera trades at $0.0962, extending a strong bullish phase after reclaiming all its major Exponential Moving Averages (EMAs), reinforcing a constructive near-term tone. The Moving Average Convergence Divergence (MACD) indicator remains positive with a rising histogram, while the Relative Strength Index (RSI) at 78 sits in overbought territory, suggesting upside momentum is strong but increasingly stretched.
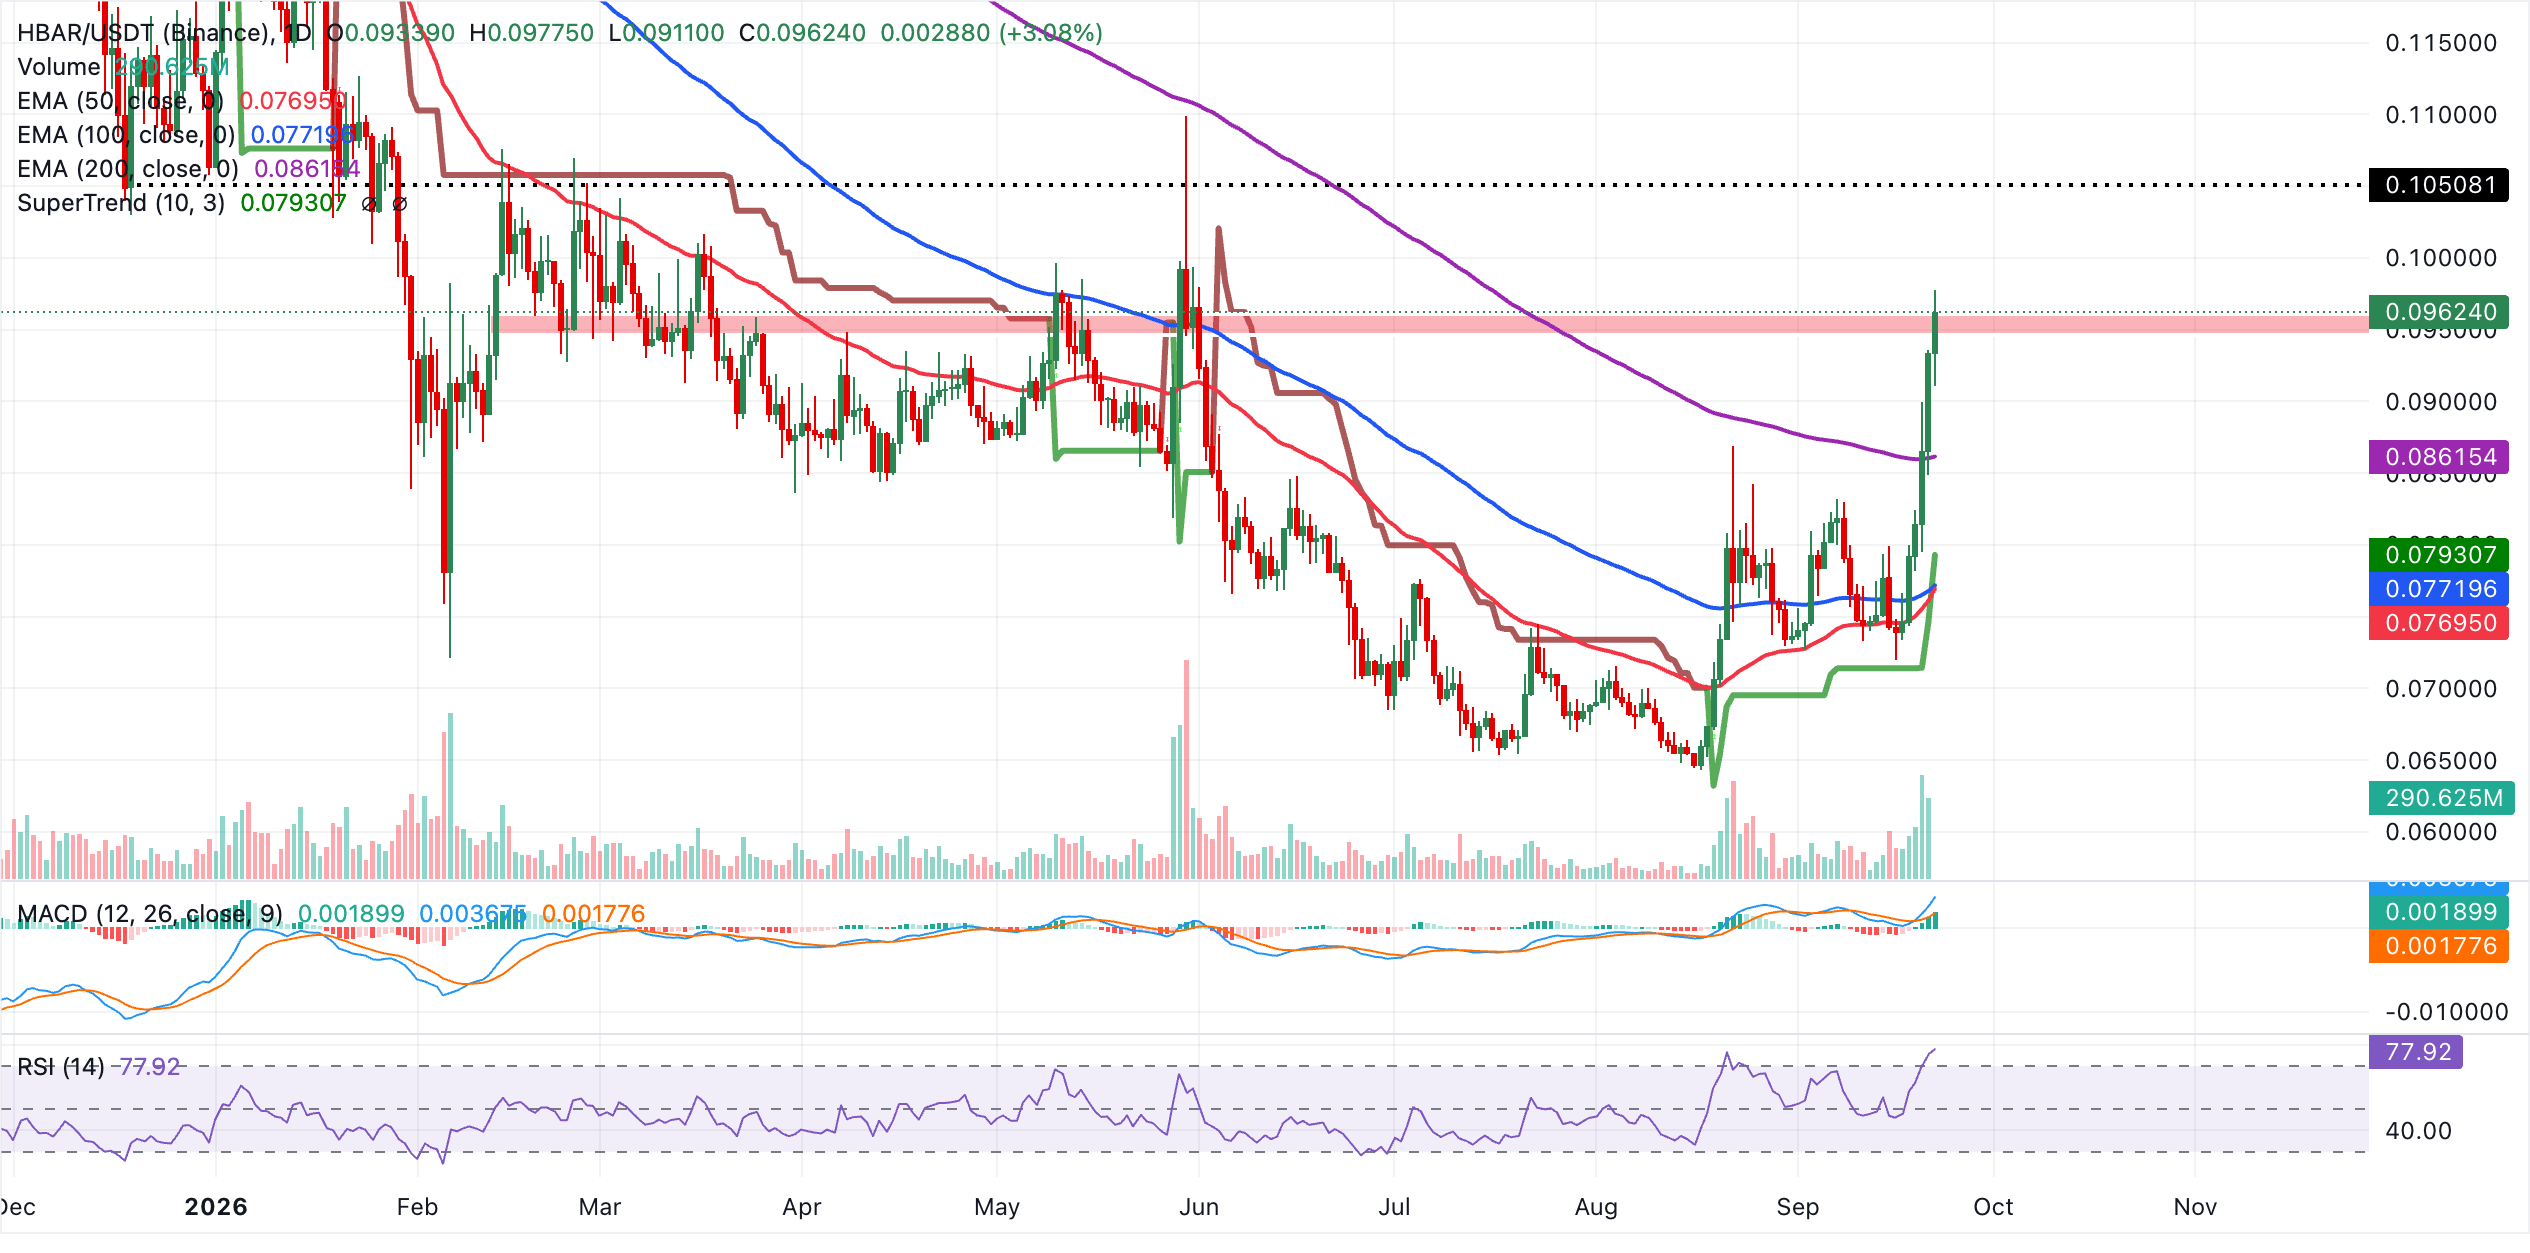
On the downside, initial support is seen at the 200-day EMA near $0.0862, with secondary demand clustered around the SuperTrend at $0.0793 and the 100-day and 50-day EMAs at $0.0772 and $0.0769, respectively. As long as HBAR holds above these support levels, the broader bullish bias is likely to persist, though the elevated RSI suggests any further gains from current levels could be followed by a corrective pullback toward the $0.0860-$0.0790 support band.
Nevertheless, HBAR remains capped in the broader picture, as it holds below the 50-week, 100-week and 200-week EMAs at $0.1029, $0.1195 and $0.1244, respectively, keeping the near-term bias bearish despite the latest recovery.
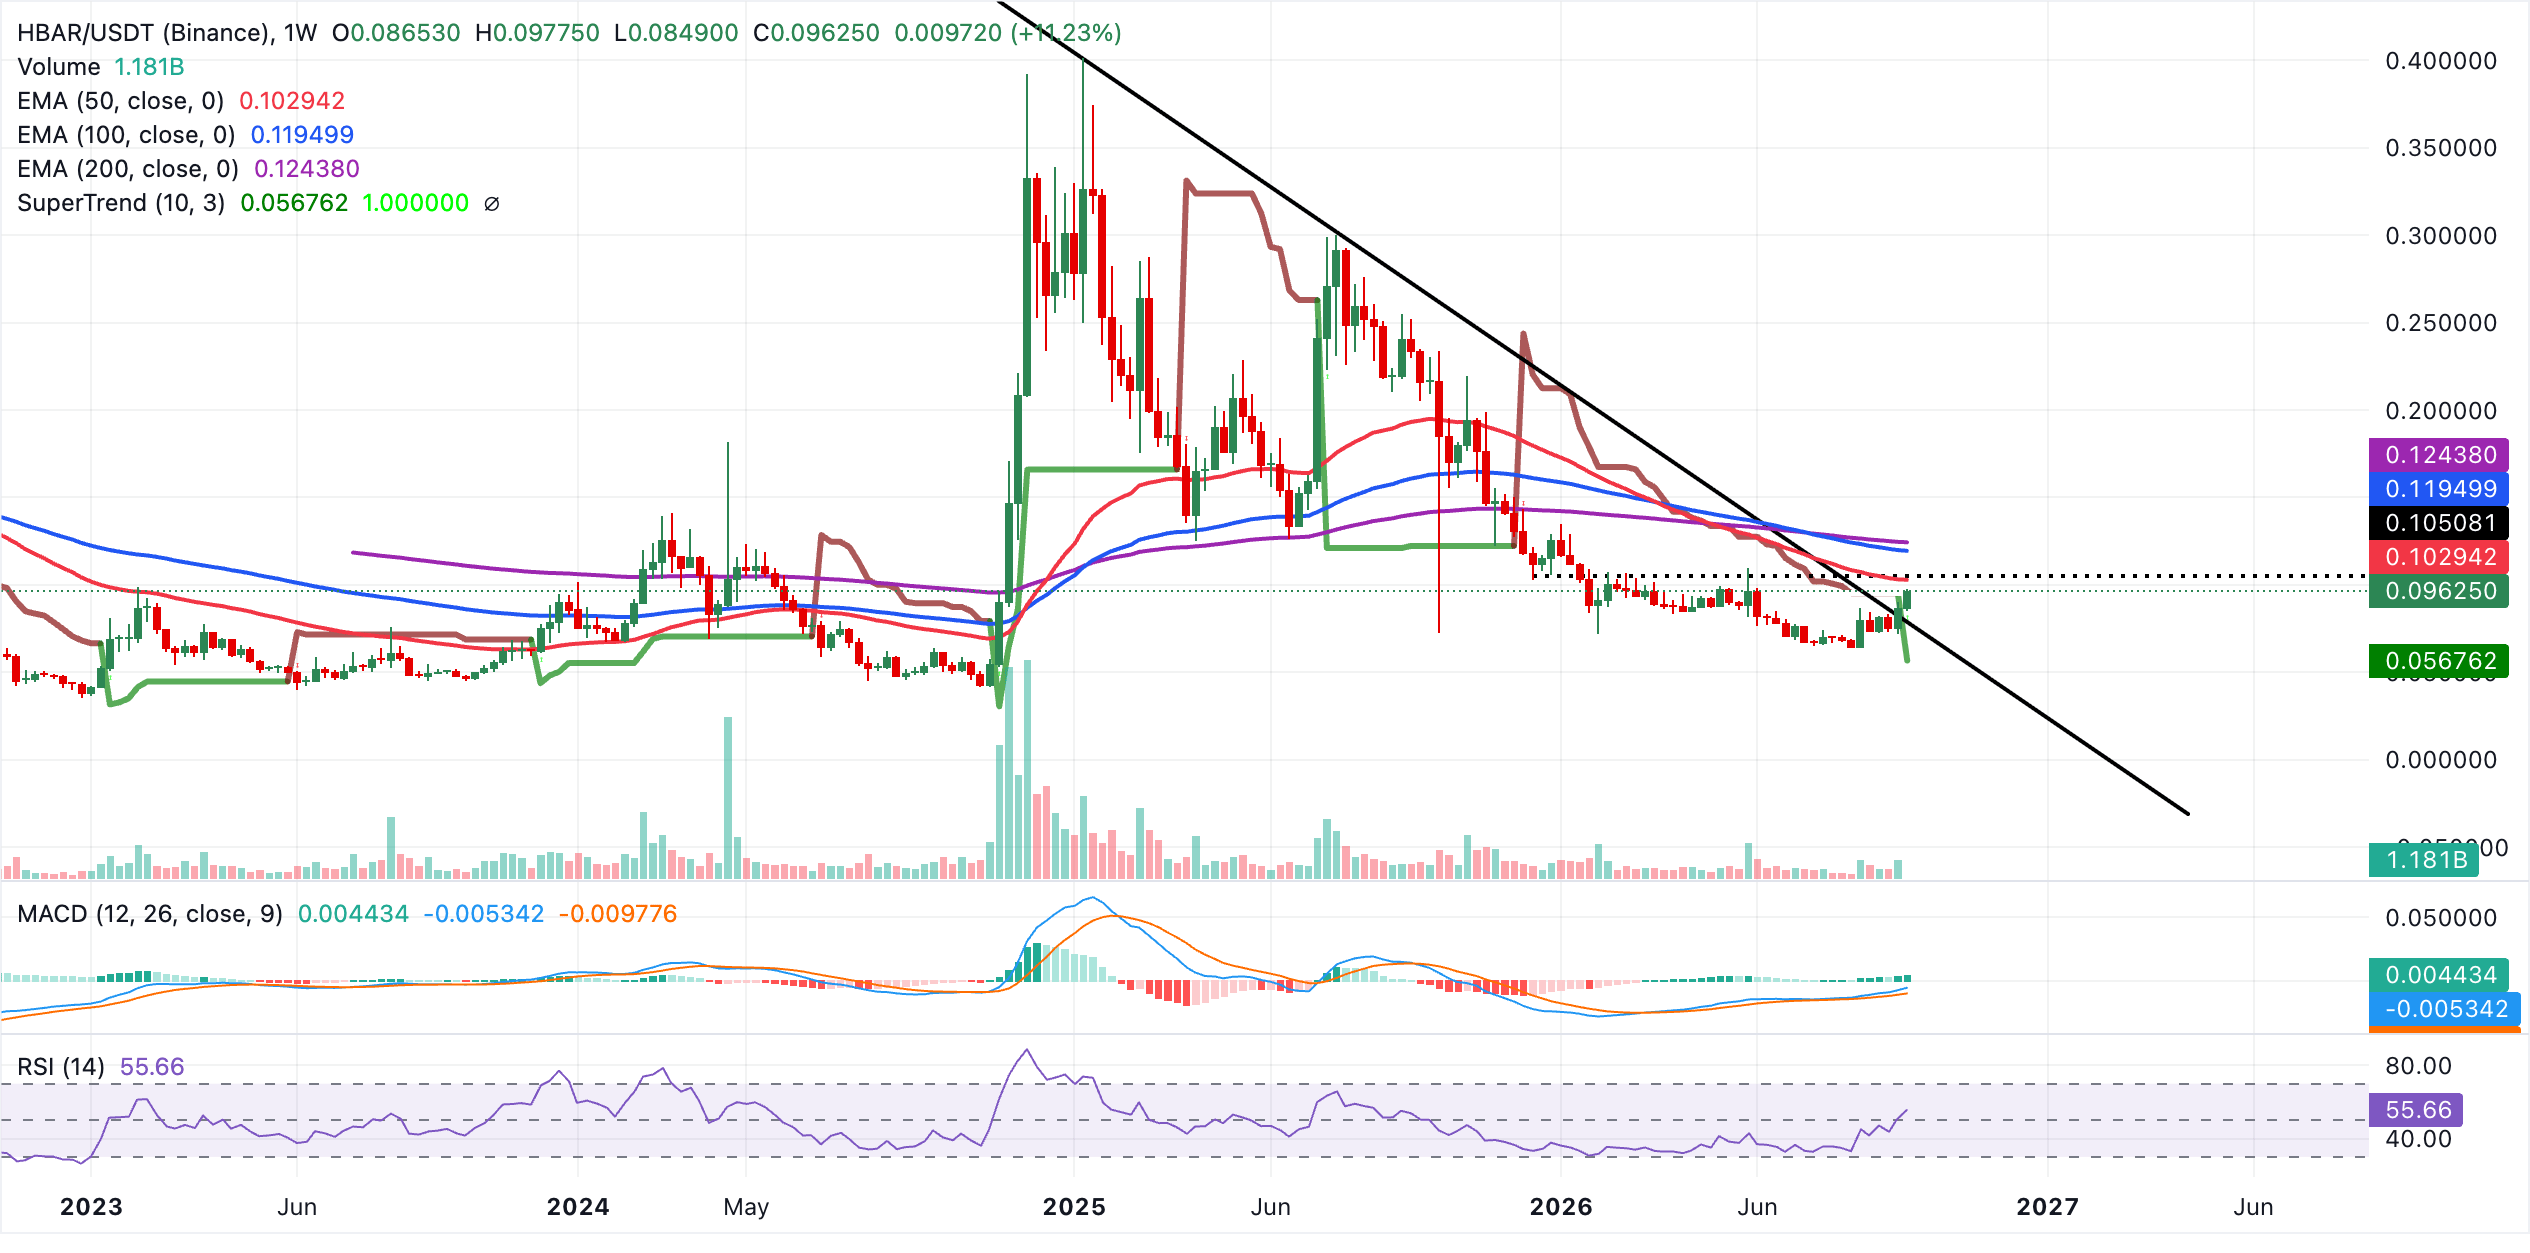
The immediate focus is the recent pivot around the current price zone, while deeper support is at the prior downward resistance trendline break near $0.0779 and then at the SuperTrend baseline around $0.0568, where buyers would be expected to show more interest if bearish pressure resumes.
(The technical analysis of this story was written with the help of an AI tool. Know more.)
Bitcoin, altcoins, stablecoins FAQs
Bitcoin is the largest cryptocurrency by market capitalization, a virtual currency designed to serve as money. This form of payment cannot be controlled by any one person, group, or entity, which eliminates the need for third-party participation during financial transactions.
Altcoins are any cryptocurrency apart from Bitcoin, but some also regard Ethereum as a non-altcoin because it is from these two cryptocurrencies that forking happens. If this is true, then Litecoin is the first altcoin, forked from the Bitcoin protocol and, therefore, an “improved” version of it.
Stablecoins are cryptocurrencies designed to have a stable price, with their value backed by a reserve of the asset it represents. To achieve this, the value of any one stablecoin is pegged to a commodity or financial instrument, such as the US Dollar (USD), with its supply regulated by an algorithm or demand. The main goal of stablecoins is to provide an on/off-ramp for investors willing to trade and invest in cryptocurrencies. Stablecoins also allow investors to store value since cryptocurrencies, in general, are subject to volatility.
Bitcoin dominance is the ratio of Bitcoin's market capitalization to the total market capitalization of all cryptocurrencies combined. It provides a clear picture of Bitcoin’s interest among investors. A high BTC dominance typically happens before and during a bull run, in which investors resort to investing in relatively stable and high market capitalization cryptocurrency like Bitcoin. A drop in BTC dominance usually means that investors are moving their capital and/or profits to altcoins in a quest for higher returns, which usually triggers an explosion of altcoin rallies.
추천 기사


