


Silver Price Forecast: Recovery hits 20-day EMA roadblock
- Silver price struggled to recover further above $60.00 amid surging oil prices.
- The closure of the Bab el-Mandeb Strait has prompted energy supply risks.
- Investors await the ECB monetary policy announcement on Thursday.
Silver price (XAG/USD) gives back some of its early gains, but is still 0.8% higher at around $59.25 during the European trading session on Wednesday. The white metal struggles to extend the rally beyond the psychological level of $60.00 due to a fresh surge in oil prices amid escalating Middle East energy supply risks.
In European trade, the WTI Oil price is up more than 2% at around $86, the highest level seen in over five weeks.
Higher oil prices boost fears of hot inflation expectations, a scenario that forces global central banks to tighten monetary conditions. Theoretically, hawkish monetary policy expectations bode poorly for non-yielding assets, such as Silver.
Fears of a further squeeze in the energy supply from the Middle East are prompted by the closure of Bab el-Mandeb Strait, the southern gateway of the Red Sea, from which 7% of global energy is transported.
Yemen's Iran-aligned Houthis announced a 'maritime embargo' on Saudi Arabia in retaliation for a Saudi blockade of ports and airports in Houthi-controlled north-western Yemen, BBC News reported.
Going forward, the next trigger for the Silver price will be the European Central Bank’s (ECB) monetary policy announcement on Thursday, in which the central bank is expected to leave policy rates steady. Investors will pay close attention to commentary from ECB President Christine Lagarde regarding the inflation outlook.
Silver technical analysis
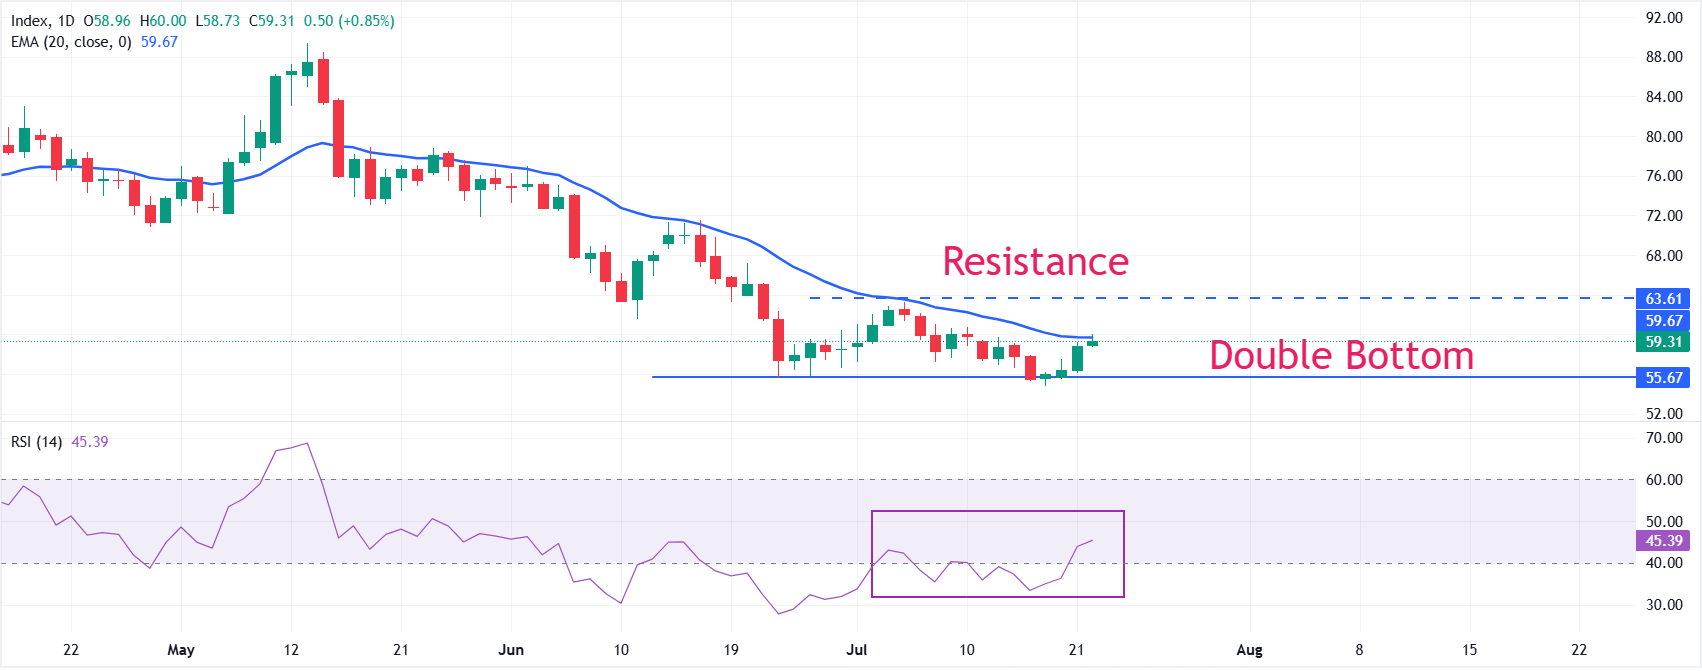
XAG/USD trades higher at around $59.34 at press time. The white metal has recovered to near the 20-day exponential moving average (EMA) at $59.68, improving its near-term bias.
The EMA slope is still declining, suggesting rallies are likely to face selling interest near that barrier, while the Relative Strength Index (RSI) at 45.49 stays below the neutral 50 line, hinting at subdued upside momentum rather than a decisive bullish reversal.
On the topside, initial resistance is clearly defined by the 20-day EMA at $59.68, and a daily close above this level would be needed to extend the recovery towards the July 6 high at $63.28. A decisive break above the latter would trigger a bullish reversal, confirming the checklist of the Double Bottom formation. Looking down, the July low at $54.77 will be the key support level.
(The technical analysis of this story was written with the help of an AI tool. Know more.)
Middle East tensions keep Brent elevated as Rabobank warns energy markets cannot take the summer off
Analysts at Rabobank underline that emerging signs of a “threatened blockade of Saudi ports” are already feeding through to energy pricing, cautioning that this development “will not allow energy markets to ‘take the summer off’ rather than taking off.” The bank notes that “we are at $91.5 on Brent at time of writing with crack spreads still round $70,” underscoring the degree to which geopolitical risk is being reflected in current market levels.
추천 기사


