


Solana Price Forecast: ETF inflows, bullish derivatives signal more upside
- Solana price steadies at $78 on Wednesday, up over 2% so far this week.
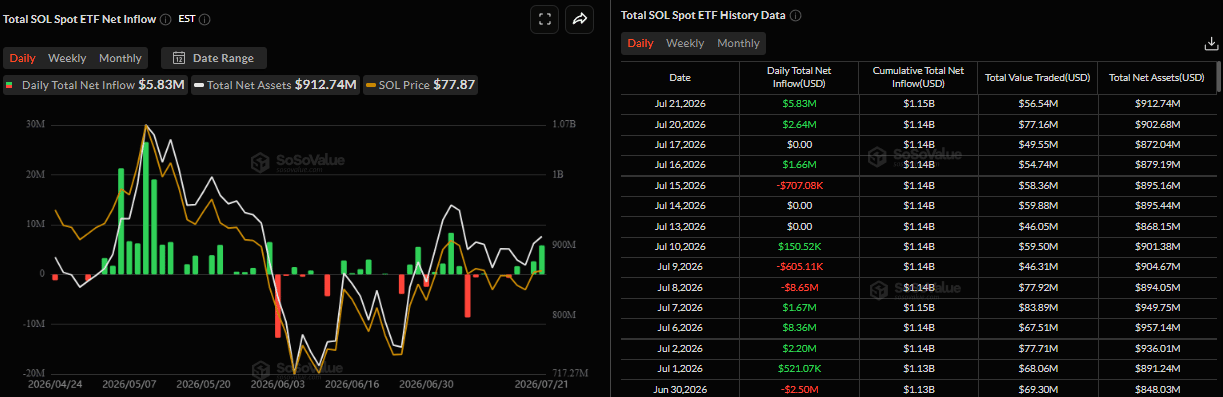
- US-listed spot ETFs recorded an inflow of $5.83 million on Tuesday, marking the second consecutive day of inflow this week.
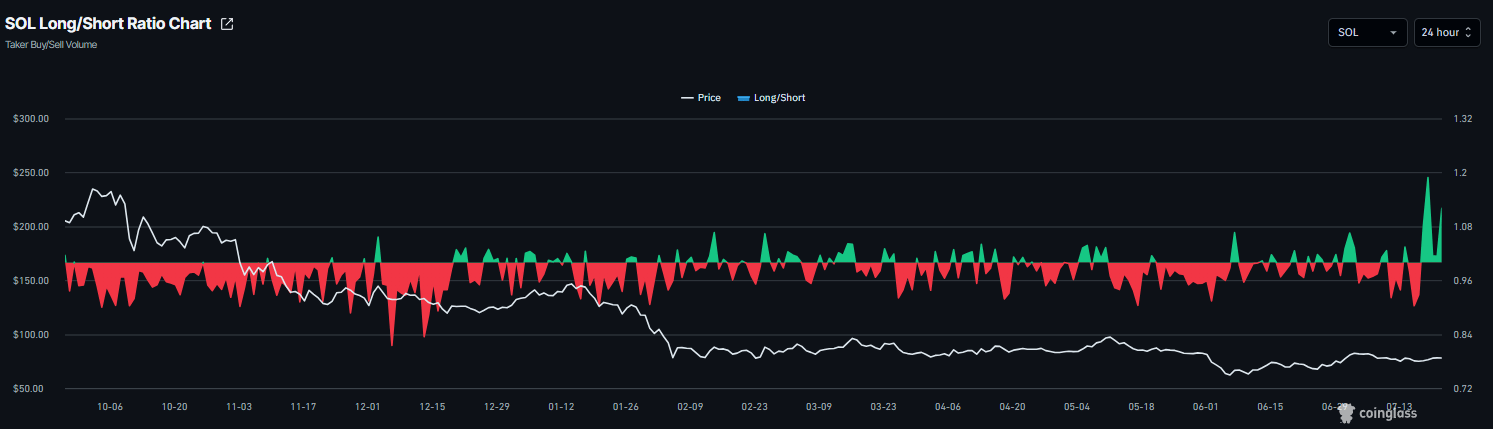
- Derivatives data backs the bullish sentiment, with long bets rising among traders.
Solana (SOL) steadies at $78 on Wednesday, up over 2% so far this week. Institutional demand shows positive signs with SOL spot Exchange Traded Funds (ETFs) recording a second consecutive day of inflow this week. In addition, strengthening derivatives metrics support further gains ahead.
Institutional demand shows a bullish bias
SoSoValue data shows that spot ETFs recorded an inflow of $5.83 million on Tuesday, the highest single-day inflow since July 6 and marking the second consecutive day of inflows this week. If this inflow continues and strengthens throughout the week, the SOL price could rally.
On the derivatives front, rising long bets among the traders further support the bullish bias. CoinGlass’ long-to-short ratio reads 1.12 on Wednesday, nearing the highest level over a month. A ratio below 1 indicates bullish sentiment, as traders bet that asset prices will rise.
Solana Price Forecast: Closes above 50-day EMA
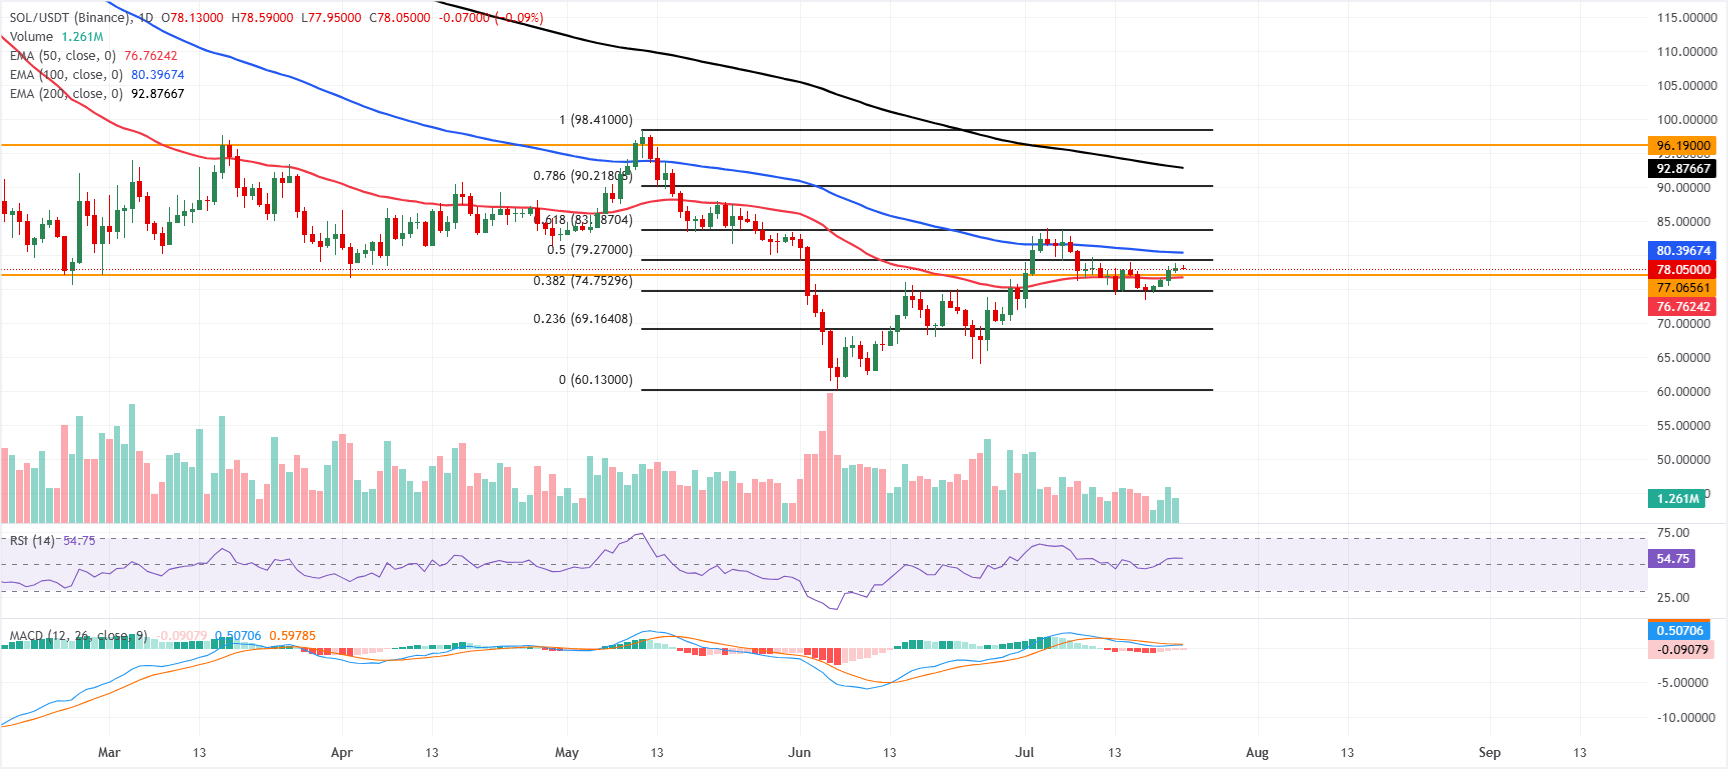
Solana price trades at $78.05 on Wednesday, maintaining a capped near-term tone as it holds below the 100-day Exponential Moving Average (EMA) at $80.39 and well under the 200-day EMA at $92.87. Price remains just above a local support cluster defined by the 50-period EMA at $76.76 and the horizontal line at $77.06, suggesting ongoing consolidation rather than a clear bullish breakout.
The Relative Strength Index (RSI) at 54 remains in neutral-to-positive territory. At the same time, the Moving Average Convergence Divergence (MACD) indicator is still slightly negative, suggesting that upside attempts are tentative and vulnerable to renewed selling pressure, with these higher averages capping the pair.
On the topside, immediate resistance is seen at the 50% retracement at $79.27, followed by the 100-day EMA at $80.39; a daily close above this band would open the way toward the 61.8% Fibonacci retracement at $83.78.
On the downside, initial support is found at the horizontal line at $77.06, reinforced by the 50-day EMA at $76.76; a break below this zone would expose the 38.2% Fibonacci retracement at $74.75, with deeper floors at $69.16 and $60.13 only likely to be tested if sellers regain firm control of the daily trend.
(The technical analysis of this story was written with the help of an AI tool. Know more.)
추천 기사


