


Cardano Price Forecast: Short-term recovery lacks retail support
- Cardano edges lower on Wednesday, capped below its 50-day EMA at $0.1770.
- Cardano derivatives data point to easing retail demand with contracting trading volume and Open Interest.
- The technical outlook for ADA shows a bearish bias, as price remains capped below a key resistance trendline.
Cardano (ADA) price edges lower on Wednesday after the 50-day Exponential Moving Average (EMA) at $1.770 capped two consecutive days of recovery seen earlier this week. ADA futures point to waning retail traction as Open Interest and trading volume decline amid elevated long liquidations. The technical outlook for ADA is bearish, as momentum remains subdued below a resistance trendline near $0.1782.
Demand wanes in Cardano futures
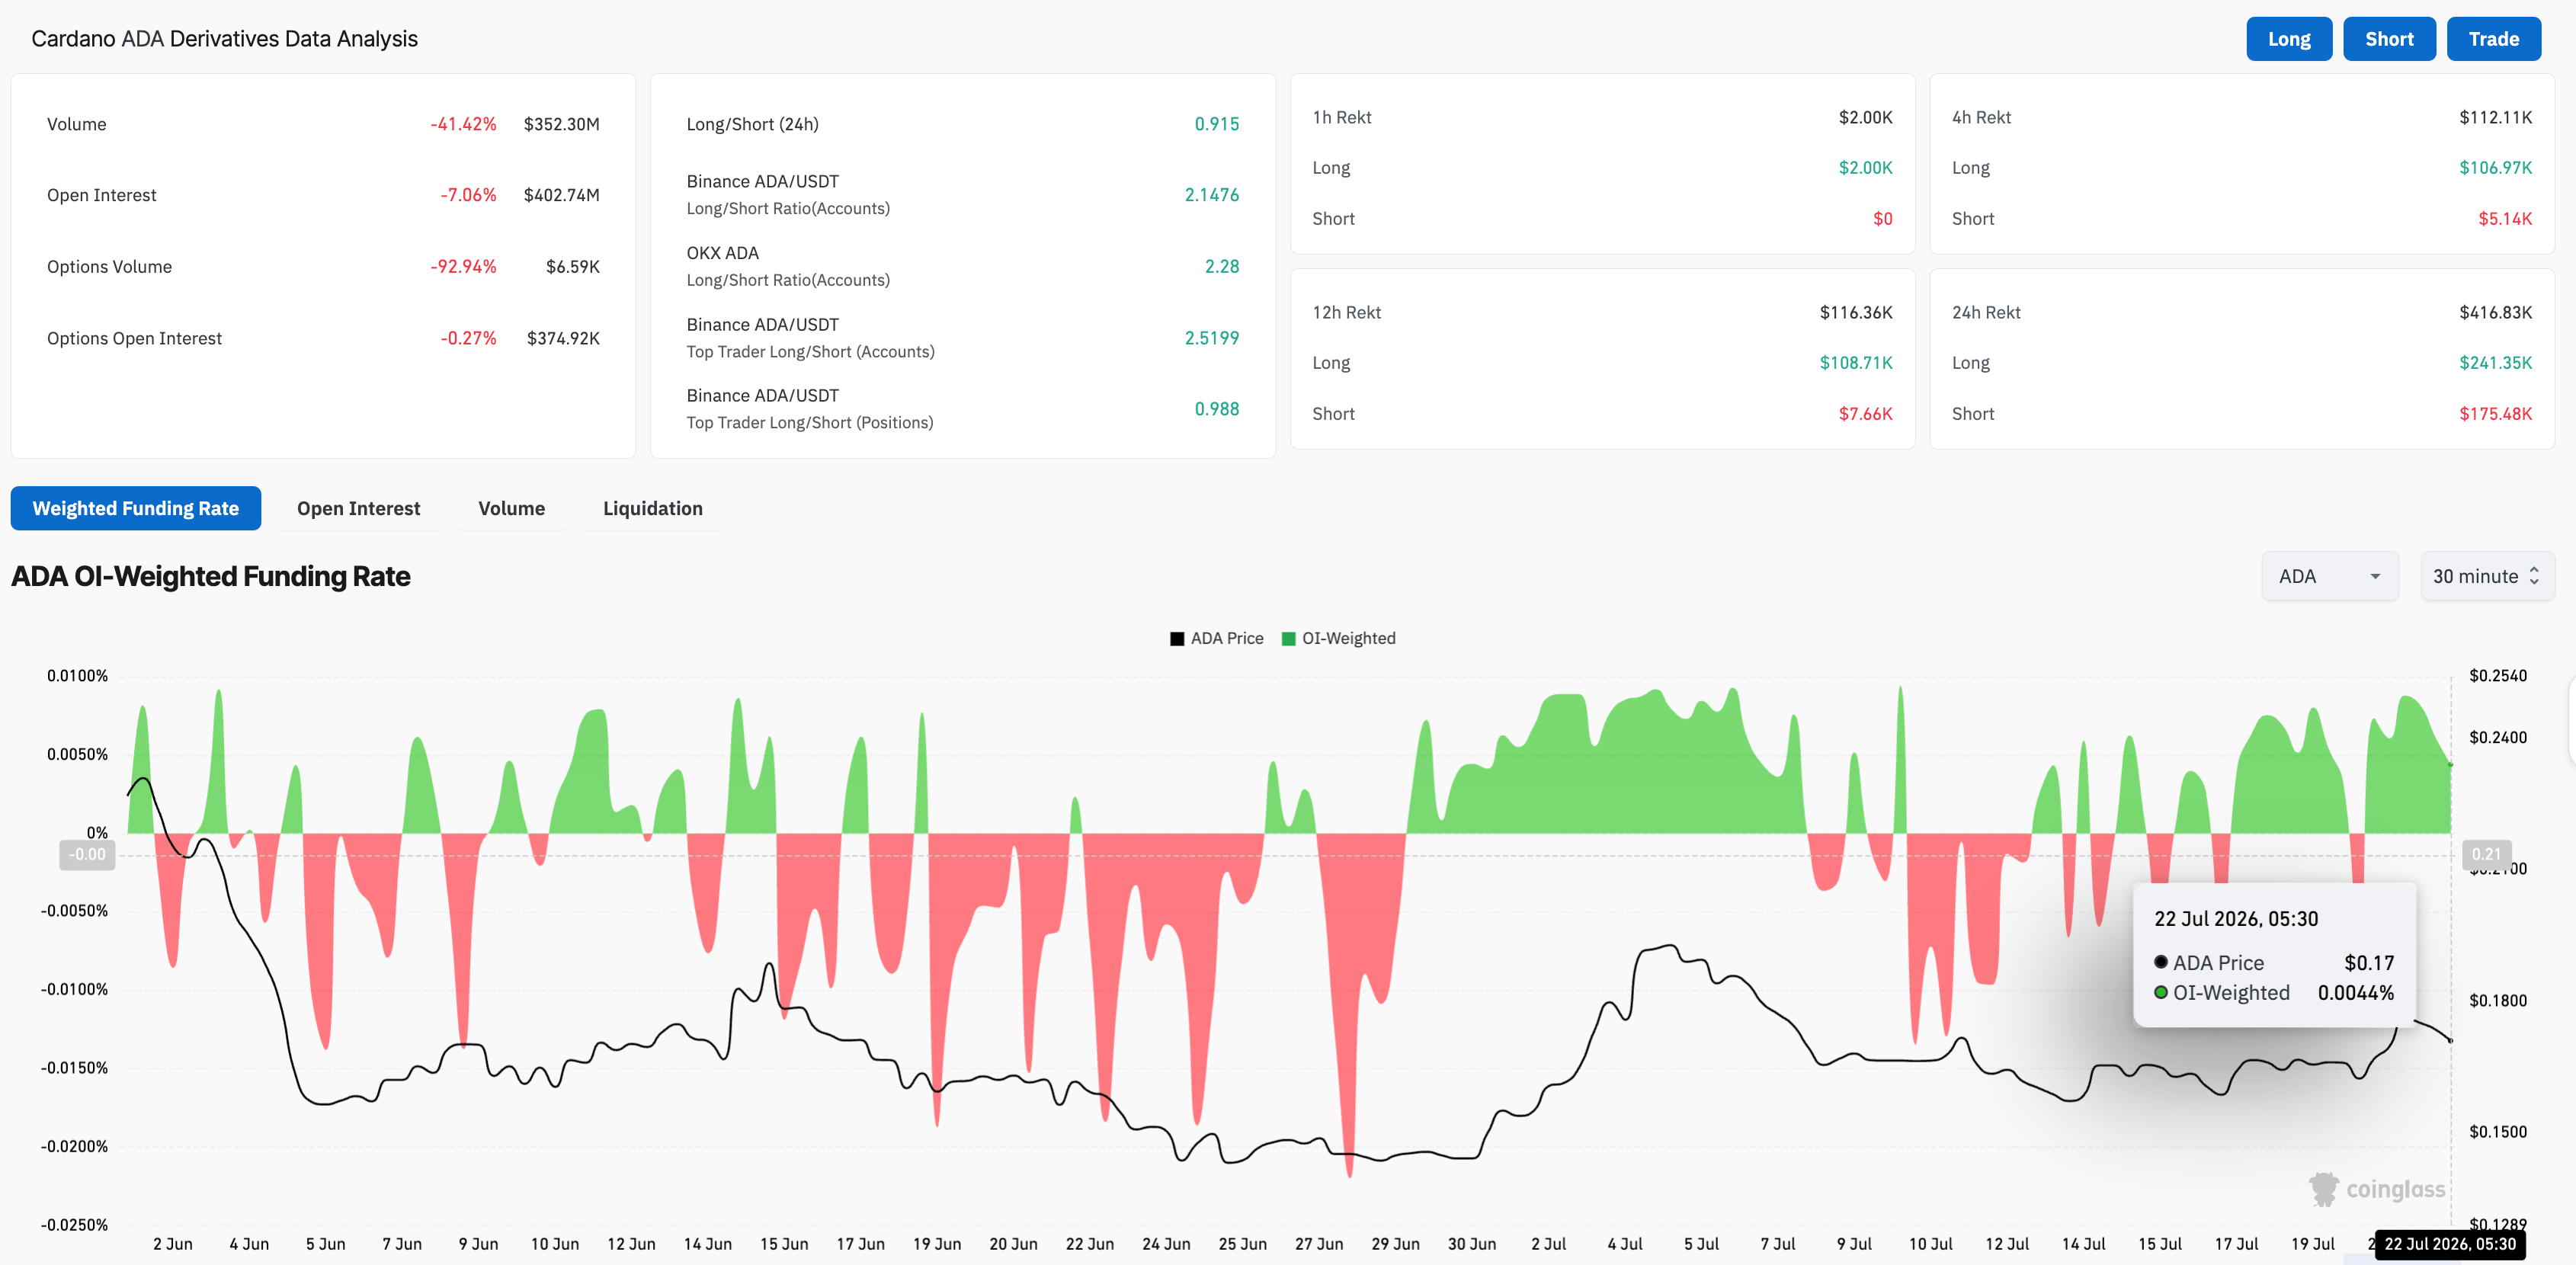
Cardano derivatives market witnesses a decline in retail activity and conviction. CoinGlass data show that ADA futures Open Interest (OI) is down 7% over the last 24 hours to $402.74 million, with trading volume down 41% to $352.30 million. Typically, a decline in volume and OI suggests easing retail interest.
At the same time, long liquidations of $241,350 outpace short liquidations of $175,480, indicating a sell-side dominance. Meanwhile, the positive funding rate of 0.0044%, down from a peak of 0.0088% the previous day, reaffirms easing bullish sentiment among traders.
Could Cardano sustain its bullish momentum?
Cardano edges lower on Wednesday, capped under the 50-day EMA at $0.1770 and well below the 200-day EMA at $0.2858. The downward resistance trendline, near the 50-day EMA at $0.1782, reinforces the overhead supply cluster, while the upward support trendline break level at $0.1629 underpins the recent higher lows.
The Moving Average Convergence Divergence (MACD) histogram stays marginally positive, hinting at mildly constructive momentum, but the Relative Strength Index (RSI) around 52 suggests only neutral directional pressure, leaving the broader bias constrained by the dominant resistance band.
On the topside, immediate resistance is seen at the 50-day EMA at $0.1771, followed by the downward resistance trend line reference at $0.1782. A sustained move above this zone would be needed to ease the current bearish cap and open the way toward the more distant $0.2205 horizontal level.
On the downside, first support aligns with the upward-trending structural level at $0.1629, while a deeper pullback would expose the horizontal support area near $0.1486, where buyers are likely to defend a broader range floor.
(The technical analysis of this story was written with the help of an AI tool. Know more.)
추천 기사


