

Gold tumbles nearly 2% as stronger US Dollar, rising yields weigh on bullion
- Gold falls to over one-week lows as rising US Treasury yields and a stronger US Dollar pressure the non-yielding metal.
- Stronger-than-expected US inflation and resilient consumer spending boost expectations that the Fed could raise interest rates by year-end.
- Technically, XAU/USD maintains a bearish near-term bias, with weak momentum indicators pointing to limited buying interest.
Gold (XAU/USD) slides to over one-week lows on Friday, pressured by a stronger US Dollar (USD) and rising Treasury yields as mounting Oil-driven inflation risks strengthen expectations that the Federal Reserve (Fed) could keep interest rates elevated for longer. At the time of writing, XAU/USD is trading around $4,554, down nearly 2% on the day.
The hawkish Fed outlook is gaining traction as higher energy prices have clearly slowed disinflation progress, pushing inflation further away from the Fed’s 2% target. Data released earlier this week showed US headline inflation rose to 3.8% YoY in April from 3.3% in March, marking the highest level since May 2023. Meanwhile, the Producer Price Index (PPI) climbed 6% YoY in April from 4.3% previously, recording its strongest increase since December 2023.
Meanwhile, consumer spending remained resilient, with US Retail Sales rising 0.5% MoM in April. The latest batch of US economic data prompted traders to increase bets that the US central bank could raise borrowing costs by year-end. A higher interest rate environment reduces the appeal of non-yielding assets like Gold because the precious metal does not offer any yield or interest.
According to the CME FedWatch Tool, markets are currently pricing in around a 45% probability of a rate hike at the December meeting, up from around 33% a day earlier.
Against this backdrop, US Treasury yields extended their advance, with the benchmark 10-year US Treasury yield climbing to its highest level in one year. Meanwhile, the US Dollar Index (DXY), which tracks the Greenback against a basket of six major currencies, rose above 99.00, its highest level since April 8.
On the geopolitical front, US-Iran peace talks remain stalled, with no near-term resolution in sight. Iran’s Foreign Minister Abbas Araghchi said on Friday that the US is sending “contradictory messages” on negotiations and added that Iran is prepared for both fighting and diplomatic solutions.
Attention also remains on the outcome of the concluded summit in Beijing between US President Donald Trump and Chinese President Xi Jinping, where both leaders discussed trade, increasing bilateral investment and the ongoing Iran war.
Trump told reporters on Friday that he would be open to Iran suspending its nuclear program for 20 years, but stressed it must be a “real” commitment. He also warned that if no nuclear agreement is reached, the US could resume military action targeting bridges and electrical infrastructure.
Technical Analysis: XAU/USD struggles below 20-day SMA as sellers retain control
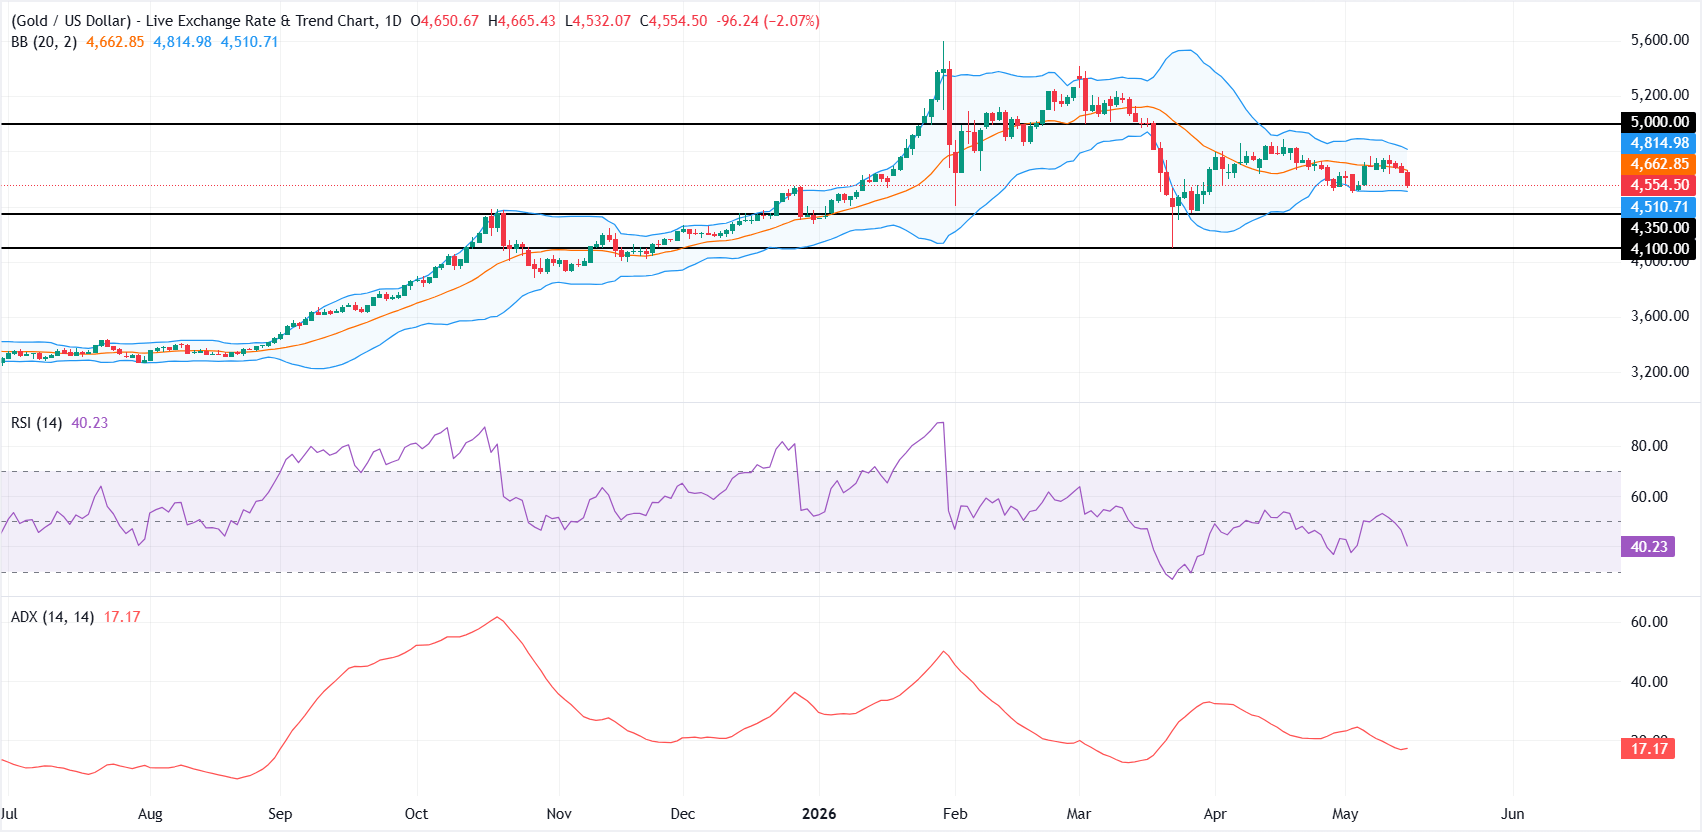
On the daily chart, XAU/USD maintains a mildly bearish near-term bias as spot holds below the 20-day Simple Moving Average (SMA) from the Bollinger Bands at roughly $4,662 and well under the upper band resistance near $4,814.
The lower band around $4,510 offers initial dynamic support, but a subdued Relative Strength Index (RSI) at 40.23 and a low Average Directional Index (ADX) near 17 hint at weak, directionless momentum, leaving Gold vulnerable while it trades beneath these overhead levels.
On the downside, immediate support is seen at the lower Bollinger Band around $4,510, ahead of the horizontal floor at $4,350, with a deeper cushion emerging near $4,100 if selling accelerates.
On the topside, a daily close above the mid-Bollinger 20-day SMA at $4,662 would be the first sign of stabilization, with further resistance waiting at the upper band near $4,814 and then at the more strategic horizontal barrier around $5,000.
(The technical analysis of this story was written with the help of an AI tool.)
Gold FAQs
Gold has played a key role in human’s history as it has been widely used as a store of value and medium of exchange. Currently, apart from its shine and usage for jewelry, the precious metal is widely seen as a safe-haven asset, meaning that it is considered a good investment during turbulent times. Gold is also widely seen as a hedge against inflation and against depreciating currencies as it doesn’t rely on any specific issuer or government.
Central banks are the biggest Gold holders. In their aim to support their currencies in turbulent times, central banks tend to diversify their reserves and buy Gold to improve the perceived strength of the economy and the currency. High Gold reserves can be a source of trust for a country’s solvency. Central banks added 1,136 tonnes of Gold worth around $70 billion to their reserves in 2022, according to data from the World Gold Council. This is the highest yearly purchase since records began. Central banks from emerging economies such as China, India and Turkey are quickly increasing their Gold reserves.
Gold has an inverse correlation with the US Dollar and US Treasuries, which are both major reserve and safe-haven assets. When the Dollar depreciates, Gold tends to rise, enabling investors and central banks to diversify their assets in turbulent times. Gold is also inversely correlated with risk assets. A rally in the stock market tends to weaken Gold price, while sell-offs in riskier markets tend to favor the precious metal.
The price can move due to a wide range of factors. Geopolitical instability or fears of a deep recession can quickly make Gold price escalate due to its safe-haven status. As a yield-less asset, Gold tends to rise with lower interest rates, while higher cost of money usually weighs down on the yellow metal. Still, most moves depend on how the US Dollar (USD) behaves as the asset is priced in dollars (XAU/USD). A strong Dollar tends to keep the price of Gold controlled, whereas a weaker Dollar is likely to push Gold prices up.
추천 기사


