

EUR/USD Price forecast: Hits lows at 1.1620 on risk aversion, high Oil prices
- EUR/USD decline extends to over one-month lows at 1.1620 amid broad-based US Dollar strength.
- Concerns about the stalled US-Iran conflict and rising bets of Fed rate hikes are boosting the Greenback.
- The Euro struggles as Oil prices above $100 pose a serious threat to the Eurozone's economic growth.
The Euro (EUR) extends its decline against the Dollar (USD) on Friday, falling below 1.1650 for the first time since early April, on track for a 1.2% weekly depreciation. Risk-averse markets, coupled with higher US Treasury yields amid rising bets of Federal Reserve (Fed) rate hikes, and West Texas Intermediate (WTI) Crude Oil price above $100, have created the perfect storm for the Euro.
The Greenback has outperformed its peers this week, fuelled by a mix of concerns about the deadlocked US-Iran conflict and rising US inflation, which have boosted bets on Fed rate hikes in late 2026. Beyond that, the lack of progress in the peace process with Iran has pushed WTI Oil price past the key $100 level, adding pressure on Oil-importing Eurozone economies.
Technical Analysis: Euro bears break key support at 1.1645
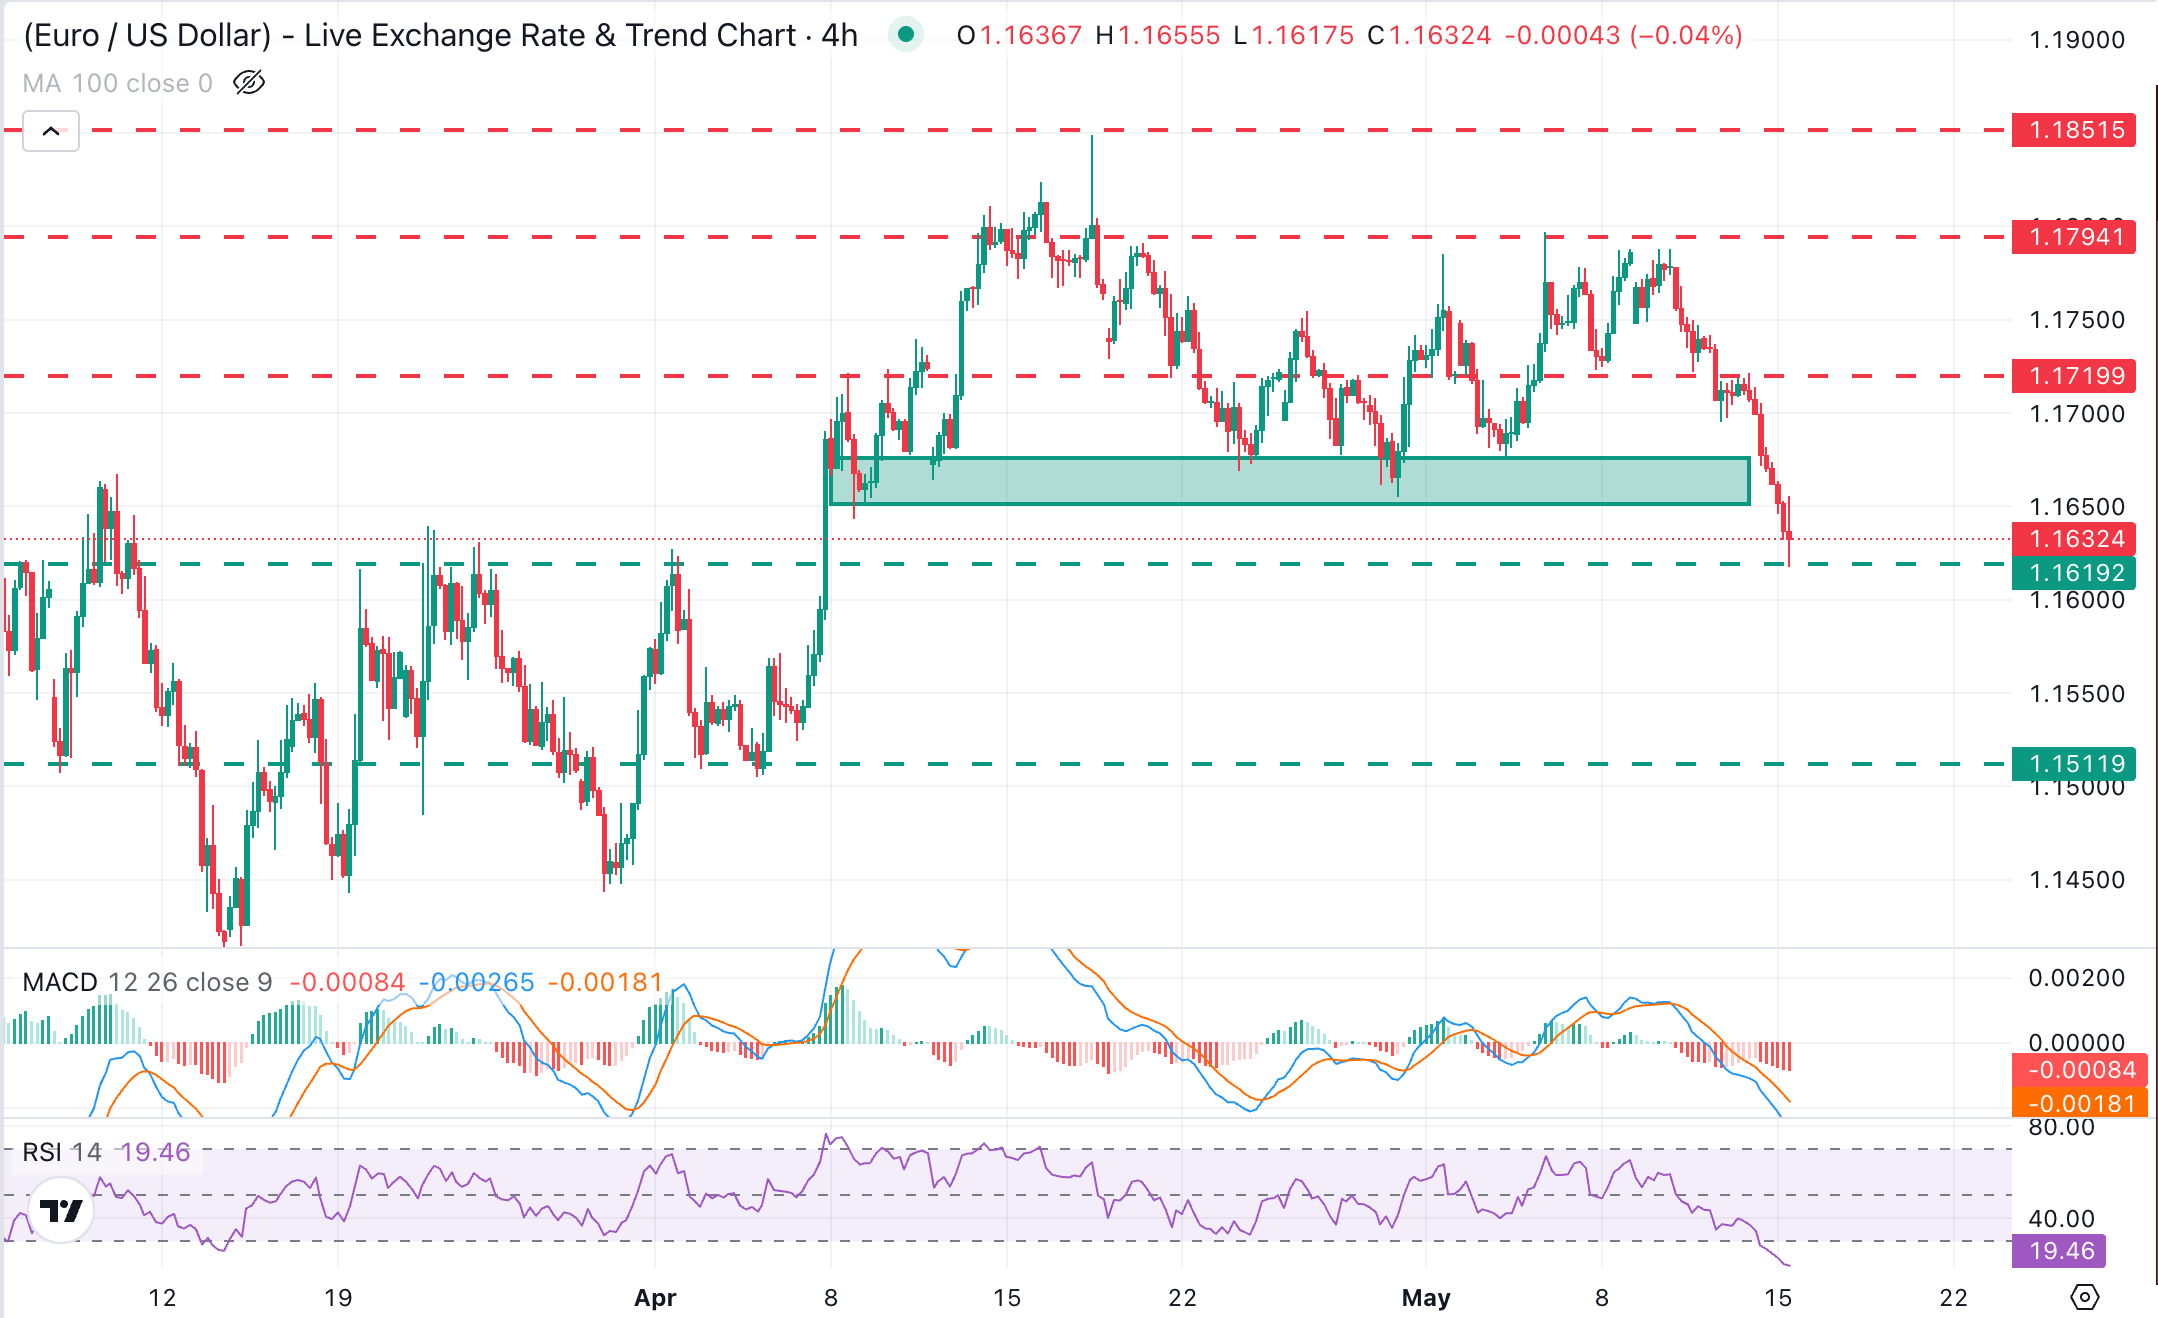
EUR/USD comes under strong bearish pressure on Friday after falling continuously over the last four days. The 4-hour Relative Strength Index (RSI) sits deep in oversold territory, hinting at a stretched downside momentum, as bears retain control. The Moving Average Convergence Divergence (MACD) in the same timeframe remains in negative territory, pointing to prevailing selling pressure.
The pair has found support at a previous resistance area around 1.1620, and the overstretched conditions hint at some consolidation. The pair, however, remains vulnerable while below 1.1645. Further down, there is no clear support area until the early-April lows, right above 1.1500.
A bullish reaction, on the contrary, is likely to meet resistance at Thursday's highs around 1.1720. Further up, the top of the last three weeks' trading range, around 1.1795, and April's peak, at 1.1850. would be the next upside targets.
(The technical analysis of this story was written with the help of an AI tool.)
Risk sentiment FAQs
In the world of financial jargon the two widely used terms “risk-on” and “risk off'' refer to the level of risk that investors are willing to stomach during the period referenced. In a “risk-on” market, investors are optimistic about the future and more willing to buy risky assets. In a “risk-off” market investors start to ‘play it safe’ because they are worried about the future, and therefore buy less risky assets that are more certain of bringing a return, even if it is relatively modest.
Typically, during periods of “risk-on”, stock markets will rise, most commodities – except Gold – will also gain in value, since they benefit from a positive growth outlook. The currencies of nations that are heavy commodity exporters strengthen because of increased demand, and Cryptocurrencies rise. In a “risk-off” market, Bonds go up – especially major government Bonds – Gold shines, and safe-haven currencies such as the Japanese Yen, Swiss Franc and US Dollar all benefit.
The Australian Dollar (AUD), the Canadian Dollar (CAD), the New Zealand Dollar (NZD) and minor FX like the Ruble (RUB) and the South African Rand (ZAR), all tend to rise in markets that are “risk-on”. This is because the economies of these currencies are heavily reliant on commodity exports for growth, and commodities tend to rise in price during risk-on periods. This is because investors foresee greater demand for raw materials in the future due to heightened economic activity.
The major currencies that tend to rise during periods of “risk-off” are the US Dollar (USD), the Japanese Yen (JPY) and the Swiss Franc (CHF). The US Dollar, because it is the world’s reserve currency, and because in times of crisis investors buy US government debt, which is seen as safe because the largest economy in the world is unlikely to default. The Yen, from increased demand for Japanese government bonds, because a high proportion are held by domestic investors who are unlikely to dump them – even in a crisis. The Swiss Franc, because strict Swiss banking laws offer investors enhanced capital protection.
추천 기사


