

Gold stalls below $5,200 as markets brace for US inflation data
- Gold struggles below $5,200 as a firmer US Dollar and higher Treasury yields cap gains.
- Escalating US-Iran war keeps geopolitical tensions elevated.
- Technically, XAU/USD holds above the rising 100-period SMA on the 4-hour chart, keeping the near-term bias mildly bullish.
Gold (XAU/USD) trades with a mild downside bias on Wednesday, failing to build on the previous day’s gains as the US Dollar (USD) rebounds and Treasury yields edge higher ahead of the US inflation data at 12:30 GMT.
At the time of writing, XAU/USD is trading around $5,189, hovering near the upper end of a week-long trading range as buyers struggle to sustain gains above the $5,200 mark.
Investors await US inflation report for fresh monetary policy signals
Economists expect the Consumer Price Index (CPI) to rise 0.3% MoM in February, accelerating from 0.2% in January, while the annual CPI inflation rate is forecast to remain steady at 2.4%.
Core CPI, which excludes volatile food and energy prices, is expected to grow by 0.2% MoM, less than the 0.3% advance seen a month earlier, while the annual core reading is expected to grow at a steady 2.5%.
The data is unlikely to influence the Federal Reserve’s (Fed) interest-rate decision next week, with markets widely expecting rates to remain unchanged. Instead, the report will likely help shape expectations for the Fed’s monetary policy path in the coming months.
US-Iran war puts Strait of Hormuz and global Oil supply in focus
Geopolitical tensions surrounding the ongoing US-Iran conflict remain front and center, with no clear signs of easing as the war enters its 12th day, keeping markets on edge.
The United States (US) and Israel continue to bombard Iranian military targets, while Tehran retaliates with missile and drone attacks against US and Israeli assets across the region.
As the conflict expands, the Strait of Hormuz has become a key focal point. Shipping through the strategic waterway has slowed significantly as security risks increase. The US military said it destroyed 16 Iranian vessels believed to be preparing to lay naval mines near the strait.
Against this backdrop, energy markets remain volatile as traders continue to assess the evolving geopolitical situation and its potential impact on global Oil supply. On Tuesday night, The Wall Street Journal reported that the International Energy Agency (IEA) has proposed the largest release of strategic oil reserves in history, potentially around 400 million barrels, in an effort to combat rising crude prices.
Despite heightened geopolitical uncertainty, Gold has struggled to attract strong safe-haven demand as investors appear to favor the US Dollar for liquidity in times of market stress.
At the same time, fears that a prolonged conflict could keep Oil prices elevated are fueling concerns about global inflation, potentially complicating the Fed’s easing path. This scenario also favors the US Dollar and caps gains in the non-yielding metal.
Technical analysis: XAU/USD consolidates below $5,200
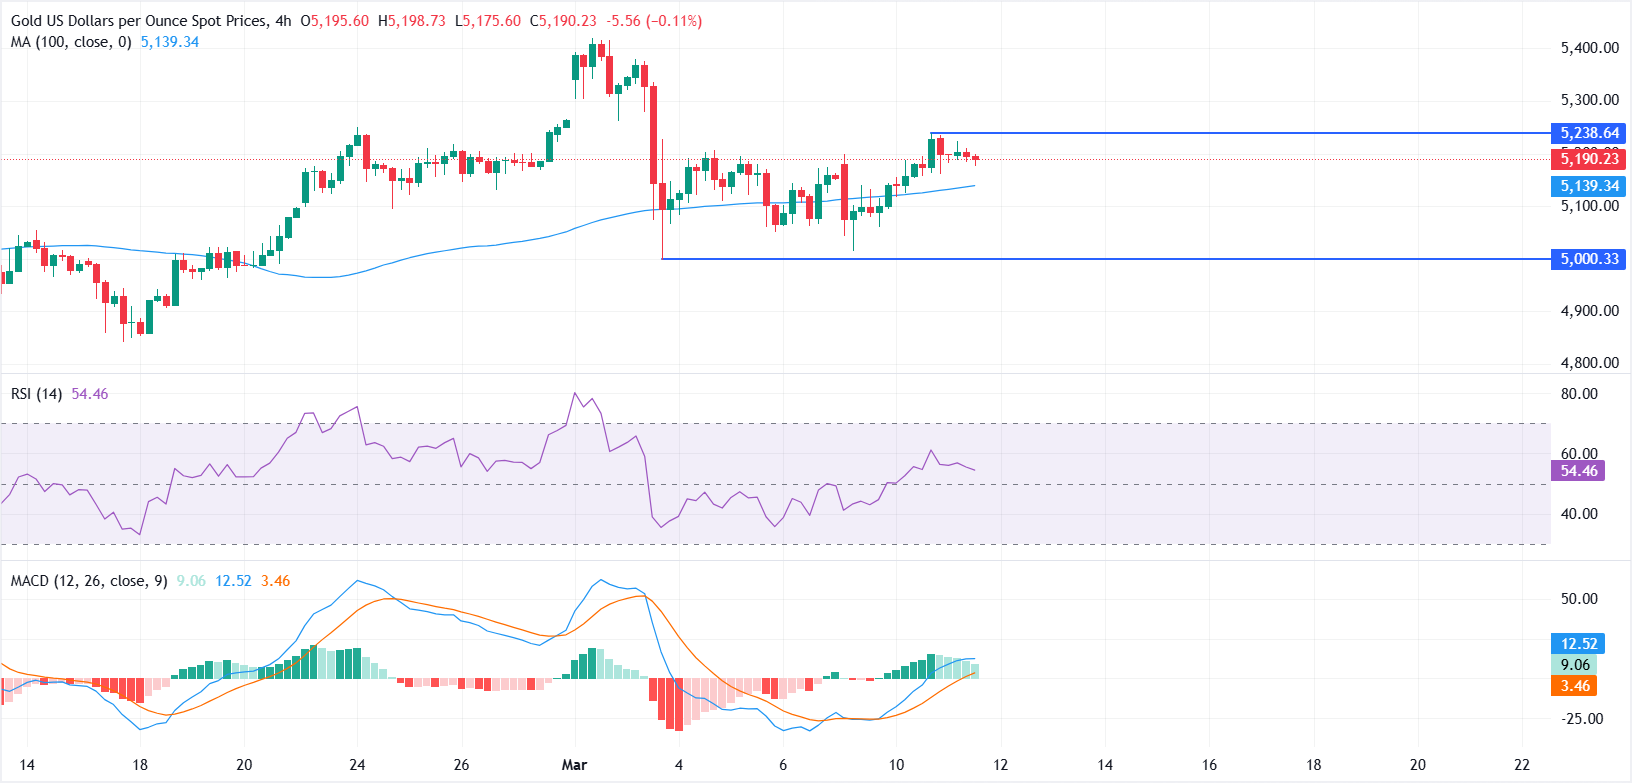
XAU/USD’s near-term bias remains mildly bullish on the 4-hour chart, with the price holding above the rising 100-period Simple Moving Average (SMA) near $5,139. However, upside momentum remains capped for now as sellers continue to defend the $5,200 level, keeping the metal confined within a short-term consolidation range.
The Relative Strength Index (RSI) has eased back to around 53 after peaking above 60, signaling cooling momentum while remaining in positive territory.
Meanwhile, the Moving Average Convergence Divergence (MACD) line remains above its signal line and in positive territory, though the green histogram bars are contracting, hinting at fading upside pressure without yet invalidating the broader upward bias.
Initial support emerges around the 100-period SMA near $5,139, and a sustained hold above this zone would keep buyers in control. A decisive break below this level could weaken the structure and expose the $5,000 psychological level, which aligns with the early-March swing low.
On the upside, $5,200 remains the immediate resistance, followed by Tuesday’s peak near $5,238. A clear break above this barrier would confirm renewed bullish momentum and could open the door for a move toward the $5,400-$5,500 region, marking the next significant resistance zone.
Inflation FAQs
Inflation measures the rise in the price of a representative basket of goods and services. Headline inflation is usually expressed as a percentage change on a month-on-month (MoM) and year-on-year (YoY) basis. Core inflation excludes more volatile elements such as food and fuel which can fluctuate because of geopolitical and seasonal factors. Core inflation is the figure economists focus on and is the level targeted by central banks, which are mandated to keep inflation at a manageable level, usually around 2%.
The Consumer Price Index (CPI) measures the change in prices of a basket of goods and services over a period of time. It is usually expressed as a percentage change on a month-on-month (MoM) and year-on-year (YoY) basis. Core CPI is the figure targeted by central banks as it excludes volatile food and fuel inputs. When Core CPI rises above 2% it usually results in higher interest rates and vice versa when it falls below 2%. Since higher interest rates are positive for a currency, higher inflation usually results in a stronger currency. The opposite is true when inflation falls.
Although it may seem counter-intuitive, high inflation in a country pushes up the value of its currency and vice versa for lower inflation. This is because the central bank will normally raise interest rates to combat the higher inflation, which attract more global capital inflows from investors looking for a lucrative place to park their money.
Formerly, Gold was the asset investors turned to in times of high inflation because it preserved its value, and whilst investors will often still buy Gold for its safe-haven properties in times of extreme market turmoil, this is not the case most of the time. This is because when inflation is high, central banks will put up interest rates to combat it. Higher interest rates are negative for Gold because they increase the opportunity-cost of holding Gold vis-a-vis an interest-bearing asset or placing the money in a cash deposit account. On the flipside, lower inflation tends to be positive for Gold as it brings interest rates down, making the bright metal a more viable investment alternative.
추천 기사


