

WTI Price Forecast: Momentum improves, but downside risks linger below $60
- WTI holds near two-week highs as holiday-thinned trade limits volatility.
- US-Venezuela tensions provide modest support to crude prices.
- Technical indicators show improving momentum, though downside risks remain below the $60 level.
West Texas Intermediate (WTI) Crude Oil trades little changed on Wednesday as markets slip into holiday mode, with prices hovering near two-week highs amid thin liquidity. The US benchmark remains underpinned by rising tensions between the United States and Venezuela, which have added a modest geopolitical risk premium. At the time of writing, WTI is trading around $58.33 per barrel, pausing after a three-day advance.
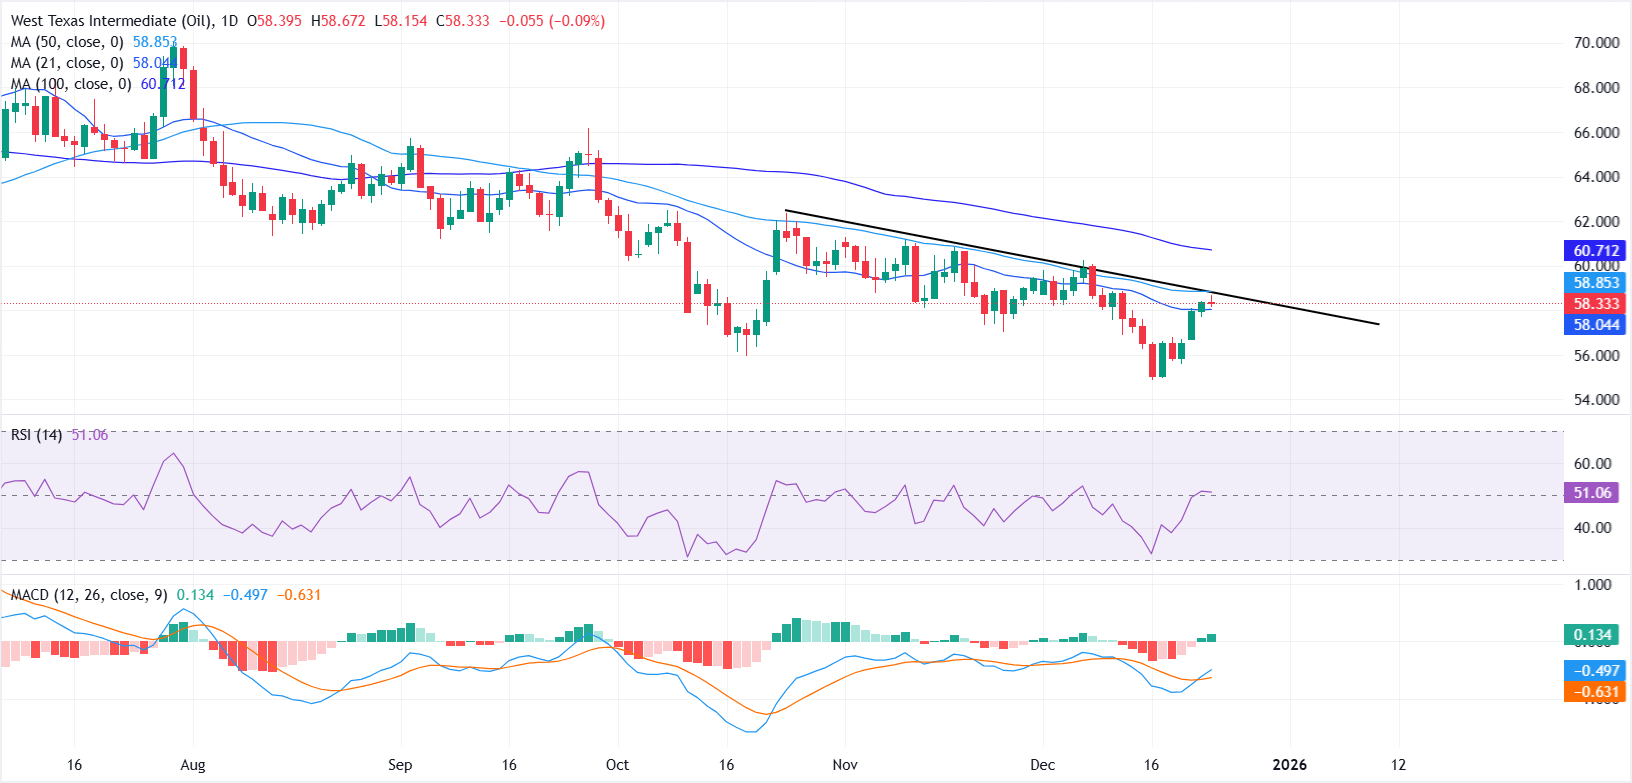
From a technical perspective, the daily chart points to a modest recovery in WTI, with prices reclaiming the 21-day Simple Moving Average (SMA) near $58.04. Buyers re-emerged last week after prices revisited the psychological $55 level, limiting further downside following the test of year-to-date lows.
Despite the improving near-term outlook, the broader trend remains tilted to the downside, with prices down nearly 25% year to date.
On the upside, overhead moving averages could cap gains, with the 50-day SMA near $58.58 acting as immediate resistance. The next hurdle is seen around the $60 psychological level, where the 100-day SMA currently aligns near $60.71. Unless a decisive break above the $60 mark materialises, downside risks are likely to persist.
On the downside, failure to sustain a move above the 21-day SMA could expose initial support near $56.50, followed by the $55.00 round figure. A break below this zone would reopen downside risks toward multi-year lows.
Momentum indicators are starting to turn more constructive. The Relative Strength Index (RSI) hovers near the 50 mark after rebounding from near-oversold levels. The Moving Average Convergence Divergence (MACD) extends above the Signal line and stands in positive territory, with a modestly widening positive histogram hinting at improving bullish momentum.
WTI Oil FAQs
WTI Oil is a type of Crude Oil sold on international markets. The WTI stands for West Texas Intermediate, one of three major types including Brent and Dubai Crude. WTI is also referred to as “light” and “sweet” because of its relatively low gravity and sulfur content respectively. It is considered a high quality Oil that is easily refined. It is sourced in the United States and distributed via the Cushing hub, which is considered “The Pipeline Crossroads of the World”. It is a benchmark for the Oil market and WTI price is frequently quoted in the media.
Like all assets, supply and demand are the key drivers of WTI Oil price. As such, global growth can be a driver of increased demand and vice versa for weak global growth. Political instability, wars, and sanctions can disrupt supply and impact prices. The decisions of OPEC, a group of major Oil-producing countries, is another key driver of price. The value of the US Dollar influences the price of WTI Crude Oil, since Oil is predominantly traded in US Dollars, thus a weaker US Dollar can make Oil more affordable and vice versa.
The weekly Oil inventory reports published by the American Petroleum Institute (API) and the Energy Information Agency (EIA) impact the price of WTI Oil. Changes in inventories reflect fluctuating supply and demand. If the data shows a drop in inventories it can indicate increased demand, pushing up Oil price. Higher inventories can reflect increased supply, pushing down prices. API’s report is published every Tuesday and EIA’s the day after. Their results are usually similar, falling within 1% of each other 75% of the time. The EIA data is considered more reliable, since it is a government agency.
OPEC (Organization of the Petroleum Exporting Countries) is a group of 12 Oil-producing nations who collectively decide production quotas for member countries at twice-yearly meetings. Their decisions often impact WTI Oil prices. When OPEC decides to lower quotas, it can tighten supply, pushing up Oil prices. When OPEC increases production, it has the opposite effect. OPEC+ refers to an expanded group that includes ten extra non-OPEC members, the most notable of which is Russia.
추천 기사


