

Gold Price Forecast: XAU/USD ticks up to near $3,360, wobbles around 20-day EMA
- Gold price edges up to near $3,360 as US bond yields decline significantly.
- Traders raise Fed’s interest rate cut bets after the US CPI report release.
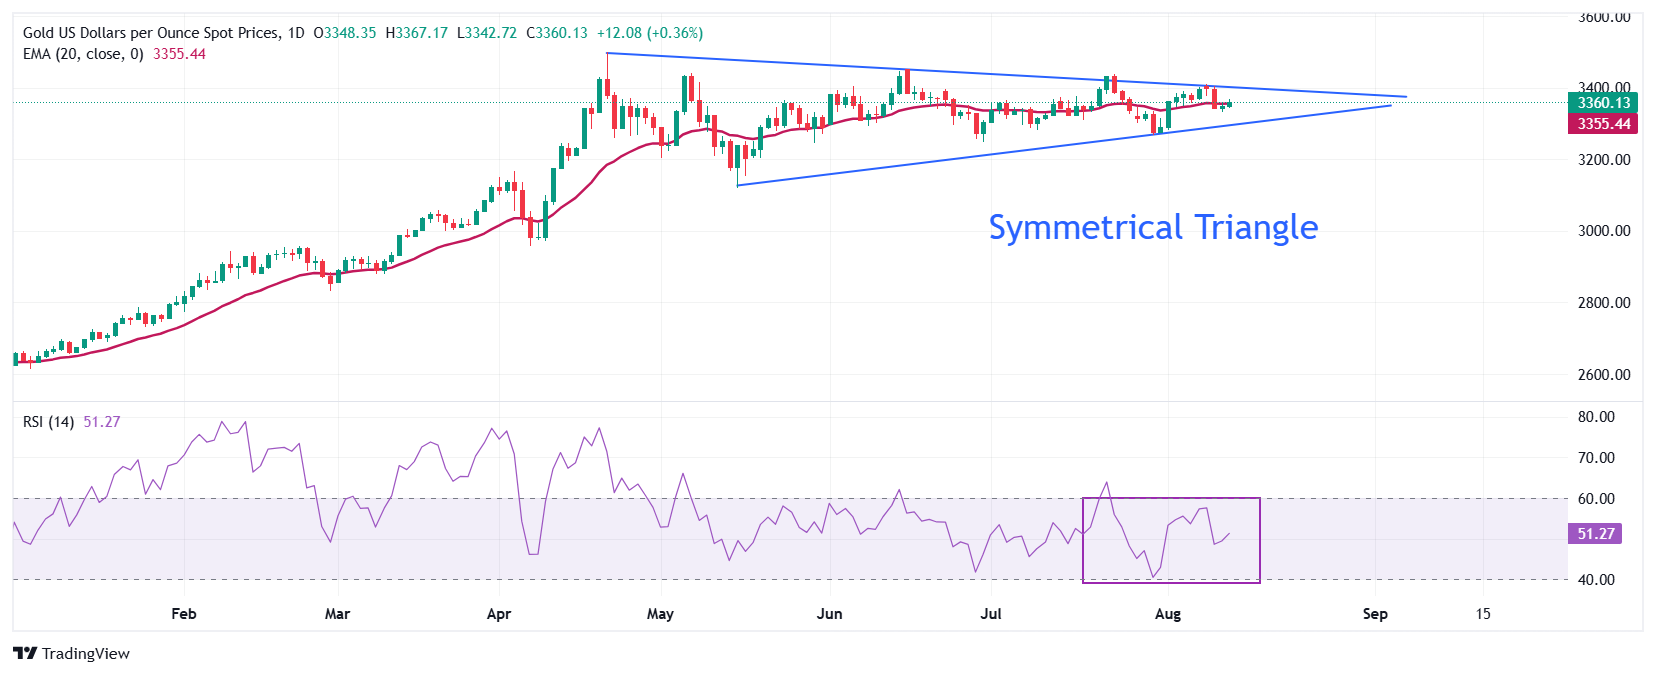
- Gold price continues to trade inside the Symmetrical Triangle formation.
Gold price (XAU/USD) trades marginally higher to near $3,360.00 during the European trading session on Wednesday. The yellow metal edges higher as United States (US) Treasury yields plunge due to escalating speculation about the Federal Reserve (Fed) to resume the monetary-expansion cycle from the September monetary policy meeting.
10-year US Treasury yields are down 1.2% to near 4.26%. Lower yields on interest-bearing assets improve the appeal of non-yielding assets, such as Gold.
Financial market participants have increased bets supporting interest rate cuts by the Fed in the policy meeting next month as the US Consumer Price Index (CPI) report for July didn’t show any signs pointing to further flow of the tariff impact into prices. June’s CPI report showed that prices of goods that are largely imported into the US have increased.
According to the CME FedWatch tool, the probability of the fed to cut interest rates in the September meeting has increased to 94% from almost 86% recorded on Monday.
Meanwhile, weakness in the US Dollar (USD) has also supported the Gold price. Technically, lower US Dollar makes the Gold price an attractive bet for investors.
Gold technical analysis
Gold price trades in a Symmetrical Triangle formation, which indicates a sharp volatility contraction. The upper border of the above-mentioned chart pattern is plotted from the April 22 high around $3,500, while the downward border is placed from the May 15 low near $3,180.86
The yellow metal corrects to near the 20-day Exponential Moving Average (EMA) around $3,357.00.
The 14-day Relative Strength Index (RSI) oscillates inside the 40.00-60.00 range, suggesting indecisiveness among market participants.
Looking down, the Gold price would fall towards the round-level support of $3,200 and the May 15 low at $3,121, if it breaks below the May 29 low of $3,245
Alternatively, the Gold price will enter an uncharted territory if it breaks above the psychological level of $3,500 decisively. Potential resistances would be $3,550 and $3,600.
Gold daily chart
Gold FAQs
Gold has played a key role in human’s history as it has been widely used as a store of value and medium of exchange. Currently, apart from its shine and usage for jewelry, the precious metal is widely seen as a safe-haven asset, meaning that it is considered a good investment during turbulent times. Gold is also widely seen as a hedge against inflation and against depreciating currencies as it doesn’t rely on any specific issuer or government.
Central banks are the biggest Gold holders. In their aim to support their currencies in turbulent times, central banks tend to diversify their reserves and buy Gold to improve the perceived strength of the economy and the currency. High Gold reserves can be a source of trust for a country’s solvency. Central banks added 1,136 tonnes of Gold worth around $70 billion to their reserves in 2022, according to data from the World Gold Council. This is the highest yearly purchase since records began. Central banks from emerging economies such as China, India and Turkey are quickly increasing their Gold reserves.
Gold has an inverse correlation with the US Dollar and US Treasuries, which are both major reserve and safe-haven assets. When the Dollar depreciates, Gold tends to rise, enabling investors and central banks to diversify their assets in turbulent times. Gold is also inversely correlated with risk assets. A rally in the stock market tends to weaken Gold price, while sell-offs in riskier markets tend to favor the precious metal.
The price can move due to a wide range of factors. Geopolitical instability or fears of a deep recession can quickly make Gold price escalate due to its safe-haven status. As a yield-less asset, Gold tends to rise with lower interest rates, while higher cost of money usually weighs down on the yellow metal. Still, most moves depend on how the US Dollar (USD) behaves as the asset is priced in dollars (XAU/USD). A strong Dollar tends to keep the price of Gold controlled, whereas a weaker Dollar is likely to push Gold prices up.
추천 기사


