
EUR/JPY wobbles below the 173.10 highs after Japan’s elections
- The Euro fell against the Yen immediately after the release of the Japanese election results.
- Investors seem relieved by hopes that Prime Minister Ishiba might remain in power.
- EUR/JPY is showing signs of exhaustion after a six-week rally.
The Euro found support at 172.00 and regained some of the ground lost against the Japanese Yen on the early Asian Session. The pair, however, seems unable to return to Friday’s top, above 173.00, and technical indicators are showing signs of a potential correction, after having rallied for the last six weeks.
The Yen has reacted positively to the outcome of the Japanese elections. Prime Minister Ishiba´s ruling coalition has lost its majority in the upper house, but only by three seats, thus he might be able to remain in power and pass legislation with the support of minority parties.
Investors seem to be relieved by the fact that the opposition party and its lower-taxes agenda can be avoided and that the current administration will continue negotiating a trade deal with the US, as the August 1 deadline approaches
EUR/JPY: Potential double top above 173.10
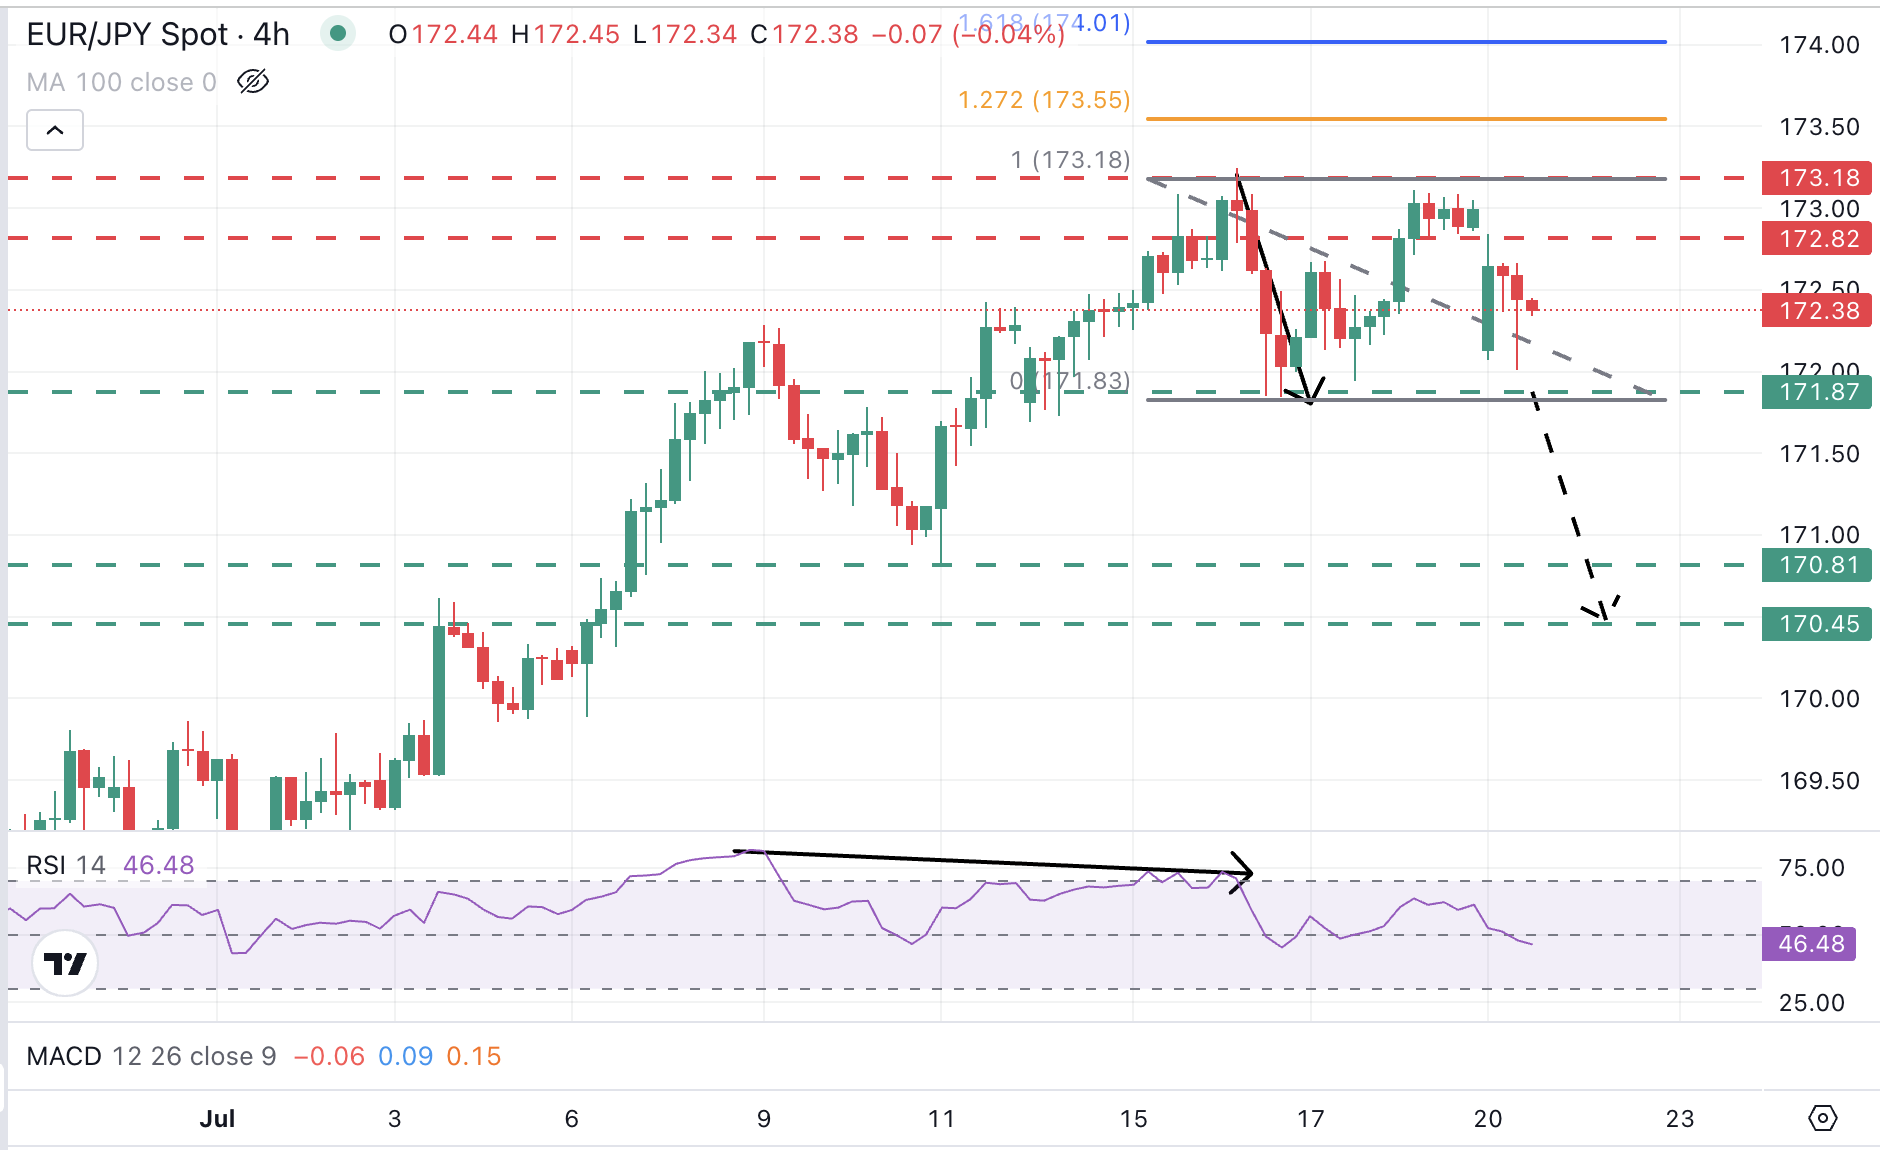
From a technical standpoint, the EUR/JPY pair is giving signs of exhaustion after having rallied continuously for a month and a half. A potential double top at the 173.10-173.25 area (July 16,18 highs), although the neckline at 171.90 seems a significant support area.
The pair is now trading halfway through the range of the last few days, but the bearish divergence in the 4-hour chart adds to the case for a deeper correction.
A break of the mentioned 171.90 neckline (July 16 low) brings the July 11 low, at 171.80, to the focus. The target of the DT pattern is a previous resistance area at 170.45.
On the upside, resistance is at the 1.7280 intra-day high, above 173,25 (Jul 16 high), the bearish view is cancelled and the focus shifts to the 161.8% Fibonacci extension of last week’s pullback, at 174.00.
Japanese Yen PRICE Today
The table below shows the percentage change of Japanese Yen (JPY) against listed major currencies today. Japanese Yen was the strongest against the New Zealand Dollar.
| USD | EUR | GBP | JPY | CAD | AUD | NZD | CHF | |
|---|---|---|---|---|---|---|---|---|
| USD | -0.08% | -0.19% | 0.04% | 0.06% | 0.10% | 0.28% | -0.08% | |
| EUR | 0.08% | -0.04% | 0.12% | 0.12% | 0.13% | 0.17% | -0.04% | |
| GBP | 0.19% | 0.04% | -0.04% | 0.21% | 0.21% | 0.43% | 0.20% | |
| JPY | -0.04% | -0.12% | 0.04% | 0.02% | 0.09% | 0.18% | 0.05% | |
| CAD | -0.06% | -0.12% | -0.21% | -0.02% | 0.10% | 0.22% | -0.18% | |
| AUD | -0.10% | -0.13% | -0.21% | -0.09% | -0.10% | 0.11% | -0.04% | |
| NZD | -0.28% | -0.17% | -0.43% | -0.18% | -0.22% | -0.11% | -0.23% | |
| CHF | 0.08% | 0.04% | -0.20% | -0.05% | 0.18% | 0.04% | 0.23% |
The heat map shows percentage changes of major currencies against each other. The base currency is picked from the left column, while the quote currency is picked from the top row. For example, if you pick the Japanese Yen from the left column and move along the horizontal line to the US Dollar, the percentage change displayed in the box will represent JPY (base)/USD (quote).
추천 기사


