
Australian Dollar remains strong despite a weaker-than-expected Monthly CPI
- The Australian Dollar extends gains due to the Israel-Iran ceasefire.
- Australia’s Monthly Consumer Price Index increased by 2.1% YoY in May, against the expected 2.3% rise and the 2.4% prior.
- Fed Chair Powell advocated for delaying rate cuts, likely until sometime in the fourth quarter.
The Australian Dollar (AUD) extends its gains for the third successive session on Wednesday. The AUD/USD pair remains stronger following the release of Australia’s Monthly Consumer Price Index (CPI), which climbed by 2.1% year-over-year in May. The inflation came in softer than market expectations of a 2.3% rise and the 2.4% prior, easing after remaining consistent for three successive months.
Australia’s softer inflation data, along with recent weaker-than-expected GDP figures, reinforces expectations of the Reserve Bank of Australia’s (RBA) rate cut in July. Markets are now pricing in an 80% probability of a 25 basis points (bps) rate cut by the RBA next month. Traders are also expecting a total of 73 bps interest rate cuts by the end of the year.
The AUD also receives support from improved risk appetite amid easing tensions in the Middle East. US President Donald Trump announced that a ceasefire between Iran and Israel had taken effect, raising hopes for an end to the 12-day conflict. However, caution lingered amid uncertainty over the ceasefire’s durability. Traders will likely focus on the potential revival of nuclear talks and the fate of Iran’s enriched uranium.
Australian Dollar advances as US Dollar remains subdued amid improved risk appetite
- The US Dollar Index (DXY), which measures the value of the US Dollar against six major currencies, is trading lower at around 97.90 at the time of writing. Investors will keep an eye on Federal Reserve (Fed) Chair Jerome Powell’s testimony later on Wednesday.
- Fed Chair Powell highlighted during his testimony before the congressional budget committee on Tuesday, strengthening his case for delaying rate cuts, likely until sometime in the fourth quarter. Powell added, “When the time is right, expect rate cuts to continue.” He also said that data suggests that at least some of the tariffs will hit consumers and will start to see more tariff inflation starting in June.
- Fed’s Powell reaffirmed his stance that policymakers should avoid rushing to adjust interest rates, contradicting recent comments from Fed Governors Christopher Waller and Michelle Bowman, who said that the two would be open to lowering rates as soon as July.
- Fed’s Vice Chair for Supervision Michelle Bowman noted on Monday that the time to cut interest rates is getting nearer as risks to the job market may be on the rise. Bowman also highlighted that inflation appears to be on a sustained path back to 2% and she is less concerned that tariffs will cause an inflation problem.
- Fed Governor Christopher Waller noted on Friday that the US central bank could start easing monetary policy as soon as next month, signaling flexibility amid global economic uncertainty and rising geopolitical risks.
- The US Fed decided to keep the interest rate steady at 4.5% in June as widely expected. The Federal Open Market Committee (FOMC) still sees around 50 basis points of interest rate cuts through the end of 2025.
- S&P Global Australia Manufacturing Purchasing Managers Index remained consistent at a 51.0 reading in June. Meanwhile, the Services PMI edged higher to 51.3 from the previous reading of 50.6, while the Composite PMI improved to 51.2 in June from 50.5 prior.
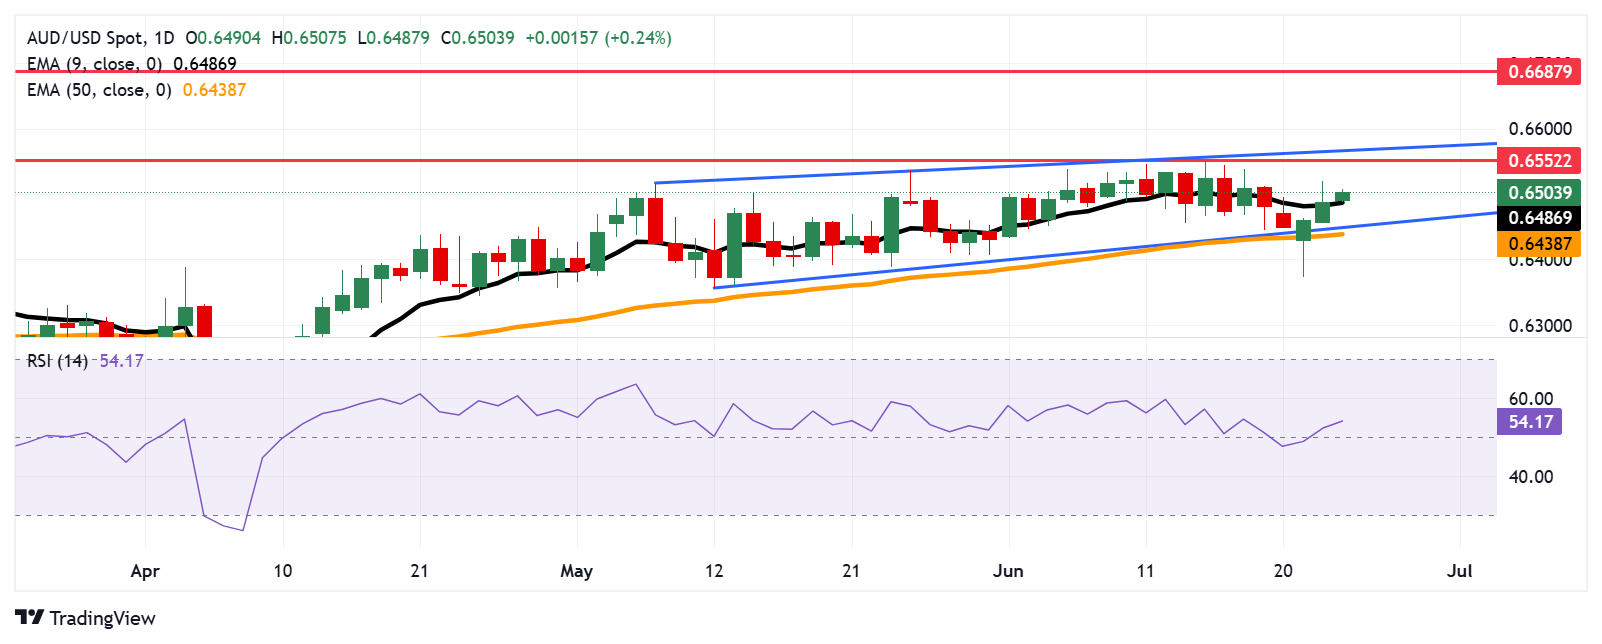
Australian Dollar moves above 0.6500, nine-day EMA
AUD/USD is trading around 0.6510 on Wednesday. The technical analysis of the daily suggests a persistent bullish bias as the pair remains within the ascending channel pattern. The 14-day Relative Strength Index (RSI) remains slightly above the 50 mark. Additionally, the pair has moved above the nine-day Exponential Moving Average (EMA), indicating that short-term price momentum is strengthening.
On the upside, the AUD/USD pair may explore the region around the seven-month high of 0.6552, which was recorded on June 16, followed by the ascending channel’s upper boundary around 0.6570.
The immediate support appears at the nine-day EMA of 0.6486. A break below this level would weaken the short-term price momentum and put downward pressure on the AUD/USD pair to test the lower boundary of the ascending channel around 0.6450, aligned with the 50-day EMA at 0.6438.
AUD/USD: Daily Chart
Australian Dollar PRICE Today
The table below shows the percentage change of Australian Dollar (AUD) against listed major currencies today. Australian Dollar was the strongest against the US Dollar.
| USD | EUR | GBP | JPY | CAD | AUD | NZD | CHF | |
|---|---|---|---|---|---|---|---|---|
| USD | -0.17% | -0.10% | -0.16% | 0.06% | -0.25% | -0.40% | -0.12% | |
| EUR | 0.17% | 0.09% | 0.00% | 0.20% | -0.12% | -0.25% | 0.05% | |
| GBP | 0.10% | -0.09% | -0.10% | 0.14% | -0.18% | -0.33% | -0.00% | |
| JPY | 0.16% | 0.00% | 0.10% | 0.18% | -0.07% | -0.20% | 0.09% | |
| CAD | -0.06% | -0.20% | -0.14% | -0.18% | -0.25% | -0.34% | -0.14% | |
| AUD | 0.25% | 0.12% | 0.18% | 0.07% | 0.25% | -0.21% | 0.17% | |
| NZD | 0.40% | 0.25% | 0.33% | 0.20% | 0.34% | 0.21% | 0.33% | |
| CHF | 0.12% | -0.05% | 0.00% | -0.09% | 0.14% | -0.17% | -0.33% |
The heat map shows percentage changes of major currencies against each other. The base currency is picked from the left column, while the quote currency is picked from the top row. For example, if you pick the Australian Dollar from the left column and move along the horizontal line to the US Dollar, the percentage change displayed in the box will represent AUD (base)/USD (quote).
Economic Indicator
Monthly Consumer Price Index (YoY)
The Monthly Consumer Price Index (CPI), released by the Australian Bureau of Statistics on a monthly basis, measures the changes in the price of a fixed basket of goods and services acquired by household consumers. The indicator was developed to provide inflation data at a higher frequency than the quarterly CPI. The YoY reading compares prices in the reference month to the same month a year earlier. A high reading is seen as bullish for the Australian Dollar (AUD), while a low reading is seen as bearish.
Read more.Last release: Wed Jun 25, 2025 01:30
Frequency: Monthly
Actual: 2.1%
Consensus: 2.3%
Previous: 2.4%
Source: Australian Bureau of Statistics
추천 기사


