
USD/CHF Price Forecast: Struggles around 0.8200
- USD/CHF slumps to near 0.8200 ahead of US-China trade talks.
- The SNB is expected to cut interest rates in the policy meeting on June 19.
- Investors await the US CPI data for fresh cues on the Federal Reserve’s (Fed) monetary policy outlook.
The USD/CHF pair slides over 0.2% during European trading hours on Monday and struggles to hold the key level of 0.8200. The Swiss Franc pair weakens as the US Dollar underperforms across the board ahead of the meeting between trade negotiators from the United States (US) and China in London during the day.
The US Dollar Index (DXY), which gauges the Greenback’s value against six major currencies, slumps to near 98.85.
Ahead of the US-China trade talks, President Donald Trump has expressed confidence that discussions would go very well.
On the economic front, investors await the US Consumer Price Index (CPI) data for May, which will be released on Wednesday. As measured by the CPI, inflationary pressures are expected to have grown at a faster pace than previously reported in April.
Though investors have underpinned the Swiss Franc against the US Dollar, it is underperforming its other peers on firm expectations that the Swiss National Bank (SNB) will reduce interest rates in the policy meeting next week.
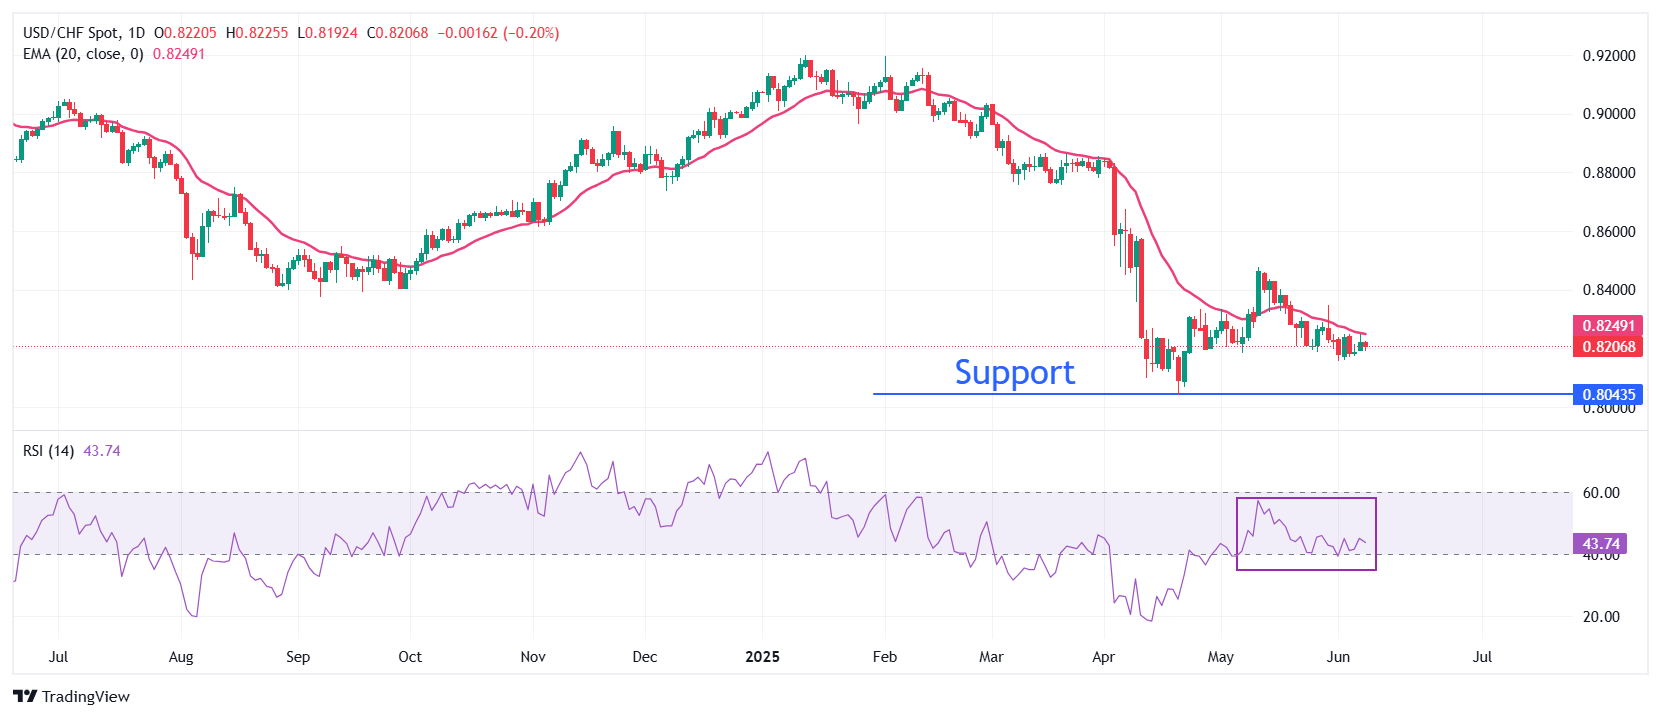
USD/CHF faces selling pressure near the 20-day Exponential Moving Average (EMA), which trades around 0.8250.
The 14-day Relative Strength Index (RSI) strives to hold the 40.00. A fresh bearish momentum would activate if the RSI falls below that level.
The asset could slide towards the April 11 low of 0.8100 and the April 21 low of 0.8040 if it skids below the June 2 low of 0.8157.
On the contrary, a recovery move in the pair above the psychological level of 0.8500 will open the door for more upside towards the April 10 high of 0.8580 and the April 8 high of 0.8611.
USD/CHF daily chart
US Dollar FAQs
The US Dollar (USD) is the official currency of the United States of America, and the ‘de facto’ currency of a significant number of other countries where it is found in circulation alongside local notes. It is the most heavily traded currency in the world, accounting for over 88% of all global foreign exchange turnover, or an average of $6.6 trillion in transactions per day, according to data from 2022. Following the second world war, the USD took over from the British Pound as the world’s reserve currency. For most of its history, the US Dollar was backed by Gold, until the Bretton Woods Agreement in 1971 when the Gold Standard went away.
The most important single factor impacting on the value of the US Dollar is monetary policy, which is shaped by the Federal Reserve (Fed). The Fed has two mandates: to achieve price stability (control inflation) and foster full employment. Its primary tool to achieve these two goals is by adjusting interest rates. When prices are rising too quickly and inflation is above the Fed’s 2% target, the Fed will raise rates, which helps the USD value. When inflation falls below 2% or the Unemployment Rate is too high, the Fed may lower interest rates, which weighs on the Greenback.
In extreme situations, the Federal Reserve can also print more Dollars and enact quantitative easing (QE). QE is the process by which the Fed substantially increases the flow of credit in a stuck financial system. It is a non-standard policy measure used when credit has dried up because banks will not lend to each other (out of the fear of counterparty default). It is a last resort when simply lowering interest rates is unlikely to achieve the necessary result. It was the Fed’s weapon of choice to combat the credit crunch that occurred during the Great Financial Crisis in 2008. It involves the Fed printing more Dollars and using them to buy US government bonds predominantly from financial institutions. QE usually leads to a weaker US Dollar.
Quantitative tightening (QT) is the reverse process whereby the Federal Reserve stops buying bonds from financial institutions and does not reinvest the principal from the bonds it holds maturing in new purchases. It is usually positive for the US Dollar.
추천 기사


