

USD/CAD Price Forecast: More downside towards 1.3600 looks likely
- USD/CAD trades vulnerably near 1.3650 as the US Dollar sees more downside on disappointing an array of US economic data.
- US-China trade uncertainty also keeps the USD on the backfoot.
- The BoC kept interest rates steady at 2.75% on Wednesday, as expected.
The USD/CAD pair appears vulnerable near an over eight-month low, slightly above 1.3650 during Asian trading hours on Thursday. The Loonie pair stays under pressure as the US Dollar (USD) remains on backfoot amid renewed United States (US) stagflation risks and trade uncertainty.
The US Dollar Index (DXY), which tracks the Greenback’s value against six major currencies, trades cautiously near the six-week low around 98.60.
On Thursday, disappointing private sector employment and ISM Services Purchasing Managers’ index (PMI) data for May exhibited softening labor demand, declining service sector activity, and rising input costs, a scenario that typically pushes the economy into a stagflation.
Meanwhile, trade uncertainty between the US and China has escalated after President Donald Trump signaled in a post on Truth.Social that negotiations with XI Jinping are a hard nut to crack.
In the Canadian economy, the Bank of Canada’s (BoC) decision to hold interest rates steady at 2.75% and its discouraging comments on any near-term monetary policy adjustments have strengthened the Canadian Dollar (CAD). The BoC left its key borrowing rates steady at 2.75% on Wednesday, as expected.
Canadian Dollar PRICE Today
The table below shows the percentage change of Canadian Dollar (CAD) against listed major currencies today. Canadian Dollar was the strongest against the Japanese Yen.
| USD | EUR | GBP | JPY | CAD | AUD | NZD | CHF | |
|---|---|---|---|---|---|---|---|---|
| USD | 0.06% | 0.06% | 0.14% | -0.00% | 0.01% | 0.05% | 0.06% | |
| EUR | -0.06% | 0.05% | 0.10% | -0.03% | -0.04% | -0.07% | 0.03% | |
| GBP | -0.06% | -0.05% | 0.08% | -0.09% | -0.07% | -0.13% | -0.03% | |
| JPY | -0.14% | -0.10% | -0.08% | -0.15% | -0.18% | -0.19% | -0.08% | |
| CAD | 0.00% | 0.03% | 0.09% | 0.15% | -0.02% | -0.04% | 0.06% | |
| AUD | -0.01% | 0.04% | 0.07% | 0.18% | 0.02% | -0.06% | 0.05% | |
| NZD | -0.05% | 0.07% | 0.13% | 0.19% | 0.04% | 0.06% | 0.12% | |
| CHF | -0.06% | -0.03% | 0.03% | 0.08% | -0.06% | -0.05% | -0.12% |
The heat map shows percentage changes of major currencies against each other. The base currency is picked from the left column, while the quote currency is picked from the top row. For example, if you pick the Canadian Dollar from the left column and move along the horizontal line to the US Dollar, the percentage change displayed in the box will represent CAD (base)/USD (quote).
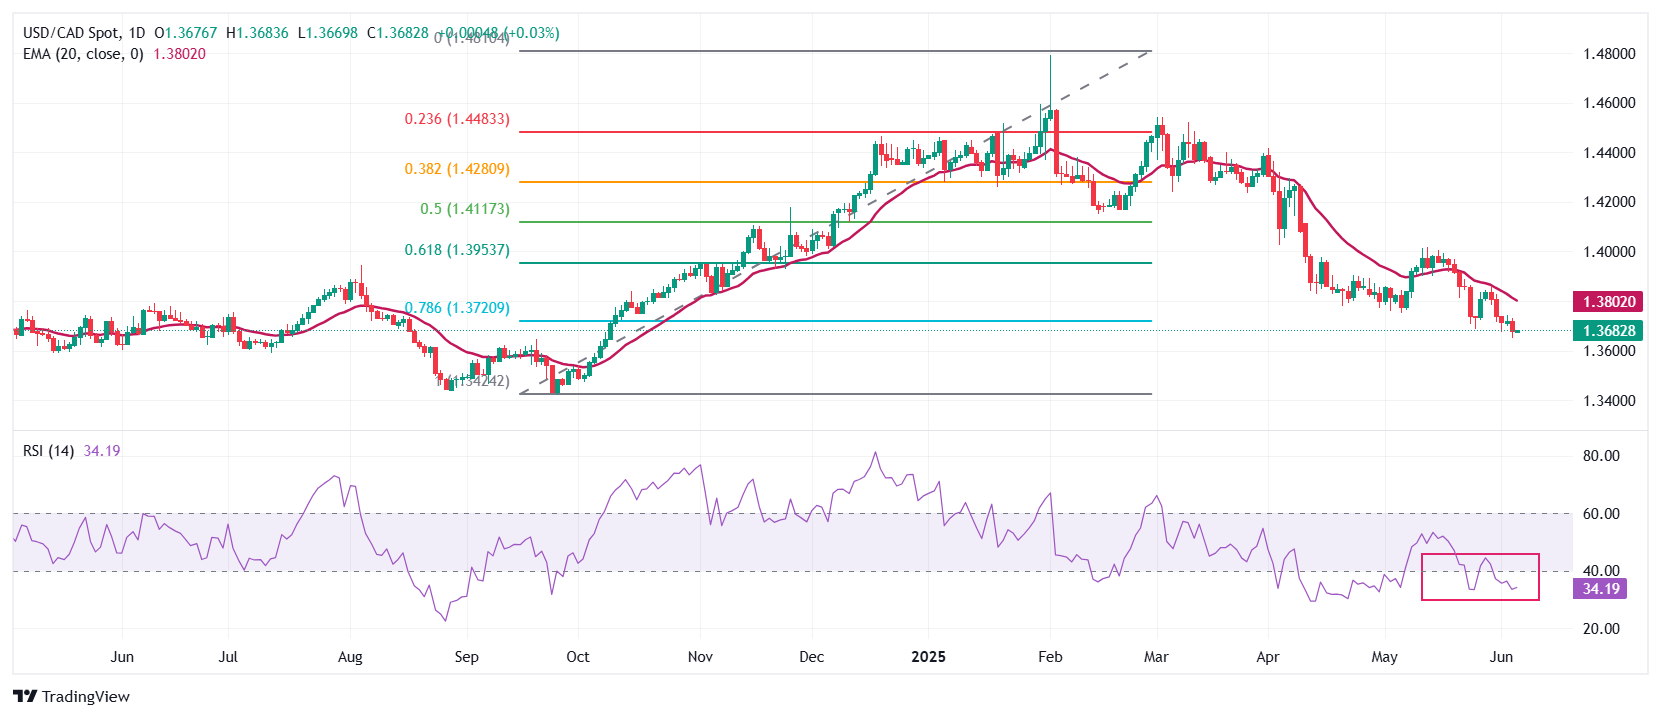
USD/CAD has retraced over 78.6% of the swing plotted from the late September low around 1.3400 to the early February high near 1.4800. Typically, a retracement over 61.8% accelerates the downside move to the end of the swing.
Declining 20-day Exponential Moving Average (EMA) near 1.3800 reflects that the near-term trend is bearish.
The 14-day Relative Strength Index (RSI) slides to near 33.00, indicating a strong bearish momentum.
More downside in the pair looks likely below Wednesday’s low of 1.3650, which would drag it towards the round level of 1.3600 and the psychological figure of 1.3500.
In an alternate scenario, a recovery move above the May 29 high of 1.3820 would turn the near-term trend bullish and open the door towards the May 21 high of 1.3920, followed by the May 15 high of 1.4000.
USD/CAD daily chart
US Dollar FAQs
The US Dollar (USD) is the official currency of the United States of America, and the ‘de facto’ currency of a significant number of other countries where it is found in circulation alongside local notes. It is the most heavily traded currency in the world, accounting for over 88% of all global foreign exchange turnover, or an average of $6.6 trillion in transactions per day, according to data from 2022. Following the second world war, the USD took over from the British Pound as the world’s reserve currency. For most of its history, the US Dollar was backed by Gold, until the Bretton Woods Agreement in 1971 when the Gold Standard went away.
The most important single factor impacting on the value of the US Dollar is monetary policy, which is shaped by the Federal Reserve (Fed). The Fed has two mandates: to achieve price stability (control inflation) and foster full employment. Its primary tool to achieve these two goals is by adjusting interest rates. When prices are rising too quickly and inflation is above the Fed’s 2% target, the Fed will raise rates, which helps the USD value. When inflation falls below 2% or the Unemployment Rate is too high, the Fed may lower interest rates, which weighs on the Greenback.
In extreme situations, the Federal Reserve can also print more Dollars and enact quantitative easing (QE). QE is the process by which the Fed substantially increases the flow of credit in a stuck financial system. It is a non-standard policy measure used when credit has dried up because banks will not lend to each other (out of the fear of counterparty default). It is a last resort when simply lowering interest rates is unlikely to achieve the necessary result. It was the Fed’s weapon of choice to combat the credit crunch that occurred during the Great Financial Crisis in 2008. It involves the Fed printing more Dollars and using them to buy US government bonds predominantly from financial institutions. QE usually leads to a weaker US Dollar.
Quantitative tightening (QT) is the reverse process whereby the Federal Reserve stops buying bonds from financial institutions and does not reinvest the principal from the bonds it holds maturing in new purchases. It is usually positive for the US Dollar.
추천 기사


