
Meme coins to watch: Dogecoin and Shiba Inu prepare to take off with bullish divergence at play
- Dogecoin recovers gradually on Friday after a sharp fall amid a broader crypto market correction.
- Shiba Inu mimics the segment leader, preparing for a quick recovery over the weekend.
- The technical outlook shares a possibility of a wedge breakout in the top meme coins fueled by bullish RSI divergences.
Meme coins market capitalization has dropped by over 5% to $56.34 billion in the last 24 hours, with top names such as Dogecoin (DOGE) and Shiba Inu (SHIB) declining further in a falling wedge pattern. However, the technical outlook and derivatives data support a strong possibility of recovery in the coming days.
Dogecoin and Shiba Inu follow similar paths
Dogecoin edges higher by almost 3% at press time on Friday, reaching a trading price of $0.1763. Shrugging off the nearly 10% drop on Thursday, the meme coin is taking a bullish reversal within a falling wedge pattern.
A resistance trendline, formed by peaks on May 23, May 25, and June 5, converges with a support trendline, connected by lows on May 20, May 31, and June 5, to complete the wedge pattern.
The Relative Strength Index (RSI) at 32 resurfaces above the oversold zone in the 4-hour chart, making a higher low compared to the price bottoms on May 31 and June 5. This indicates a bullish divergence, increasing the chances of a reversal.
Considering the recovery gains traction, Dogecoin must close above the overhead trendline near the $0.1832 resistance level to overcome the bearish grip. Further up, a breakout rally could find opposition at the 50-day EMA at $0.1946, followed by the 200-day EMA at $0.2039.
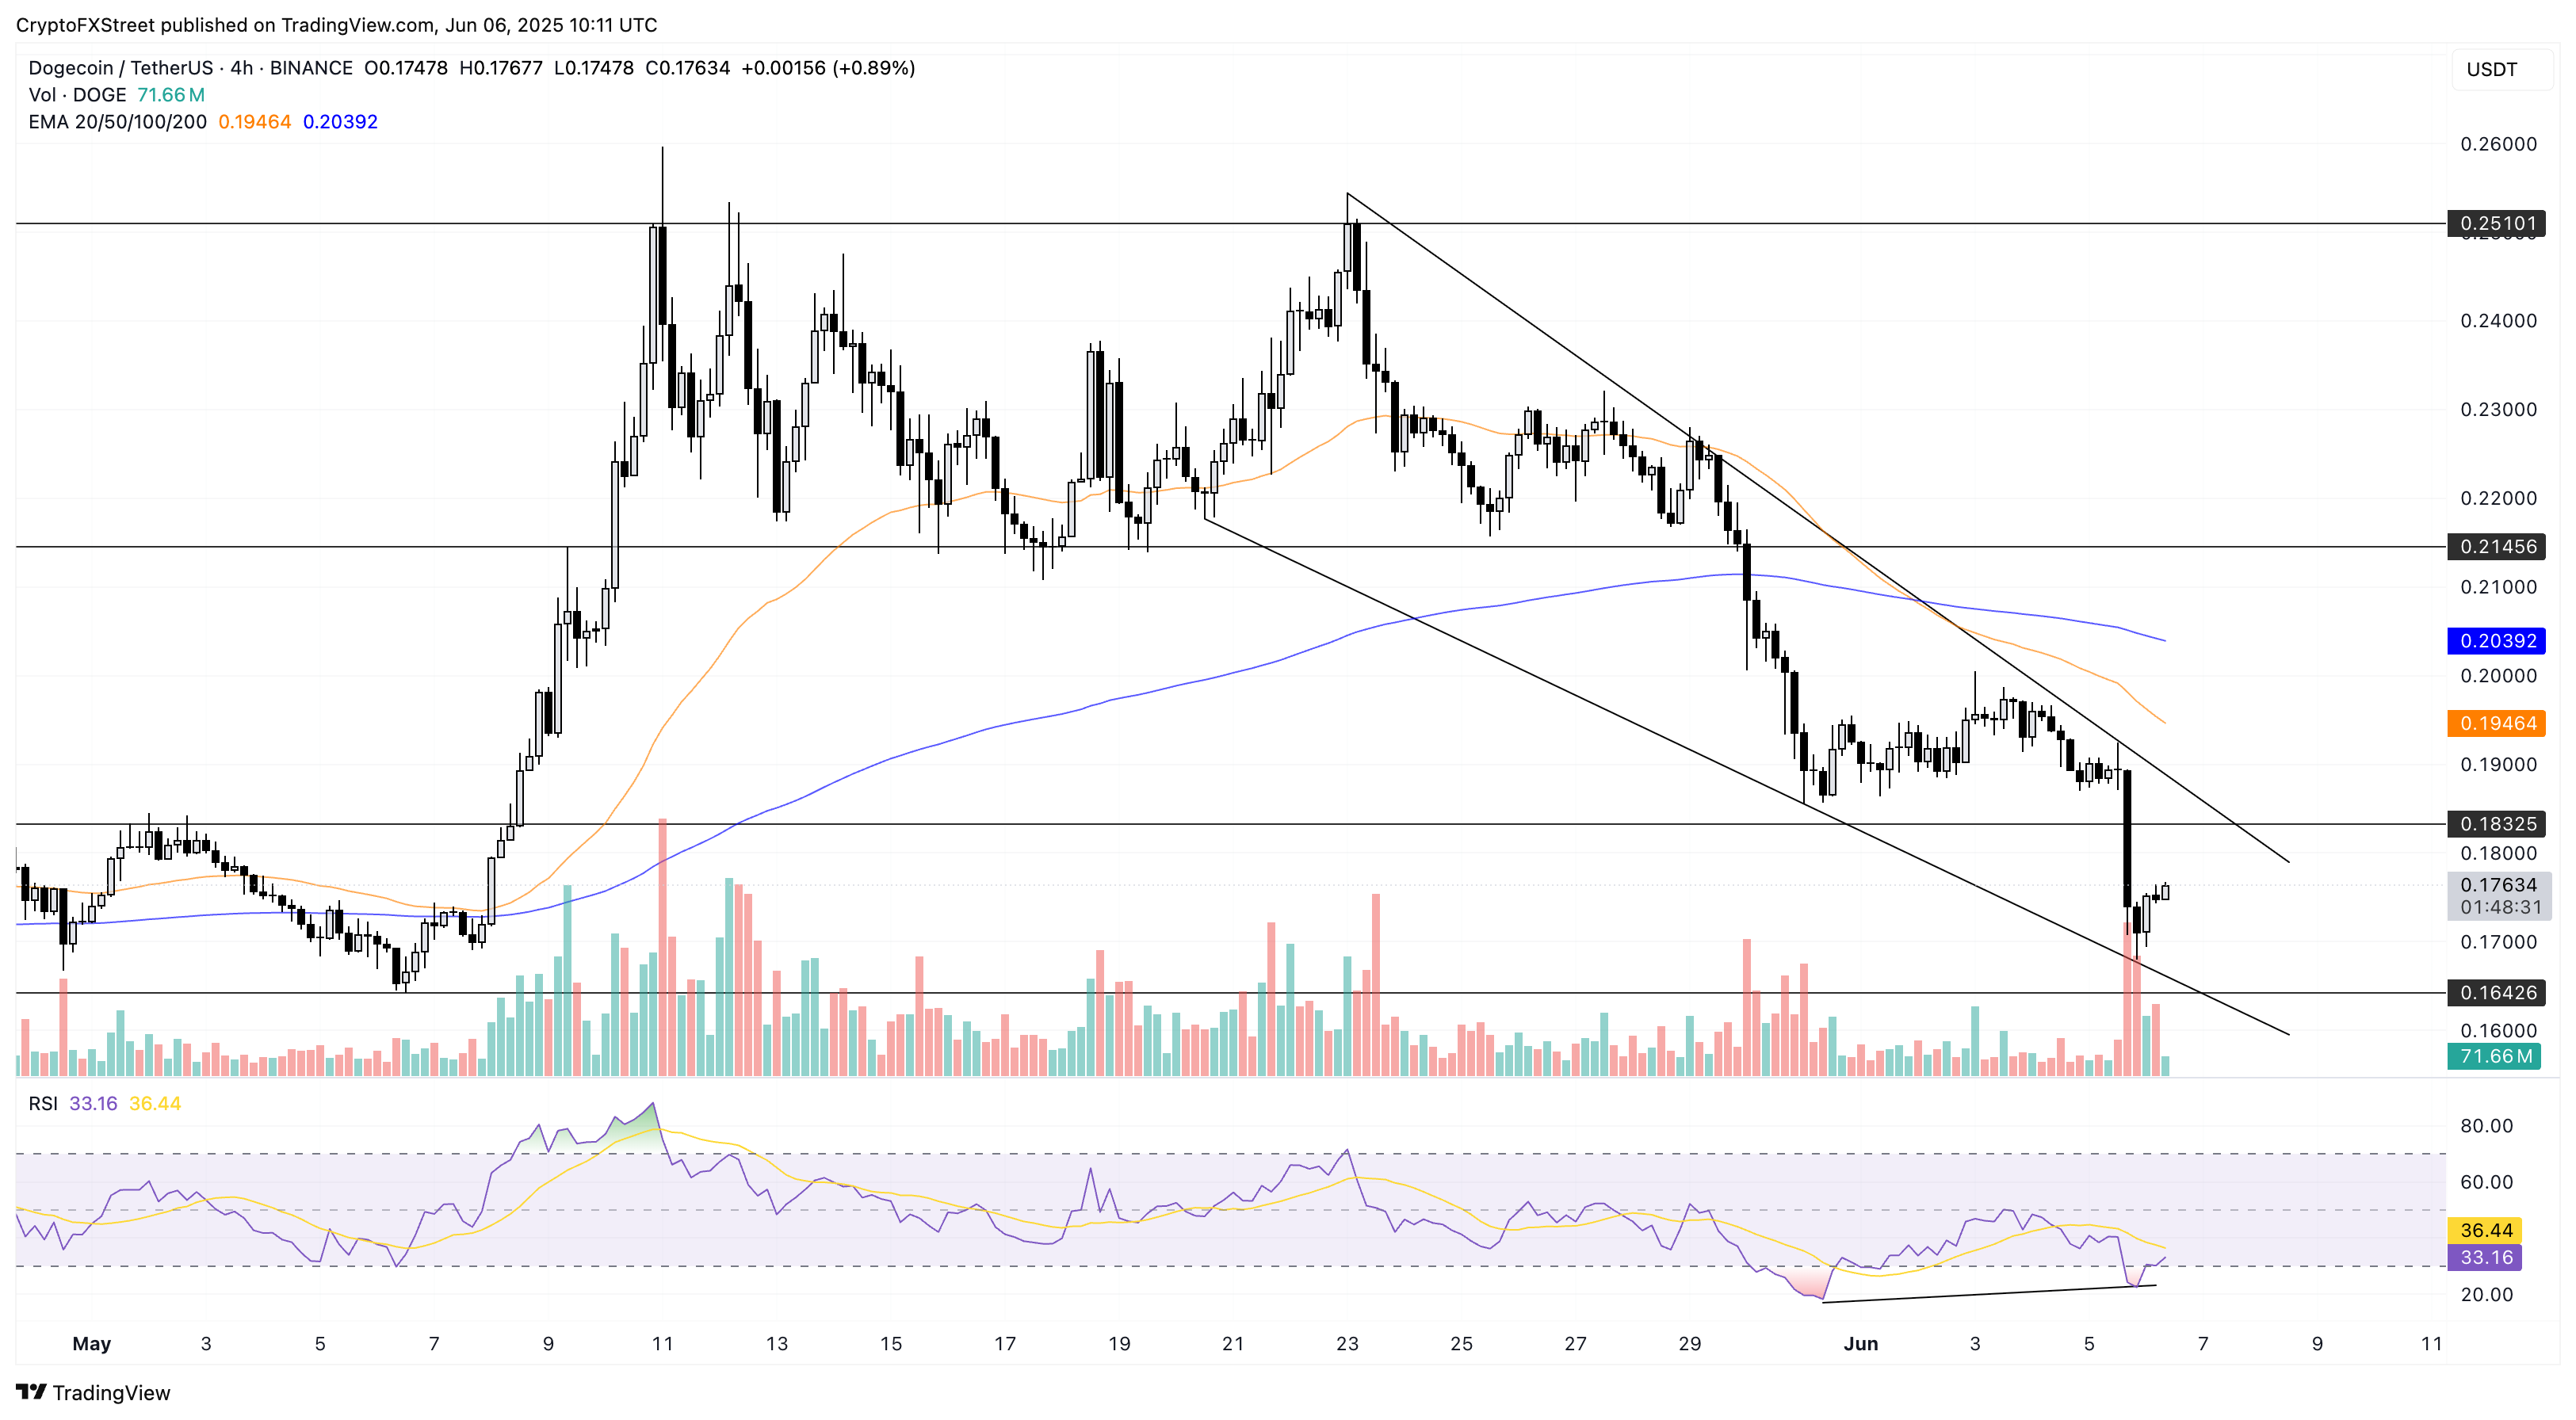
DOGE/USDT 4-hour price chart. Source: Tradingview
However, a bearish continuation in DOGE could test the $0.1642 support level, the May 6 low.
Similarly, Shiba Inu recovers 3% to trade at $0.00001238 at press time on Friday, following a 6.32% fall the previous day. The price action fluctuates within a falling wedge formed by peaks at May 23, May 29, and June 5 and lows of May 13, May 19, and May 31.
The RSI indicator at 37 in the 4-hour chart supports the bullish reversal chances in SHIB as it surfaces from the oversold zone with a higher low formation diverging from the price drop between May 31 and June 5.
A bullish turnaround in the meme coin could challenge the overhead trendline near $0.00001280 (Thursday’s opening price). In the event of a breakout rally, the 50-day EMA at $0.00001306 and the 200-day EMA at $0.00001375 could serve as dynamic resistance.
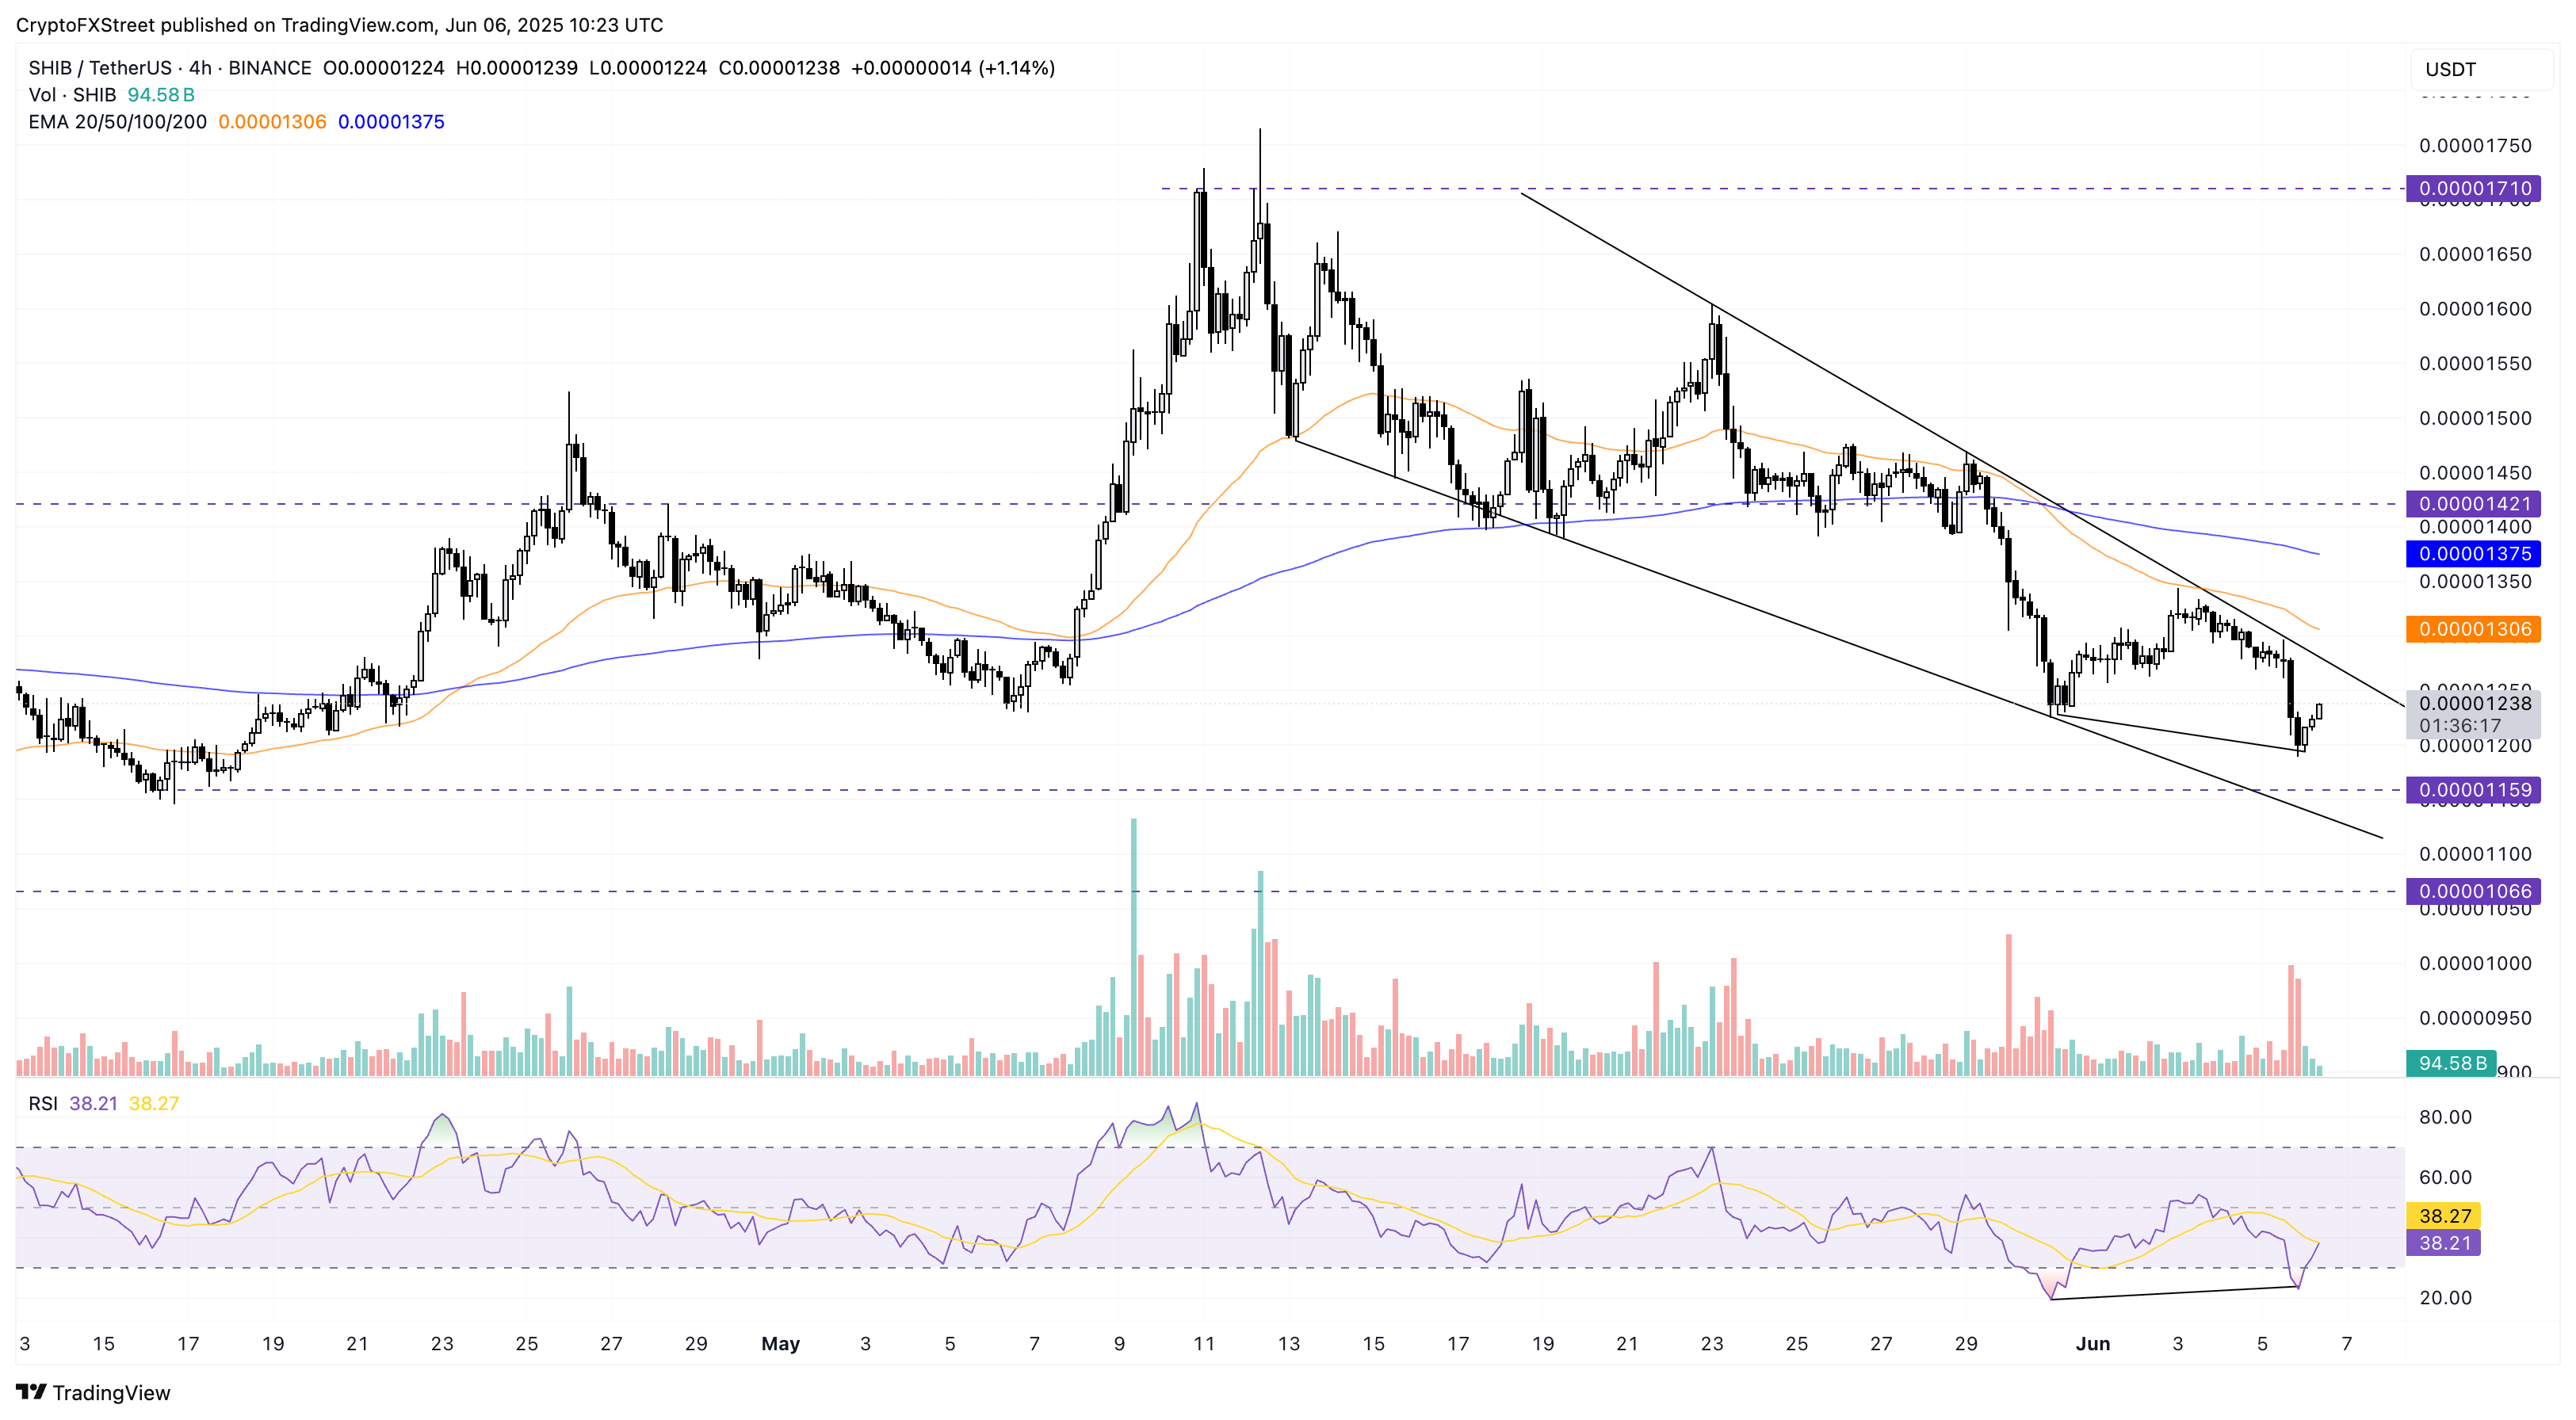
SHIB/USDT 4-hour price chart. Source: Tradingview
On the contrary, a bearish continuation could find support at the $0.00001159 level, the swing low formed on April 16.
Long liquidations halt for DOGE and SHIB
According to Coinglass, the Dogecoin liquidations over the last 12 hours consist of $1.13 million in short liquidations and $183K in long liquidations. This reflects a short recovery compared to the 24-hour liquidations, with $23.78 million of long liquidations and $3.42 million in short liquidations.
With the increased wipeout of bullish players, the number of short positions surges, resulting in a long/short positions ratio falling to 0.9194. Meanwhile, the Open Interest (OI) plunges 6.31% to $1.94 billion as traders exit the derivatives market.
Notably, the OI-weighted funding rate in DOGE has flipped positive to 0.0006%, signaling increased bullish activity. Positive funding rates are paid by bulls to bears in order to keep the swap prices aligned with spot prices.
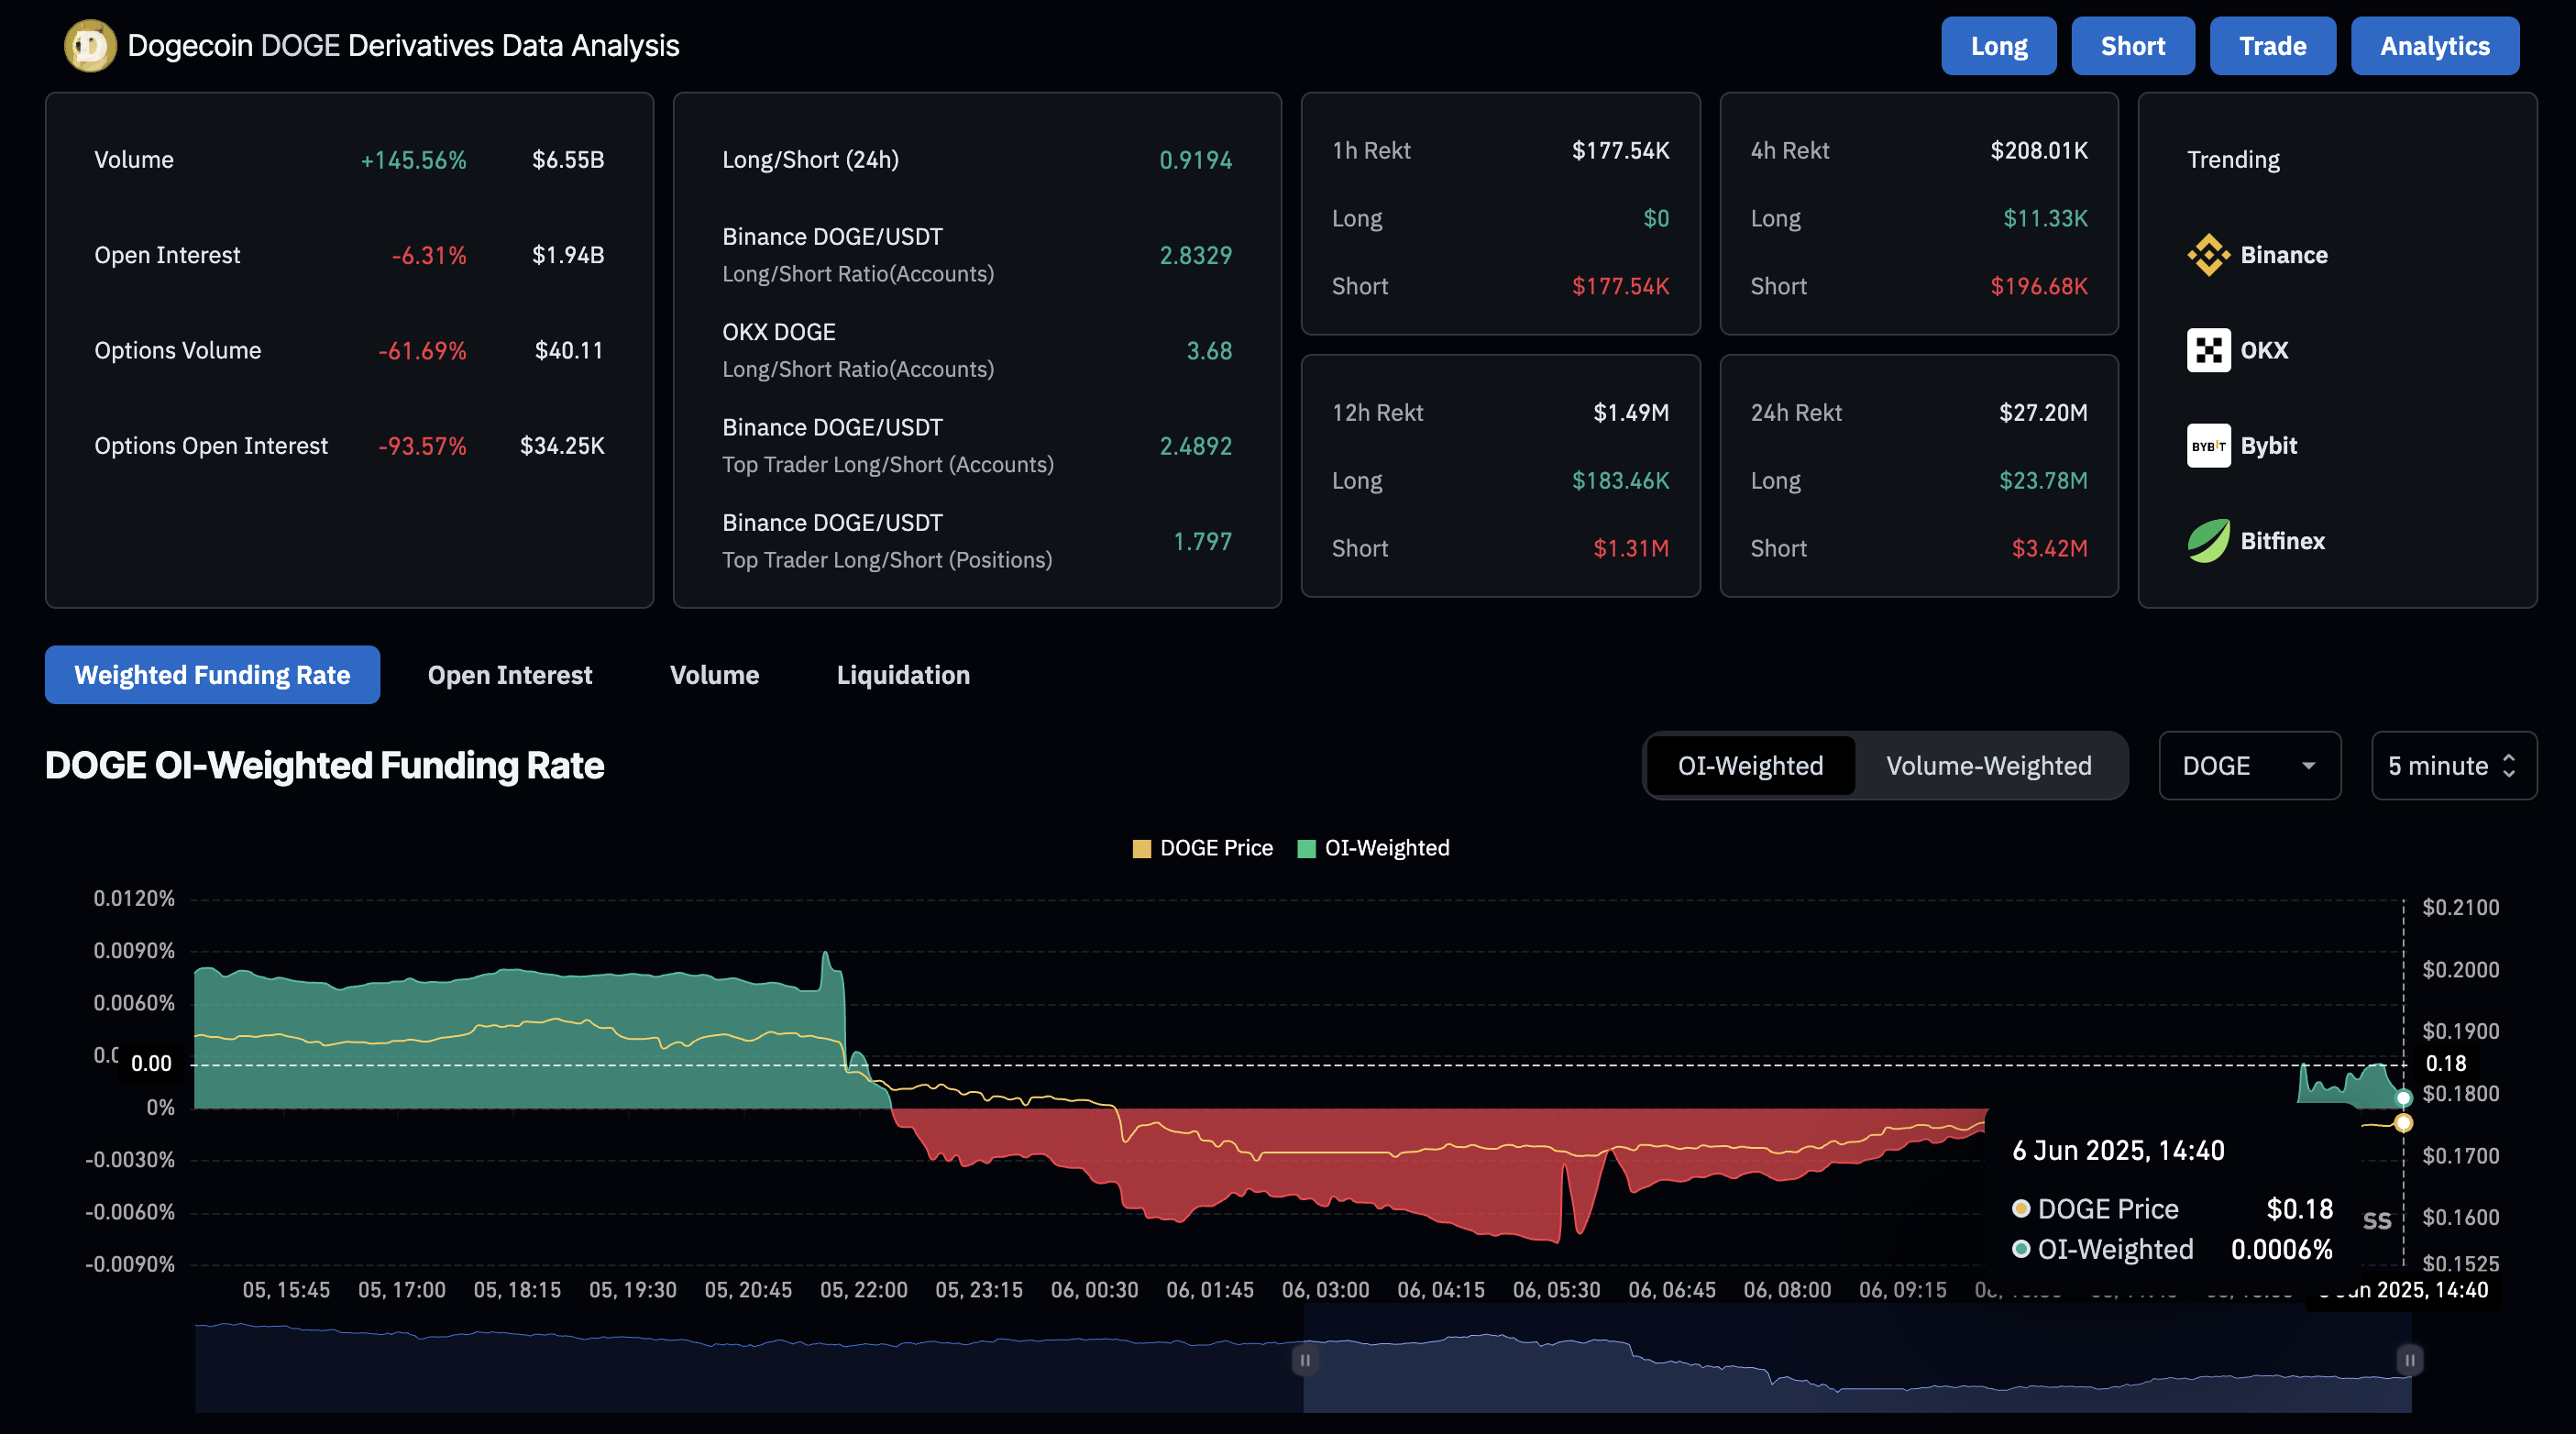
Dogecoin derivatives data. Source: Coinglass
Similarly, Shiba Inu OI witnessed an 11% drop to $143.26 million while the OI-weighted funding rate flips positive to 0.0035%.
The liquidations data showcase a drop in long liquidations from $718K in 24 hours to under $800 in 12 hours. On the other hand, the short liquidations remain significantly high at $14.85K in 12 hours, while the 24-hour liquidation stands at $50.69K.
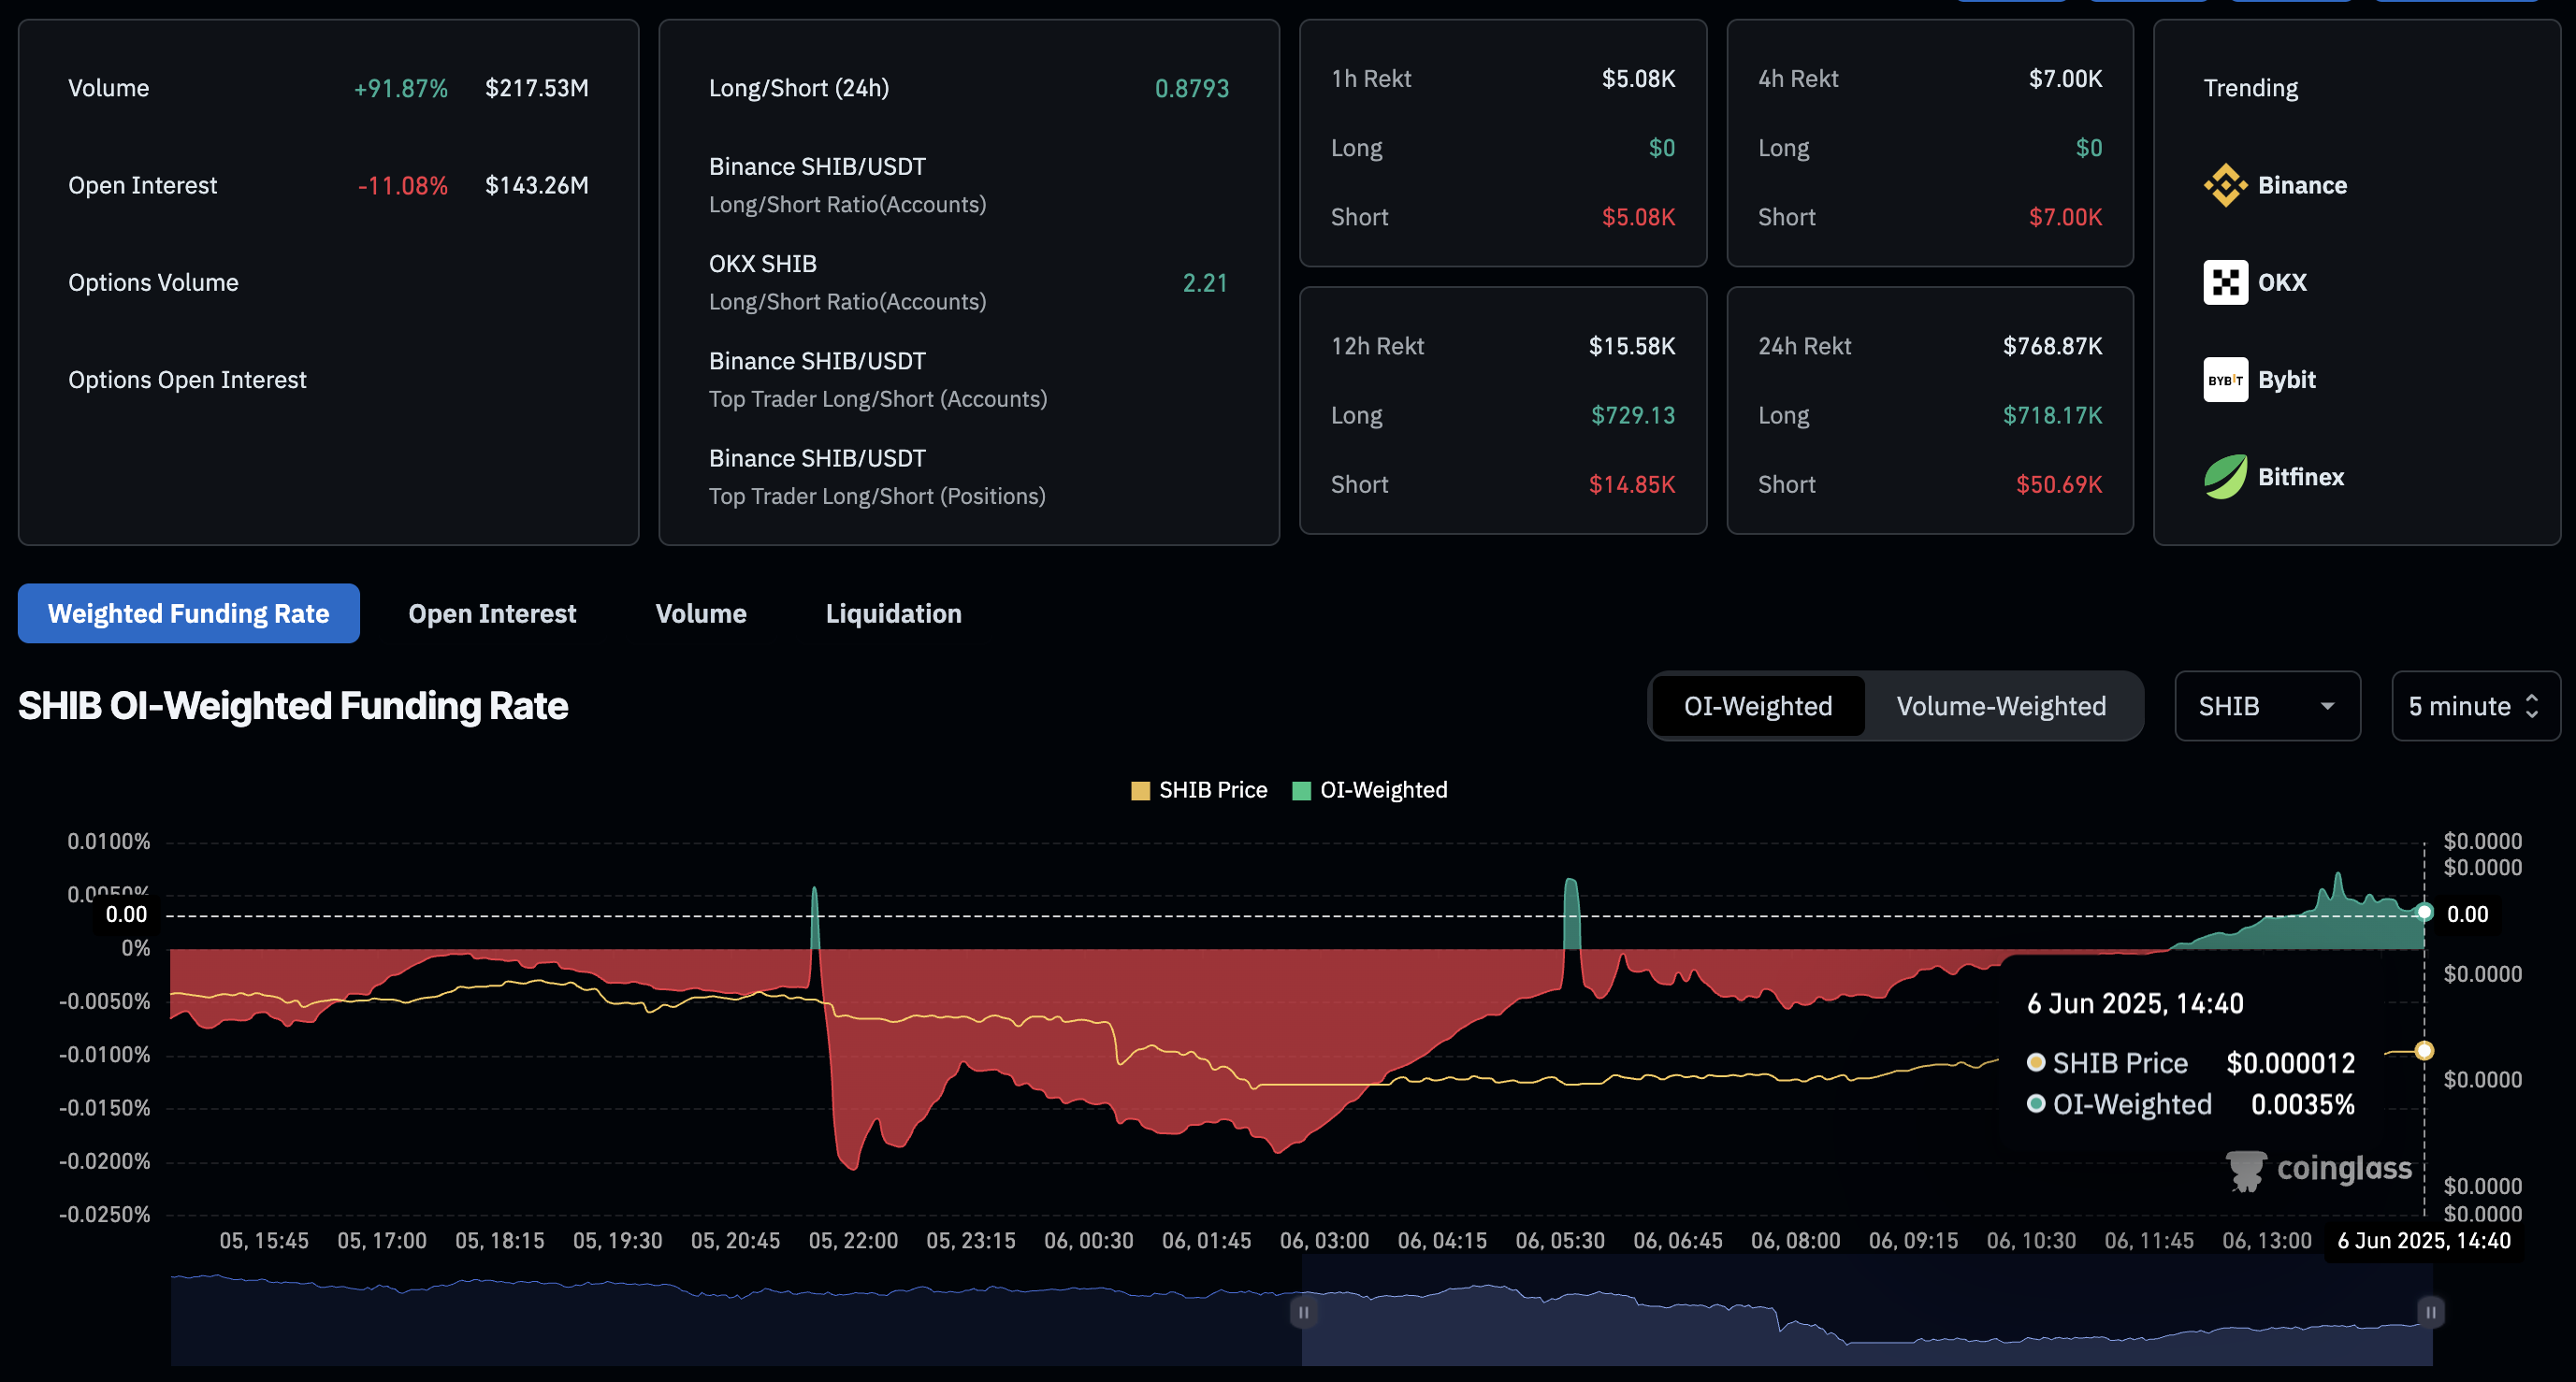
Shiba Inu derivatives data. Source: Coinglass
추천 기사


