
EUR/JPY Price Forecast: Tests support zone near 162.50, ascending channel’s lower boundary
- EUR/JPY is likely to encounter initial resistance around the nine-day EMA at 163.41.
- The 14-day RSI has moved below the 50 mark, indicating a strengthening bearish bias.
- Key support appears near the ascending channel’s lower boundary around 162.50, with additional support at the 50-day EMA at 162.23.
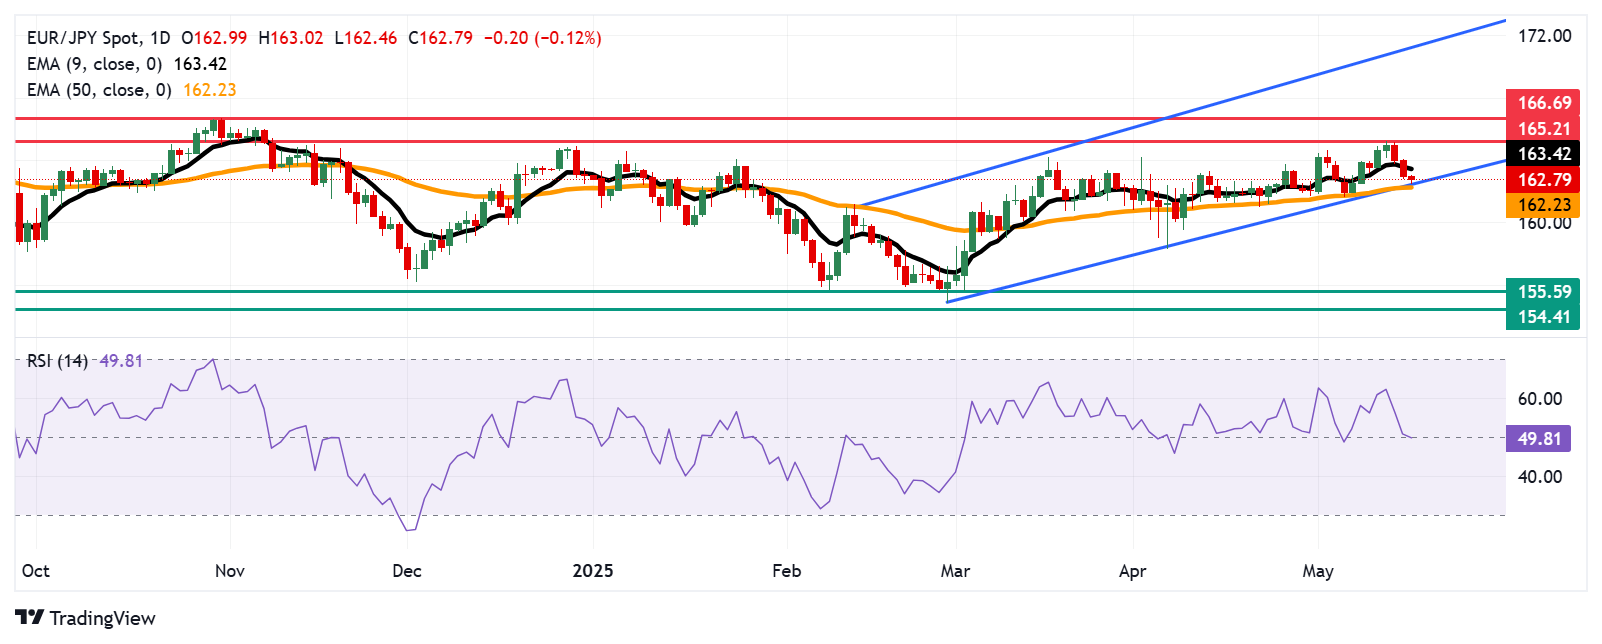
EUR/JPY extends its losing streak for the third successive session, trading around 162.80 during the Asian hours on Friday. Technical analysis of the daily chart shows the currency cross remains within an ascending channel, suggesting a bullish bias is in play.
However, EUR/JPY has slipped below the nine-day Exponential Moving Average (EMA), signaling weakening short-term momentum. Meanwhile, the 14-day Relative Strength Index (RSI) has dipped just below the 50 level, reinforcing the presence of a bearish bias.
On the upside, the EUR/JPY cross may face initial resistance at the nine-day EMA of 163.42. A break above this level could revive the bullish bias and support the pair to test its six-month high at 165.21, which was reached on May 13. If this is surpassed, the next significant obstacle is at 166.69, which marks a nine-month high last seen in October 2024.
The EUR/JPY cross could encounter initial support at the lower boundary of the ascending channel around 162.50, followed by the 50-day EMA at 162.23. A break below this crucial support zone would confirm the bearish bias and put pressure on the currency cross to navigate the region around its two-month low of 155.59, recorded on March 4, followed by 154.41, its lowest level since December 2023.
EUR/JPY: Daily Chart
Euro PRICE Today
The table below shows the percentage change of Euro (EUR) against listed major currencies today. Euro was the weakest against the New Zealand Dollar.
| USD | EUR | GBP | JPY | CAD | AUD | NZD | CHF | |
|---|---|---|---|---|---|---|---|---|
| USD | -0.21% | -0.13% | -0.32% | -0.11% | -0.32% | -0.51% | -0.21% | |
| EUR | 0.21% | 0.08% | -0.11% | 0.09% | -0.11% | -0.31% | -0.00% | |
| GBP | 0.13% | -0.08% | -0.19% | 0.02% | -0.19% | -0.37% | -0.07% | |
| JPY | 0.32% | 0.11% | 0.19% | 0.21% | -0.03% | -0.23% | 0.10% | |
| CAD | 0.11% | -0.09% | -0.02% | -0.21% | -0.23% | -0.39% | -0.08% | |
| AUD | 0.32% | 0.11% | 0.19% | 0.03% | 0.23% | -0.18% | 0.10% | |
| NZD | 0.51% | 0.31% | 0.37% | 0.23% | 0.39% | 0.18% | 0.30% | |
| CHF | 0.21% | 0.00% | 0.07% | -0.10% | 0.08% | -0.10% | -0.30% |
The heat map shows percentage changes of major currencies against each other. The base currency is picked from the left column, while the quote currency is picked from the top row. For example, if you pick the Euro from the left column and move along the horizontal line to the US Dollar, the percentage change displayed in the box will represent EUR (base)/USD (quote).
추천 기사


