


EUR/CAD Price Analysis: Euro steadies against Canadian Dollar despite minor pullback
- EUR/CAD trades near the 1.5800 zone after a muted performance during Tuesday's session.
- The pair maintains a bullish bias, supported by strong moving averages despite some mixed momentum signals.
- Support and resistance levels remain clustered around the 1.5780 area, offering nearby technical guidance.
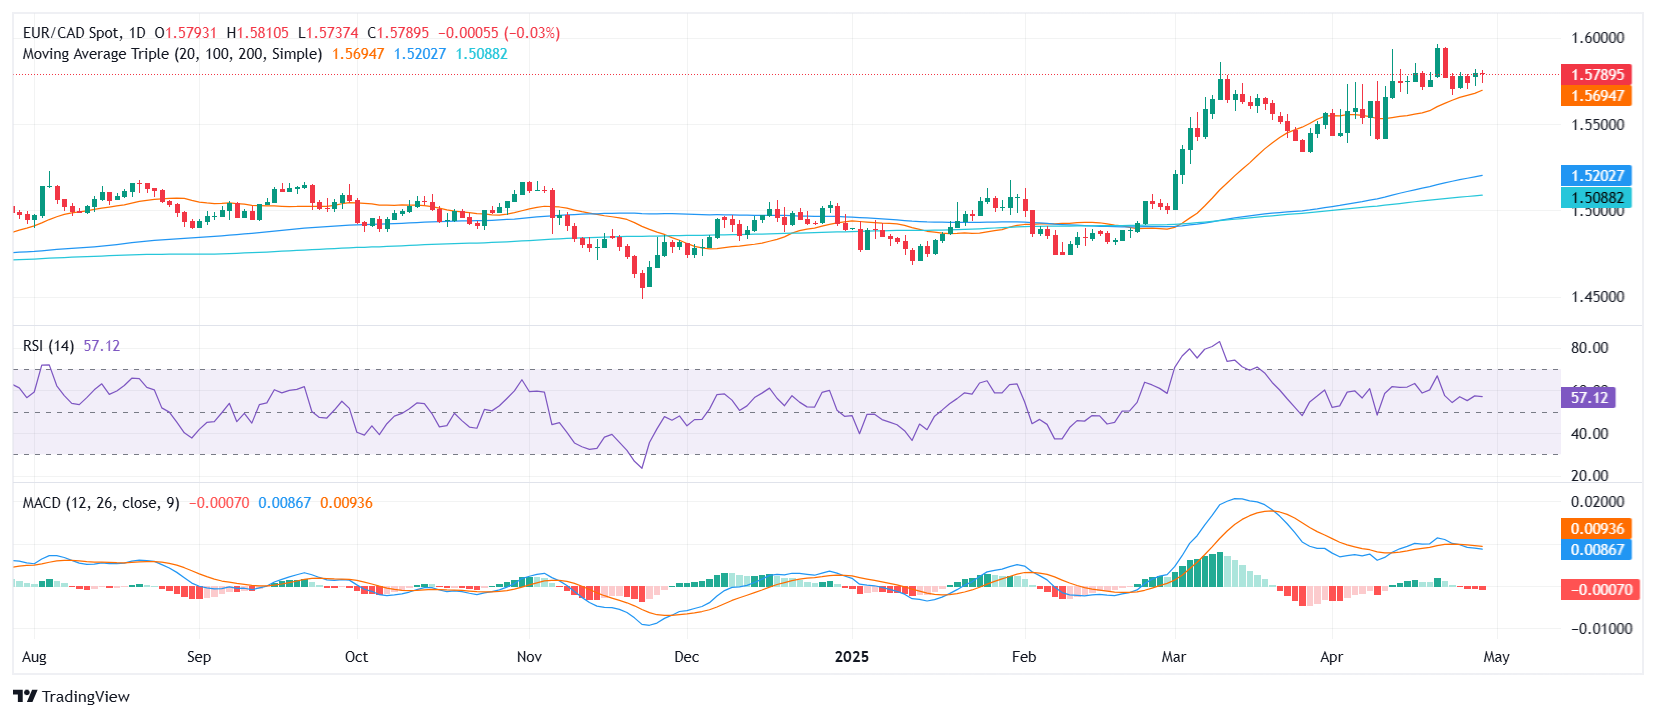
The EUR/CAD was seen trading around the 1.5800 zone after the European session on Tuesday, showing little movement on the day after a slight decline. Despite the minor dip, the overall technical setup stays bullish. Indicators offer a mixed picture: the Relative Strength Index (RSI) holds a neutral stance around 57, the Moving Average Convergence Divergence (MACD) is flashing a sell signal, while the Williams Percent Range and Average Directional Index (ADX) also lean neutral. Still, strong support from key moving averages keeps the broader bullish trend intact.
Looking deeper, the 20-day Simple Moving Average (SMA) near 1.5698, along with the 100-day SMA at 1.5203 and the 200-day SMA at 1.5089, continue to point towards a buying bias, reinforcing the underlying strength of the Euro against the Canadian Dollar. Short-term momentum is further backed by the 10-day Exponential Moving Average (EMA) around 1.5760 and the 10-day SMA at 1.5781, both indicating sustained bullish pressure.
However, momentum indicators urge some caution. The RSI at 57 suggests neither strong overbought nor oversold conditions, while the MACD indicates some near-term selling pressure. The Williams Percent Range, hovering close to -31, and the ADX around 38, both reflect a neutral to moderate trend strength.
Support for EUR/CAD lies at 1.5780, 1.5764, and 1.5760, levels that could cushion any additional pullback. On the upside, traders will be eyeing potential resistance closer to the 1.5810 area, where earlier price action capped gains during Tuesday's moves. Overall, while some intraday hesitation is evident, the broader structure favors continued strength for the Euro unless key supports are decisively broken.
Daily chart
추천 기사


