


EUR/CAD Price Forecast: Tests 1.5700 support near nine-day EMA
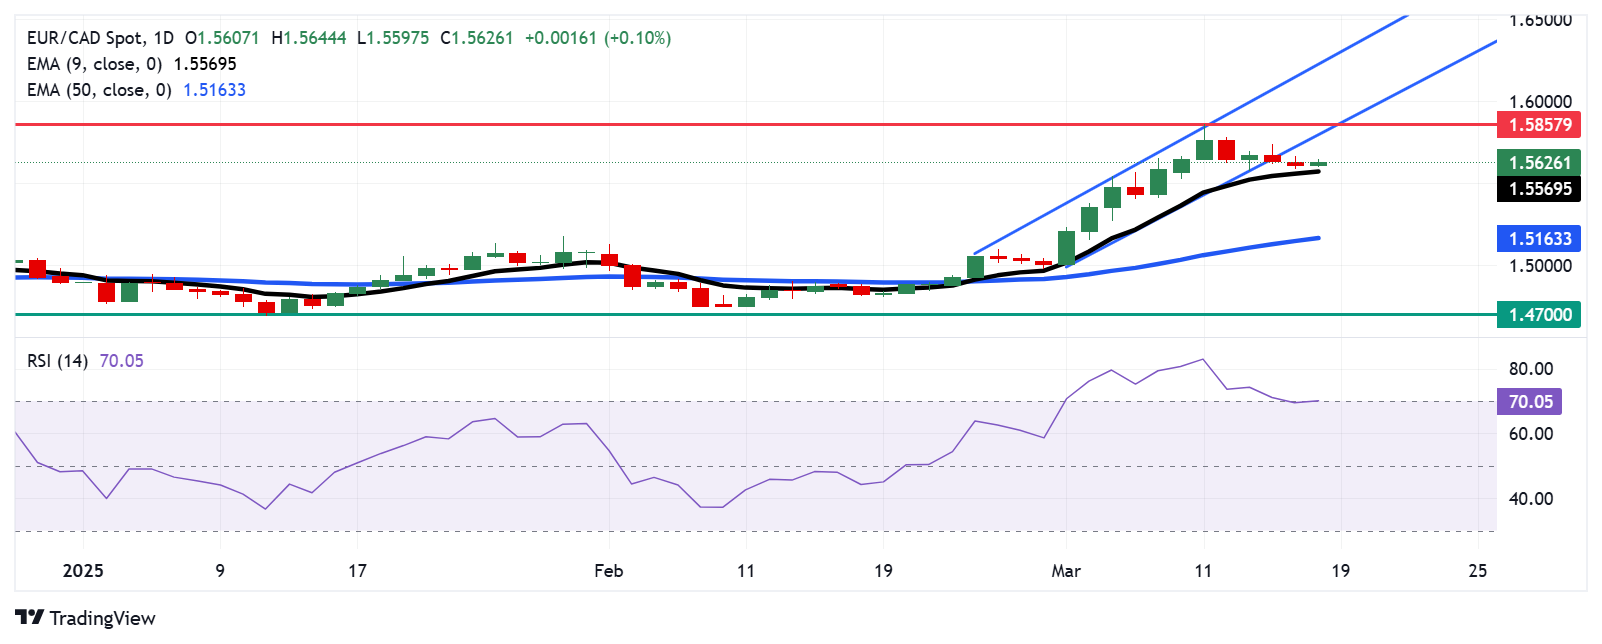
- EUR/CAD could encounter resistance while attempting to re-enter the ascending channel near its lower boundary around 1.5780.
- The 14-day RSI has pulled back to the 70 mark, indicating that traders may be taking profits.
- Immediate support is found at the nine-day Exponential Moving Average of 1.5570.
EUR/CAD edges higher after two days of gains, trading near 1.5640 during European hours on Tuesday. Technical analysis on the daily chart points to the weakening of a bullish bias, with the currency cross positioning below the ascending channel pattern.
The 14-day Relative Strength Index (RSI), a key indicator of overbought or oversold conditions, has retreated to the 70 mark, signaling a slight cooling-off while remaining in the overbought zone. This suggests that traders may be taking profits, potentially leading to a slowdown in price movement.
On the upside, the EUR/CAD cross may face resistance while attempting to re-enter the ascending channel near its lower boundary around the 1.5780 level. Beyond this, the 1.5857 mark—its highest level since July 2020, reached on March 11—serves as the next key hurdle. A successful return to the channel would strengthen the bullish outlook, potentially driving the currency cross toward the upper boundary of the channel, around 1.6250.
The immediate support is seen at the nine-day Exponential Moving Average (EMA) of 1.5570. A break below this level could weaken short-term price momentum, increasing downward pressure on the EUR/CAD cross and guiding it toward the 50-day EMA at 1.5163.
A break below the 50-day EMA would weaken the medium-term price momentum and drive the currency cross downwards toward the “throwback support” level of 1.4700 level.
EUR/CAD: Daily Chart
Euro PRICE Today
The table below shows the percentage change of Euro (EUR) against listed major currencies today. Euro was the strongest against the Japanese Yen.
| USD | EUR | GBP | JPY | CAD | AUD | NZD | CHF | |
|---|---|---|---|---|---|---|---|---|
| USD | -0.25% | 0.01% | 0.36% | -0.08% | -0.01% | -0.11% | -0.15% | |
| EUR | 0.25% | 0.25% | 0.59% | 0.15% | 0.23% | 0.12% | 0.08% | |
| GBP | -0.01% | -0.25% | 0.35% | -0.09% | -0.02% | -0.12% | -0.16% | |
| JPY | -0.36% | -0.59% | -0.35% | -0.44% | -0.37% | -0.50% | -0.52% | |
| CAD | 0.08% | -0.15% | 0.09% | 0.44% | 0.09% | -0.02% | -0.07% | |
| AUD | 0.00% | -0.23% | 0.02% | 0.37% | -0.09% | -0.11% | -0.15% | |
| NZD | 0.11% | -0.12% | 0.12% | 0.50% | 0.02% | 0.11% | -0.04% | |
| CHF | 0.15% | -0.08% | 0.16% | 0.52% | 0.07% | 0.15% | 0.04% |
The heat map shows percentage changes of major currencies against each other. The base currency is picked from the left column, while the quote currency is picked from the top row. For example, if you pick the Euro from the left column and move along the horizontal line to the US Dollar, the percentage change displayed in the box will represent EUR (base)/USD (quote).
추천 기사


