


Silver Price Forecast: XAG/USD reclaims $50 as Oil tumbles, bearish trend holds
- Silver gains over 3.5% as US-Iran diplomatic signals weigh on Oil prices.
- XAG/USD remains below key moving averages, keeping the bearish outlook intact.
- The RSI recovers from oversold territory, while the ADX points to a strong downtrend.
Silver (XAG/USD) attempts a rebound on Monday after sliding to a fresh yearly low of $48.47 on Friday. The recovery comes as Oil prices tumble more than 5% following positive diplomatic signals from both the US and Iran. At the time of writing, XAG/USD trades around $51, up 3.80% on the day.
Iranian President Masoud Pezeshkian said the Supreme Leader had granted the government certain powers regarding negotiations, according to ISNA. Earlier, Axios reported that US President Donald Trump favours giving diplomacy with Iran more time.
Falling Oil prices ease inflation concerns, allowing US Treasury yields to extend their recent decline following the technology-stock sell-off and adding pressure on the US Dollar (USD). Together, these moves support Silver’s recovery.
However, a deeper decline in Oil prices is far from assured, as the diplomatic outlook remains uncertain and both Washington and Tehran keep military options open. Silver’s upside therefore hinges on whether diplomacy leads to a sustained decline in Oil prices.
Otherwise, elevated energy costs could keep inflation risks in focus and the Federal Reserve (Fed) on a hawkish path. Higher interest rates increase the opportunity cost of holding Silver, which pays no yield.
Technical analysis
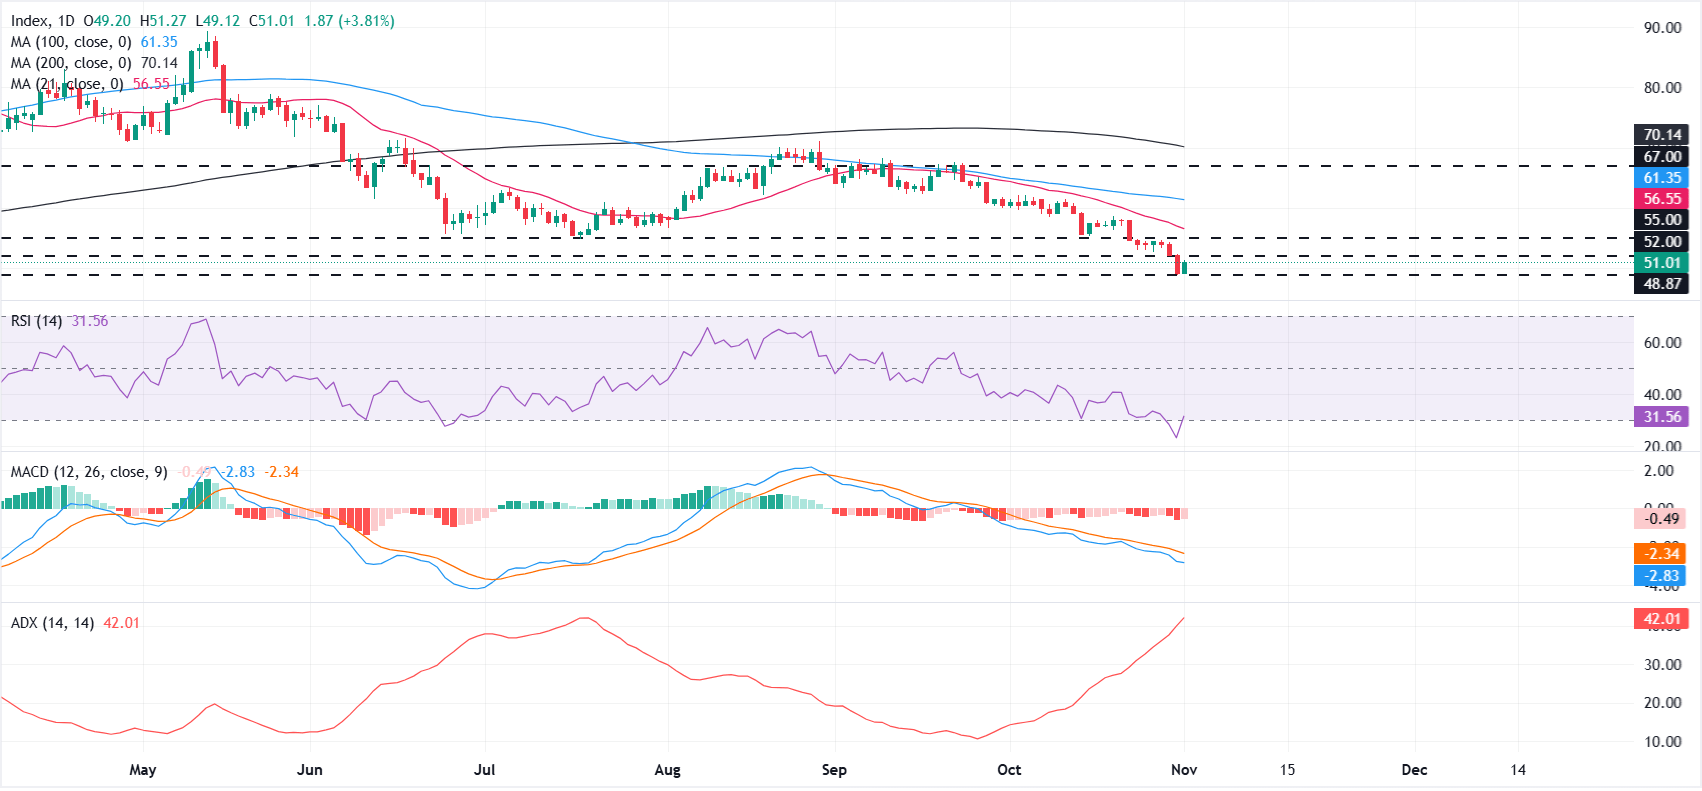
On the daily chart, XAG/USD maintains a bearish outlook as it trades below the 21-day Simple Moving Average (SMA) at $56, the 100-day SMA at $61 and the 200-day SMA at $70. This alignment of price under all major trend filters suggests the metal is in a broader corrective phase, while the Relative Strength Index (RSI) is hovering near 31 after briefly dipping into oversold territory.
The Moving Average Convergence Divergence (MACD) stays in negative territory with a weak line, and the rising Average Directional Index (ADX) near 42 suggests the prevailing downtrend retains strength despite the proximity of oversold momentum.
On the topside, initial resistance is seen at $52, ahead of a more notable barrier at $55, with the 21-day SMA at $56 reinforcing this supply zone and the 100-day SMA at $61 marking a deeper recovery hurdle before the prior horizontal cap at $67 and the longer-term 200-day SMA at $70.
On the downside, immediate support sits at Friday's low near $48.87, where a break would expose further bearish extension, although the increasingly oversold RSI and strong-trend ADX readings suggest that any slide towards that floor could start to attract short-covering rather than fresh aggressive selling.
(The technical analysis of this story was written with the help of an AI tool. Know more.)
Silver FAQs
Silver is a precious metal highly traded among investors. It has been historically used as a store of value and a medium of exchange. Although less popular than Gold, traders may turn to Silver to diversify their investment portfolio, for its intrinsic value or as a potential hedge during high-inflation periods. Investors can buy physical Silver, in coins or in bars, or trade it through vehicles such as Exchange Traded Funds, which track its price on international markets.
Silver prices can move due to a wide range of factors. Geopolitical instability or fears of a deep recession can make Silver price escalate due to its safe-haven status, although to a lesser extent than Gold's. As a yieldless asset, Silver tends to rise with lower interest rates. Its moves also depend on how the US Dollar (USD) behaves as the asset is priced in dollars (XAG/USD). A strong Dollar tends to keep the price of Silver at bay, whereas a weaker Dollar is likely to propel prices up. Other factors such as investment demand, mining supply – Silver is much more abundant than Gold – and recycling rates can also affect prices.
Silver is widely used in industry, particularly in sectors such as electronics or solar energy, as it has one of the highest electric conductivity of all metals – more than Copper and Gold. A surge in demand can increase prices, while a decline tends to lower them. Dynamics in the US, Chinese and Indian economies can also contribute to price swings: for the US and particularly China, their big industrial sectors use Silver in various processes; in India, consumers’ demand for the precious metal for jewellery also plays a key role in setting prices.
Silver prices tend to follow Gold's moves. When Gold prices rise, Silver typically follows suit, as their status as safe-haven assets is similar. The Gold/Silver ratio, which shows the number of ounces of Silver needed to equal the value of one ounce of Gold, may help to determine the relative valuation between both metals. Some investors may consider a high ratio as an indicator that Silver is undervalued, or Gold is overvalued. On the contrary, a low ratio might suggest that Gold is undervalued relative to Silver.
추천 기사


