


Euro flattens against US Dollar as traders look beyond ECB-Fed hawkish decisions
- Euro trades calm near 1.1485 against the US Dollar.
- Investors look beyond latest hawkish interest rate decision by both the ECB and the Fed.
- The Fed’s dot has lifted interest rate forecast significantly.
The Euro (EUR) trades in a tight range at around 1.1485 against the US Dollar (USD) during the European trading session on Friday. The major currency pair turns sideways after posting a fresh six-week low near 1.1456 as investors look beyond hawkish interest rate decisions by both the European Central Bank (ECB) and the Federal Reserve (Fed).
Last week, the ECB raised its key policy rates by 25 basis points (bps), as expected, in an attempt to counter rising inflationary pressures. The ECB still sees risks to inflation remaining to the upside, but not significant evidence of second-round inflation effects. However, financial markets have raised ECB interest rate hike expectations amid higher energy prices.
Strategists at UOB Group highlight the sharp repricing at the front end of European curve, noting that, as reported by Bloomberg, "money markets are now fully pricing four 25-bps rate increases by the ECB over the next 12 months.
This week, the US Dollar outperformed as the Fed broke the five-meeting hold streak and raised interest rates by 25 basis points (bps) to 3.75%-4.00% range. The Fed was expected to do so as the August Consumer Price Index (CPI) report showed signs of stickiness in inflationary pressures.
US Dollar Price This week
The table below shows the percentage change of US Dollar (USD) against listed major currencies this week. US Dollar was the strongest against the Japanese Yen.
| USD | EUR | GBP | JPY | CAD | AUD | NZD | CHF | |
|---|---|---|---|---|---|---|---|---|
| USD | 0.99% | 1.19% | 2.60% | 0.92% | 0.51% | 1.63% | 1.04% | |
| EUR | -0.99% | 0.18% | 1.57% | -0.06% | -0.45% | 0.64% | 0.05% | |
| GBP | -1.19% | -0.18% | 1.39% | -0.25% | -0.65% | 0.46% | -0.16% | |
| JPY | -2.60% | -1.57% | -1.39% | -1.64% | -2.06% | -0.99% | -1.57% | |
| CAD | -0.92% | 0.06% | 0.25% | 1.64% | -0.38% | 0.71% | 0.09% | |
| AUD | -0.51% | 0.45% | 0.65% | 2.06% | 0.38% | 1.11% | 0.51% | |
| NZD | -1.63% | -0.64% | -0.46% | 0.99% | -0.71% | -1.11% | -0.62% | |
| CHF | -1.04% | -0.05% | 0.16% | 1.57% | -0.09% | -0.51% | 0.62% |
The heat map shows percentage changes of major currencies against each other. The base currency is picked from the left column, while the quote currency is picked from the top row. For example, if you pick the US Dollar from the left column and move along the horizontal line to the Japanese Yen, the percentage change displayed in the box will represent USD (base)/JPY (quote).
The Fed also acknowledged price pressures remaining higher for long and signaled atleast one more interest rate hike this year.
Fed dot plot shifts higher as UOB flags more hawkish rate path
Analysts at UOB Group highlight that the latest FOMC “updated Dot Plot and Summary of Economic Projections point to a more hawkish policy trajectory.” They note that, based on the median view, “the Dot Plot now indicates fed funds rate at 4.1% end-2026 (previously was 3.8%, in the Jun FOMC) and then staying there for 2027 (previously was 3.6%, i.e. expecting a rate cut in 2027 in the Jun FOMC), and to 3.9% at end-2028 (previously was 3.4%, in the Jun FOMC) before the FFTR hits a longer-run level of around 3.2% (up from 3.1% in the Jun FOMC).” UOB argues that this profile underscores a clear shift toward a more persistent higher-for-longer stance in US rates.
EUR/USD Technical Analysis
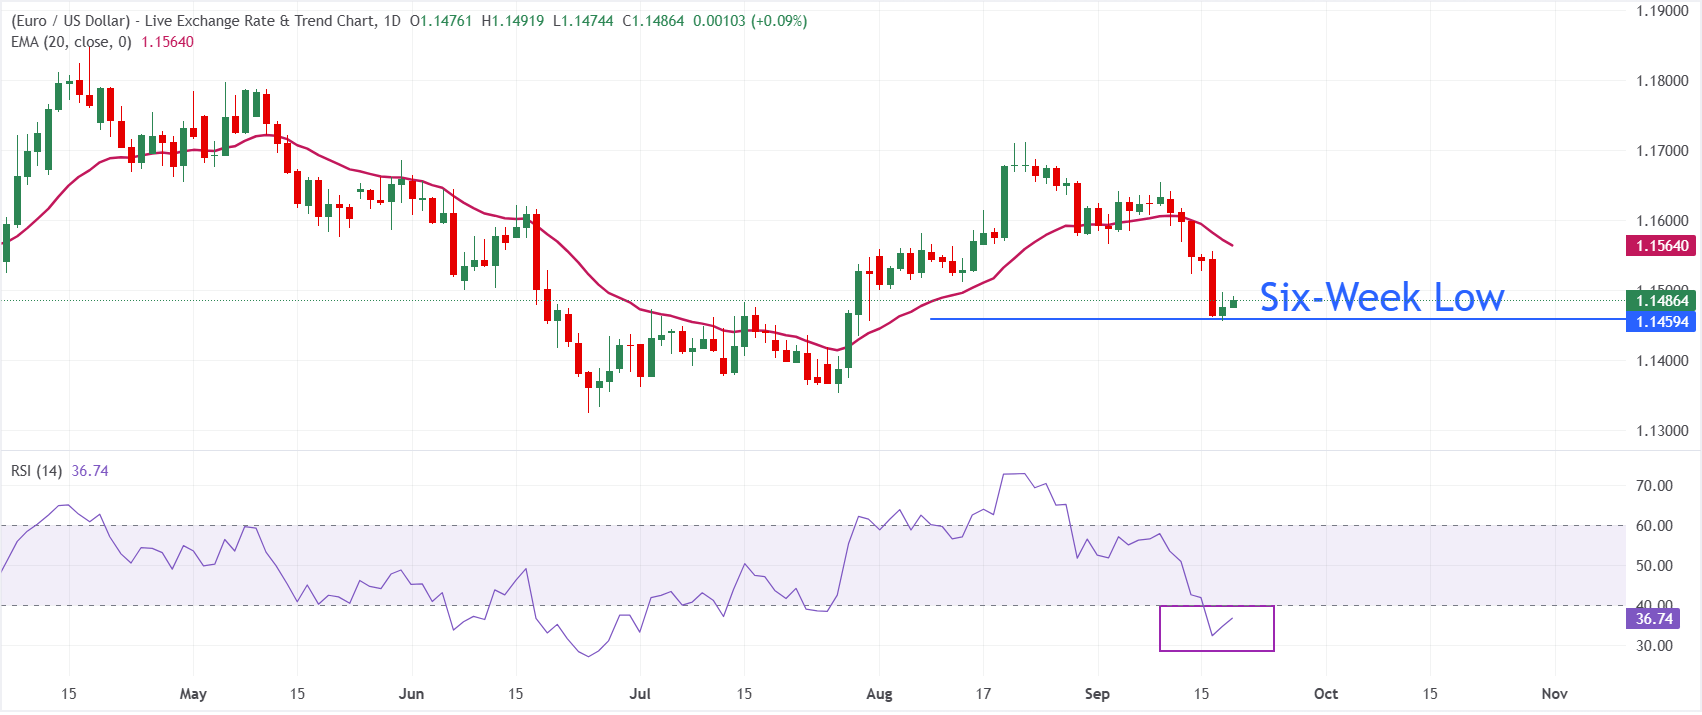
In the daily chart, EUR/USD trades at 1.1485, keeping a bearish near‑term tone as spot holds beneath the 20-period Exponential Moving Average (EMA) at 1.1564. The pair’s inability to reclaim this short-term EMA suggests that rallies remain capped for now, while the Relative Strength Index (RSI) at 36.8 stays just above oversold territory, hinting at lingering downside pressure but with some scope for consolidation rather than an immediate collapse.
On the topside, initial resistance is located at the 20-period EMA at 1.1564, and a sustained break above this barrier would be needed to ease the current bearish bias and allow for a more meaningful recovery. Looking down, the six-week low near 1.1460 is the key support level.
(The technical analysis of this story was written with the help of an AI tool. Know more.)
Central banks FAQs
Central Banks have a key mandate which is making sure that there is price stability in a country or region. Economies are constantly facing inflation or deflation when prices for certain goods and services are fluctuating. Constant rising prices for the same goods means inflation, constant lowered prices for the same goods means deflation. It is the task of the central bank to keep the demand in line by tweaking its policy rate. For the biggest central banks like the US Federal Reserve (Fed), the European Central Bank (ECB) or the Bank of England (BoE), the mandate is to keep inflation close to 2%.
A central bank has one important tool at its disposal to get inflation higher or lower, and that is by tweaking its benchmark policy rate, commonly known as interest rate. On pre-communicated moments, the central bank will issue a statement with its policy rate and provide additional reasoning on why it is either remaining or changing (cutting or hiking) it. Local banks will adjust their savings and lending rates accordingly, which in turn will make it either harder or easier for people to earn on their savings or for companies to take out loans and make investments in their businesses. When the central bank hikes interest rates substantially, this is called monetary tightening. When it is cutting its benchmark rate, it is called monetary easing.
A central bank is often politically independent. Members of the central bank policy board are passing through a series of panels and hearings before being appointed to a policy board seat. Each member in that board often has a certain conviction on how the central bank should control inflation and the subsequent monetary policy. Members that want a very loose monetary policy, with low rates and cheap lending, to boost the economy substantially while being content to see inflation slightly above 2%, are called ‘doves’. Members that rather want to see higher rates to reward savings and want to keep a lit on inflation at all time are called ‘hawks’ and will not rest until inflation is at or just below 2%.
Normally, there is a chairman or president who leads each meeting, needs to create a consensus between the hawks or doves and has his or her final say when it would come down to a vote split to avoid a 50-50 tie on whether the current policy should be adjusted. The chairman will deliver speeches which often can be followed live, where the current monetary stance and outlook is being communicated. A central bank will try to push forward its monetary policy without triggering violent swings in rates, equities, or its currency. All members of the central bank will channel their stance toward the markets in advance of a policy meeting event. A few days before a policy meeting takes place until the new policy has been communicated, members are forbidden to talk publicly. This is called the blackout period.
추천 기사


