


Crypto Today: Bitcoin, Ethereum, XRP eye short-term breakout as bulls return
- Bitcoin extends its recovery near $78,000, building on a robust moving-average support cluster.
- Ethereum ticks up for the third consecutive day as bulls aim at near-term gains above $2,500.
- XRP trades between the 50-day EMA support and the 200-day EMA resistance as buyers make a subtle comeback.
Bitcoin (BTC) trades higher near $78,000 on Friday as bulls return after early-week macro uncertainty and regulatory headwinds. Ethereum (ETH) aligns with the broader crypto market’s neutral-to-bullish outlook, holding support above $2,400 and gaining momentum for a short-term breakout at $2,500. Ripple (XRP) is similarly edging higher at $1.33, supported by short and medium-term moving averages.
Risk-on sentiment elevated as BTC, ETH and XRP broadly rise
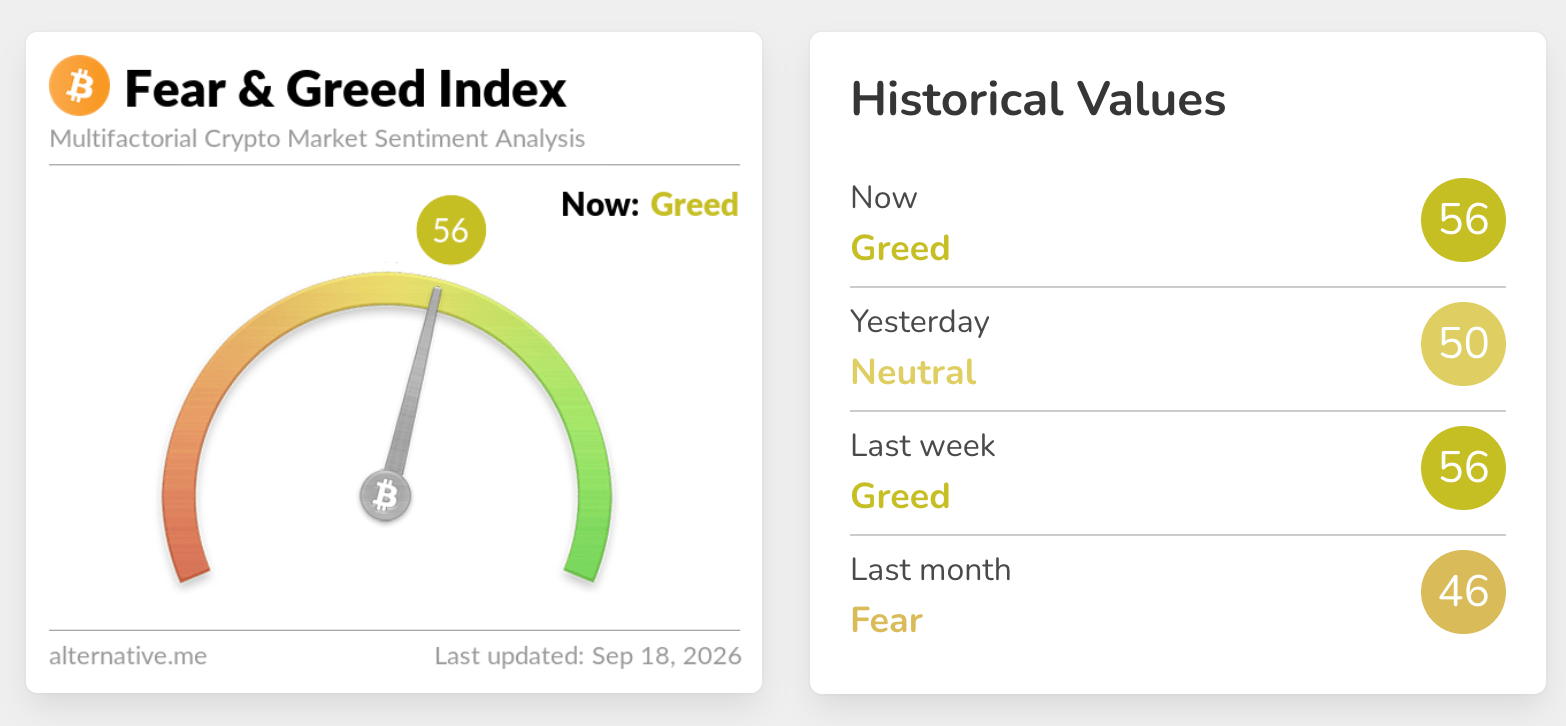
Appetite for digital assets has remained elevated despite recent overarching uncertainties, as reflected in the Fear & Greed Index, holding at 56 in the Greed territory on Friday, up from 50 the previous day. This shows that market participants remain resilient and willing to weather short-term crosswinds, anticipating a renewed uptrend in the medium term.
However, the Coinbase Premium Index slipped into negative territory this week as investors assessed the impact of the Federal Reserve (Fed) rate hike and the United States (US) CLARITY Act failing to advance in the Senate. A negative premium suggests that spot demand is easing among US buyers following the rally above $82,000 and the subsequent correction to $75,000.
Until the index flips positive again, traders should temper expectations for an extended recovery, with Bitcoin likely to trade sideways.
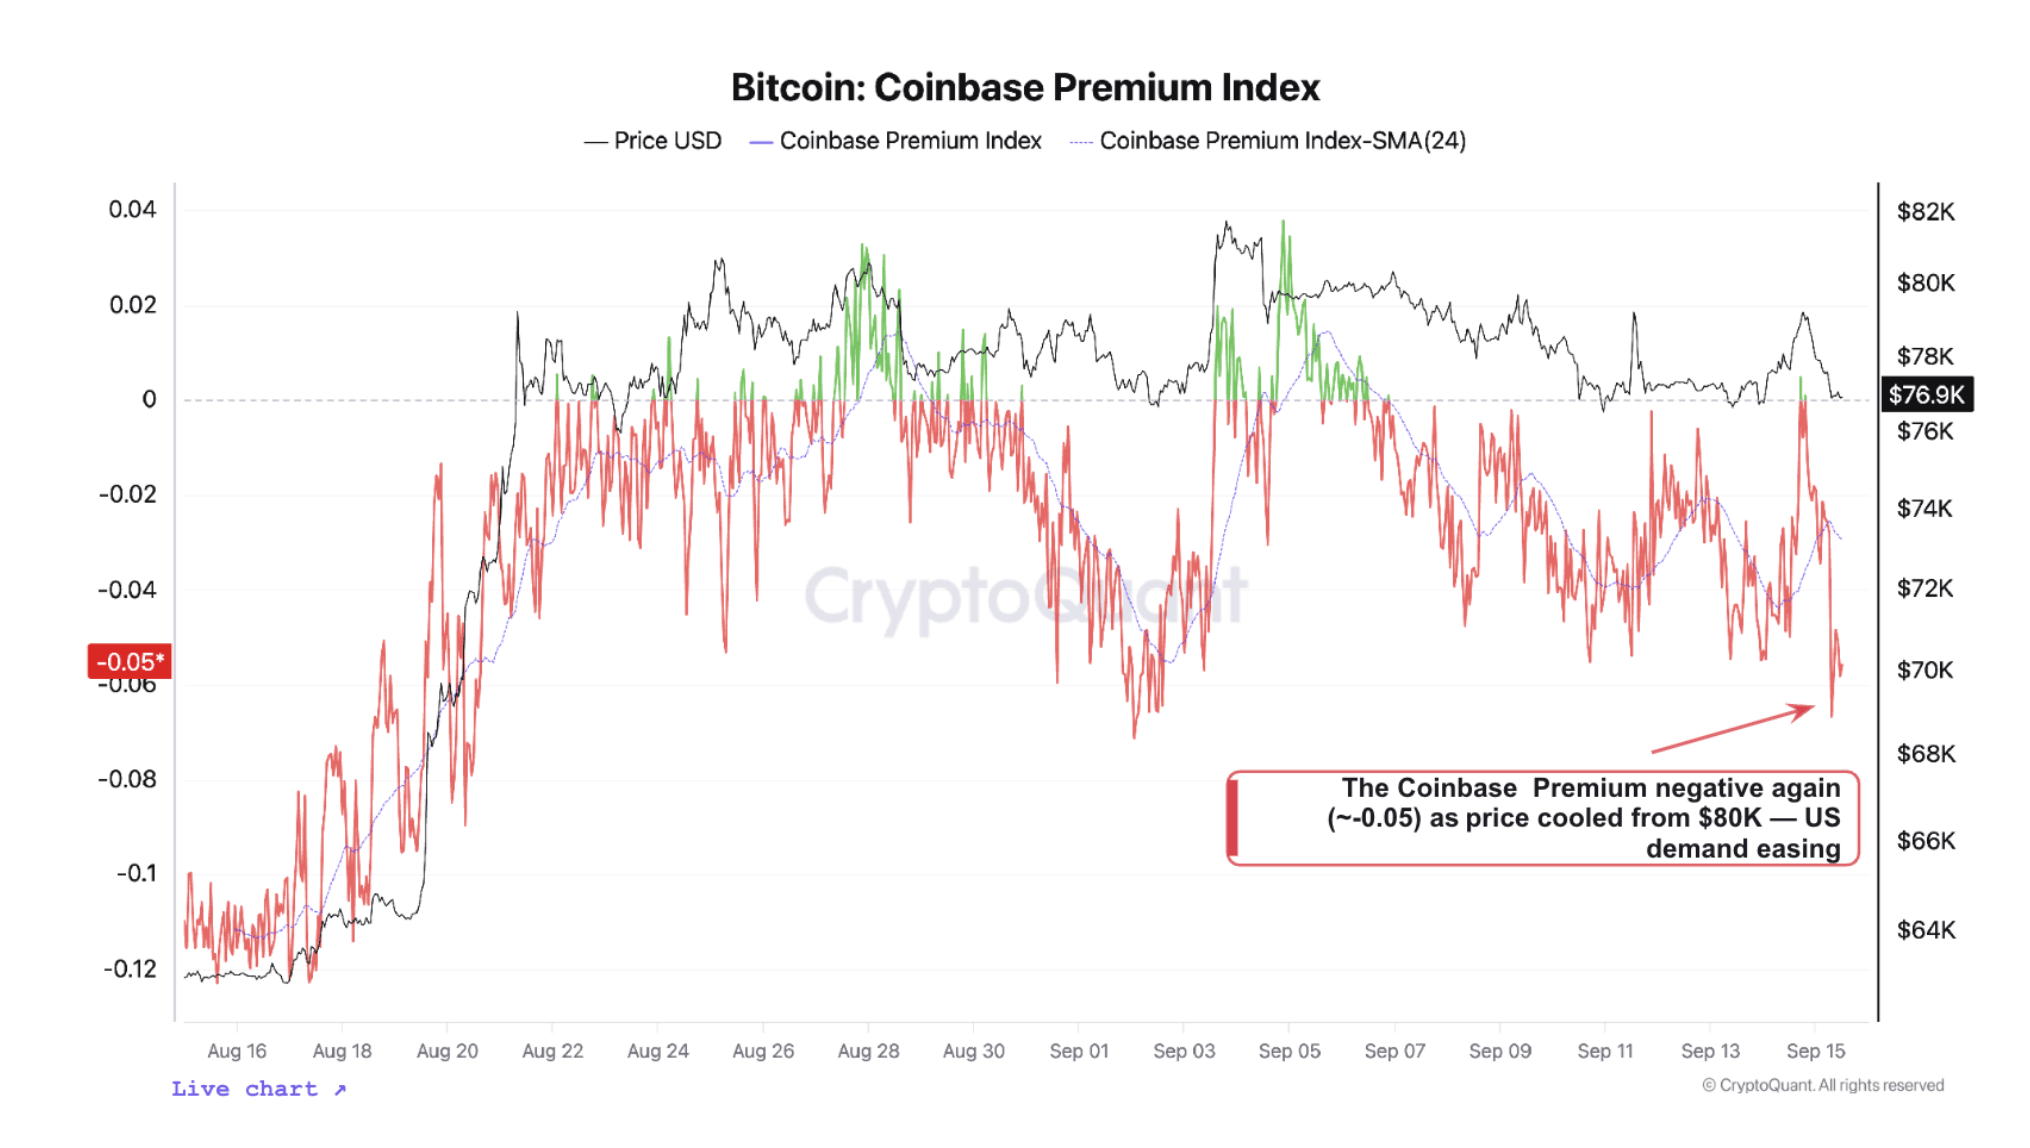
“Bitcoin's rally has cooled into the $76,000-$82,000 range as CryptoQuant's Bull Score slipped from 80 to 60 , from "extra bullish" to "bullish cooldown" and US spot demand faded, with the Coinbase premium negative again,” CryptoQuant analyst said in an on-chain report, adding, “rising ETH and altcoin exchange inflows (altcoin inflow transactions hit a nine-month high of 56,000 on September 8) add selling pressure, though Bitcoin's own inflows have stayed low.”
Technical analysis: Bitcoin builds momentum as bulls return
Bitcoin holds a bullish near-term bias as price remains comfortably above the key Exponential Moving Averages (EMAs). The 50-day EMA at $73,869 and the 200-day EMA at $73,198 sit well below the market, hinting at a supported uptrend structure reinforced by the SuperTrend line at $72,788.
Momentum is mixed, with the Relative Strength Index (RSI) at 56 leaning slightly positive, while the Moving Average Convergence Divergence (MACD) stays in negative territory, suggesting the latest advance is occurring against a backdrop of still-recovering medium-term momentum.
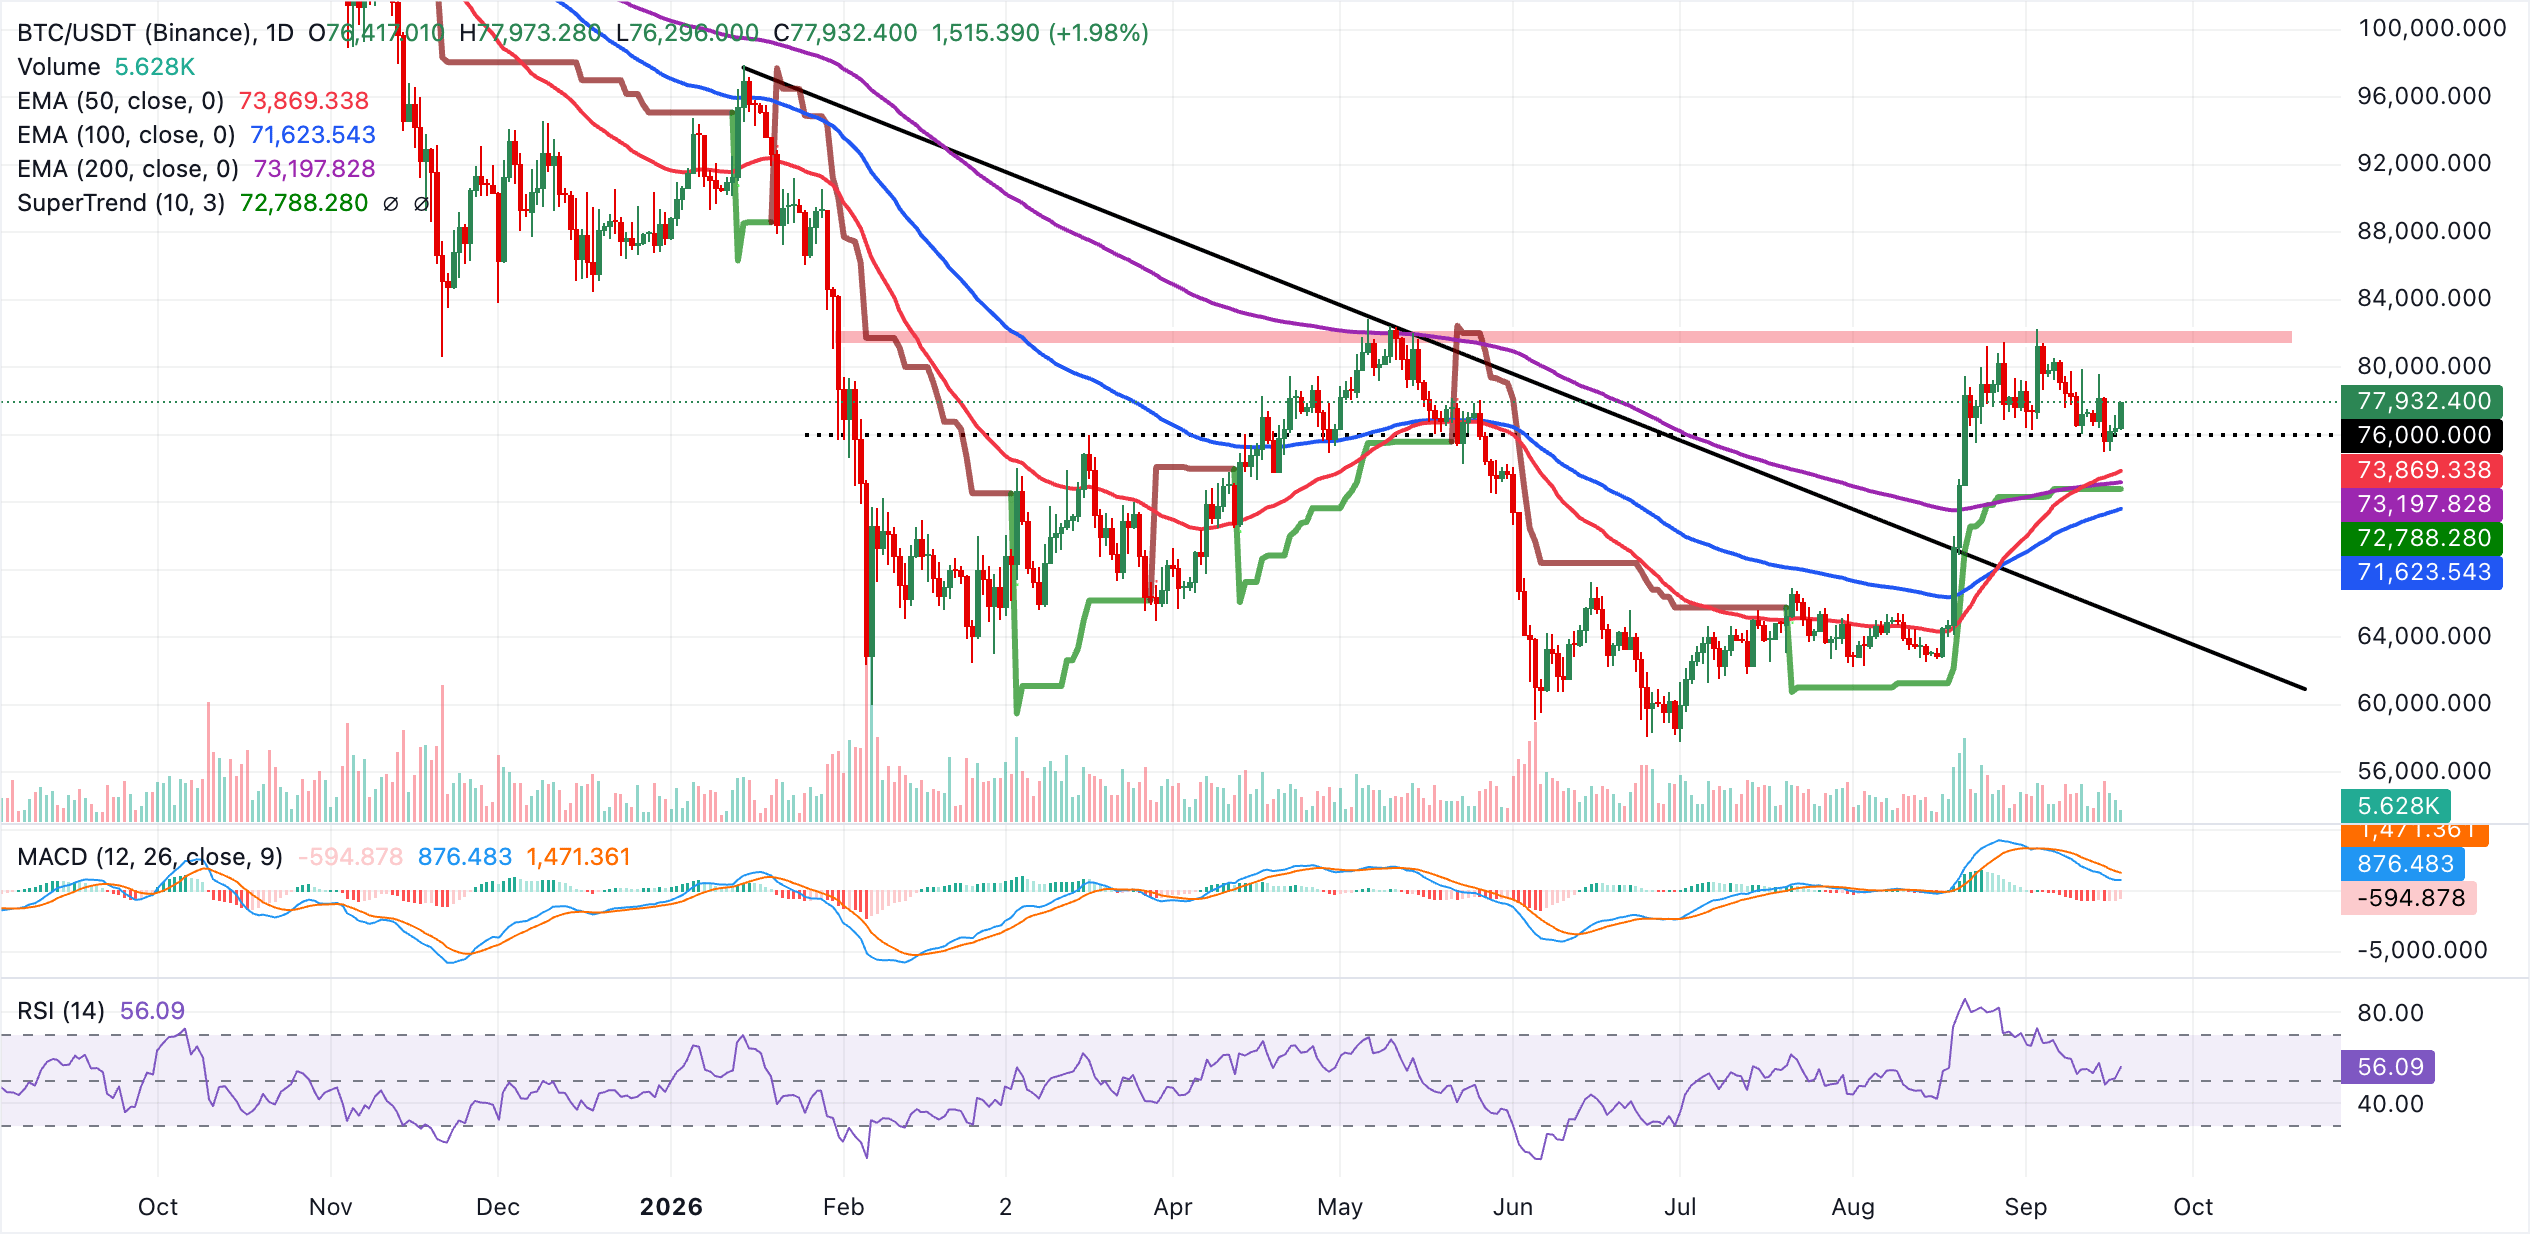
On the downside, immediate technical support is around the current pivot area near $77,932, before a deeper pullback exposes the EMA cluster, with the 50-day EMA at $73,869 and the 200-day EMA at $73,198 as successive demand levels. Below these, the SuperTrend base at $72,788 and the 100-day EMA at $71,624 mark a broader structural floor, while the prior downward resistance trendline, now broken around $65,235, defines a more distant medium-term support zone. With no significant overhead indicators in play on the daily chart, bulls remain in control as long as BTC holds above the stacked moving averages and the SuperTrend band.
Altcoins technical outlook: Ethereum and XRP show recovery signs
Ethereum trades at $2,488, maintaining a bullish near-term bias as it holds above a dense layer of moving-average support. The 50-day EMA at $2,291, together with the 100-day EMA at $2,169 and the 200-day EMA at $2,206, sits comfortably below spot and suggests an ongoing uptrend, while the SuperTrend line at $2,242 reinforces underlying demand.
Momentum is constructive but not extreme, with the RSI at 57 hovering in neutral-positive territory, although the MACD histogram remains below zero, hinting at a still-fragile recovery phase.
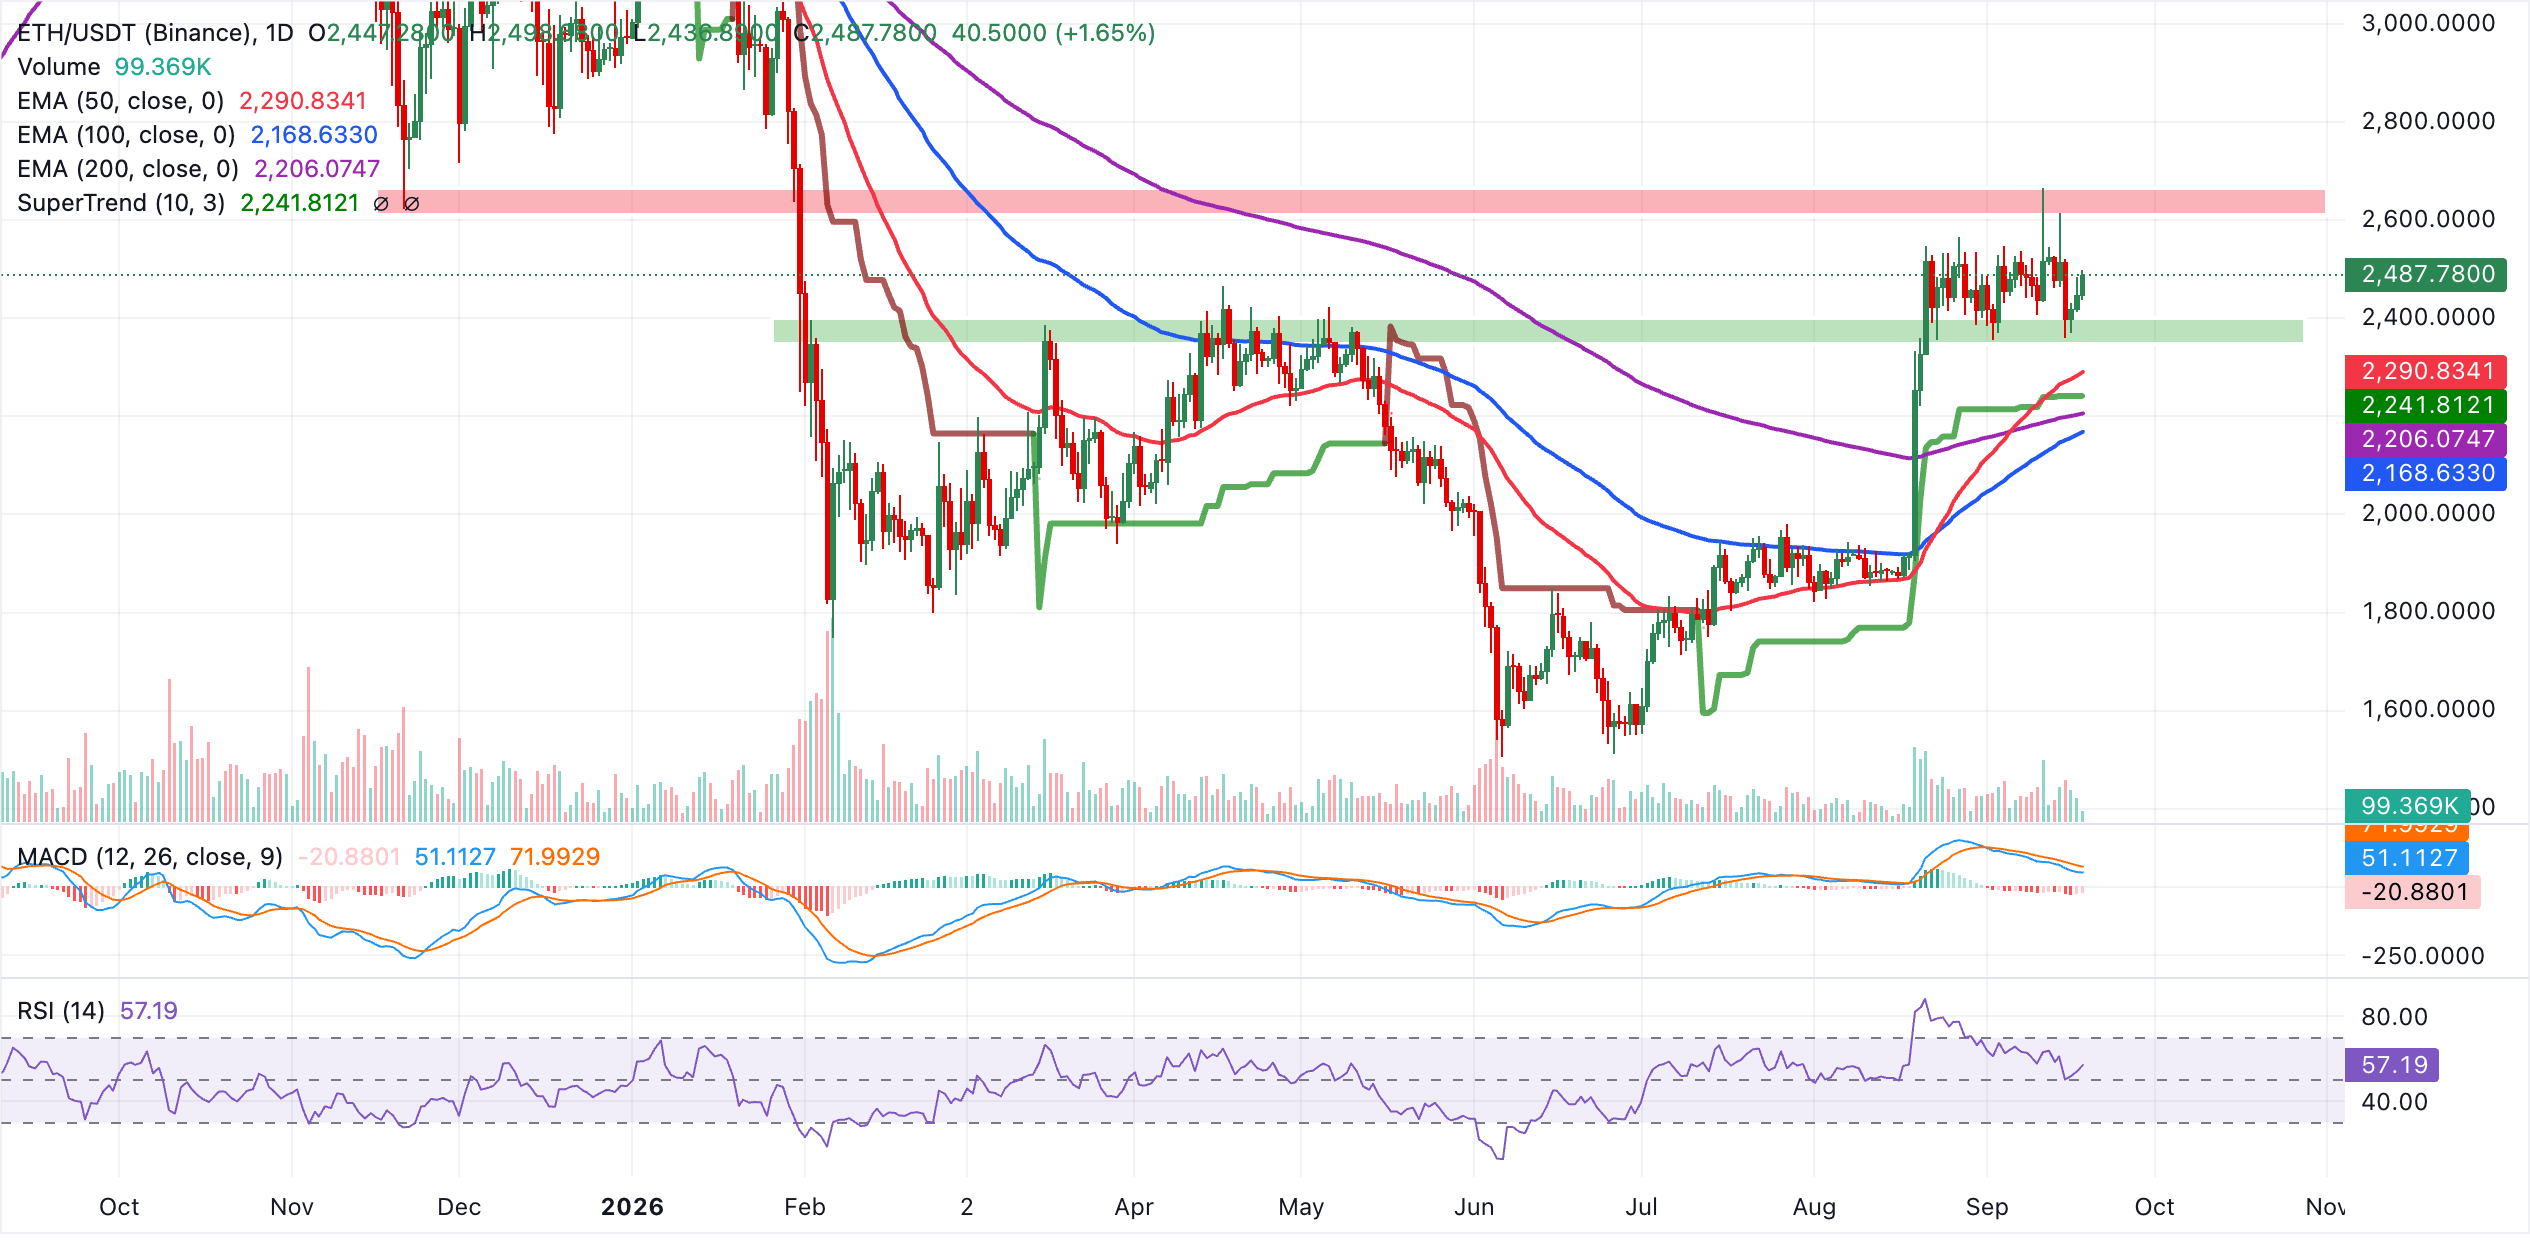
On the downside, initial technical support sits near the 50-day EMA at $2,291, which provides the first cushion on potential pullbacks. Below that, the SuperTrend line at $2,242 and the 200-day EMA at $2,206 cluster as a broader demand zone, with deeper support at the 100-day EMA around $2,169. As long as ETH holds above these stacked levels, the broader constructive structure remains intact, and any dip toward these areas is likely a corrective move within the prevailing bullish bias rather than a trend reversal.
XRP, meanwhile, trades at $1.33, holding above the short and medium-term EMAs, which keeps the near-term bias mildly bullish despite fading momentum. Price stands above the 50-day EMA at $1.29, the 100-day EMA at $1.26 and the SuperTrend line at $1.25, suggesting underlying demand on dips, while the broader downtrend remains in play as a descending resistance trendline continues to cap the upside and the 200-day EMA at $1.36 looms overhead.
The MACD histogram is negative and flat, and the RSI near the 50 mark hints at a consolidative, range-bound phase rather than an impulsive breakout.
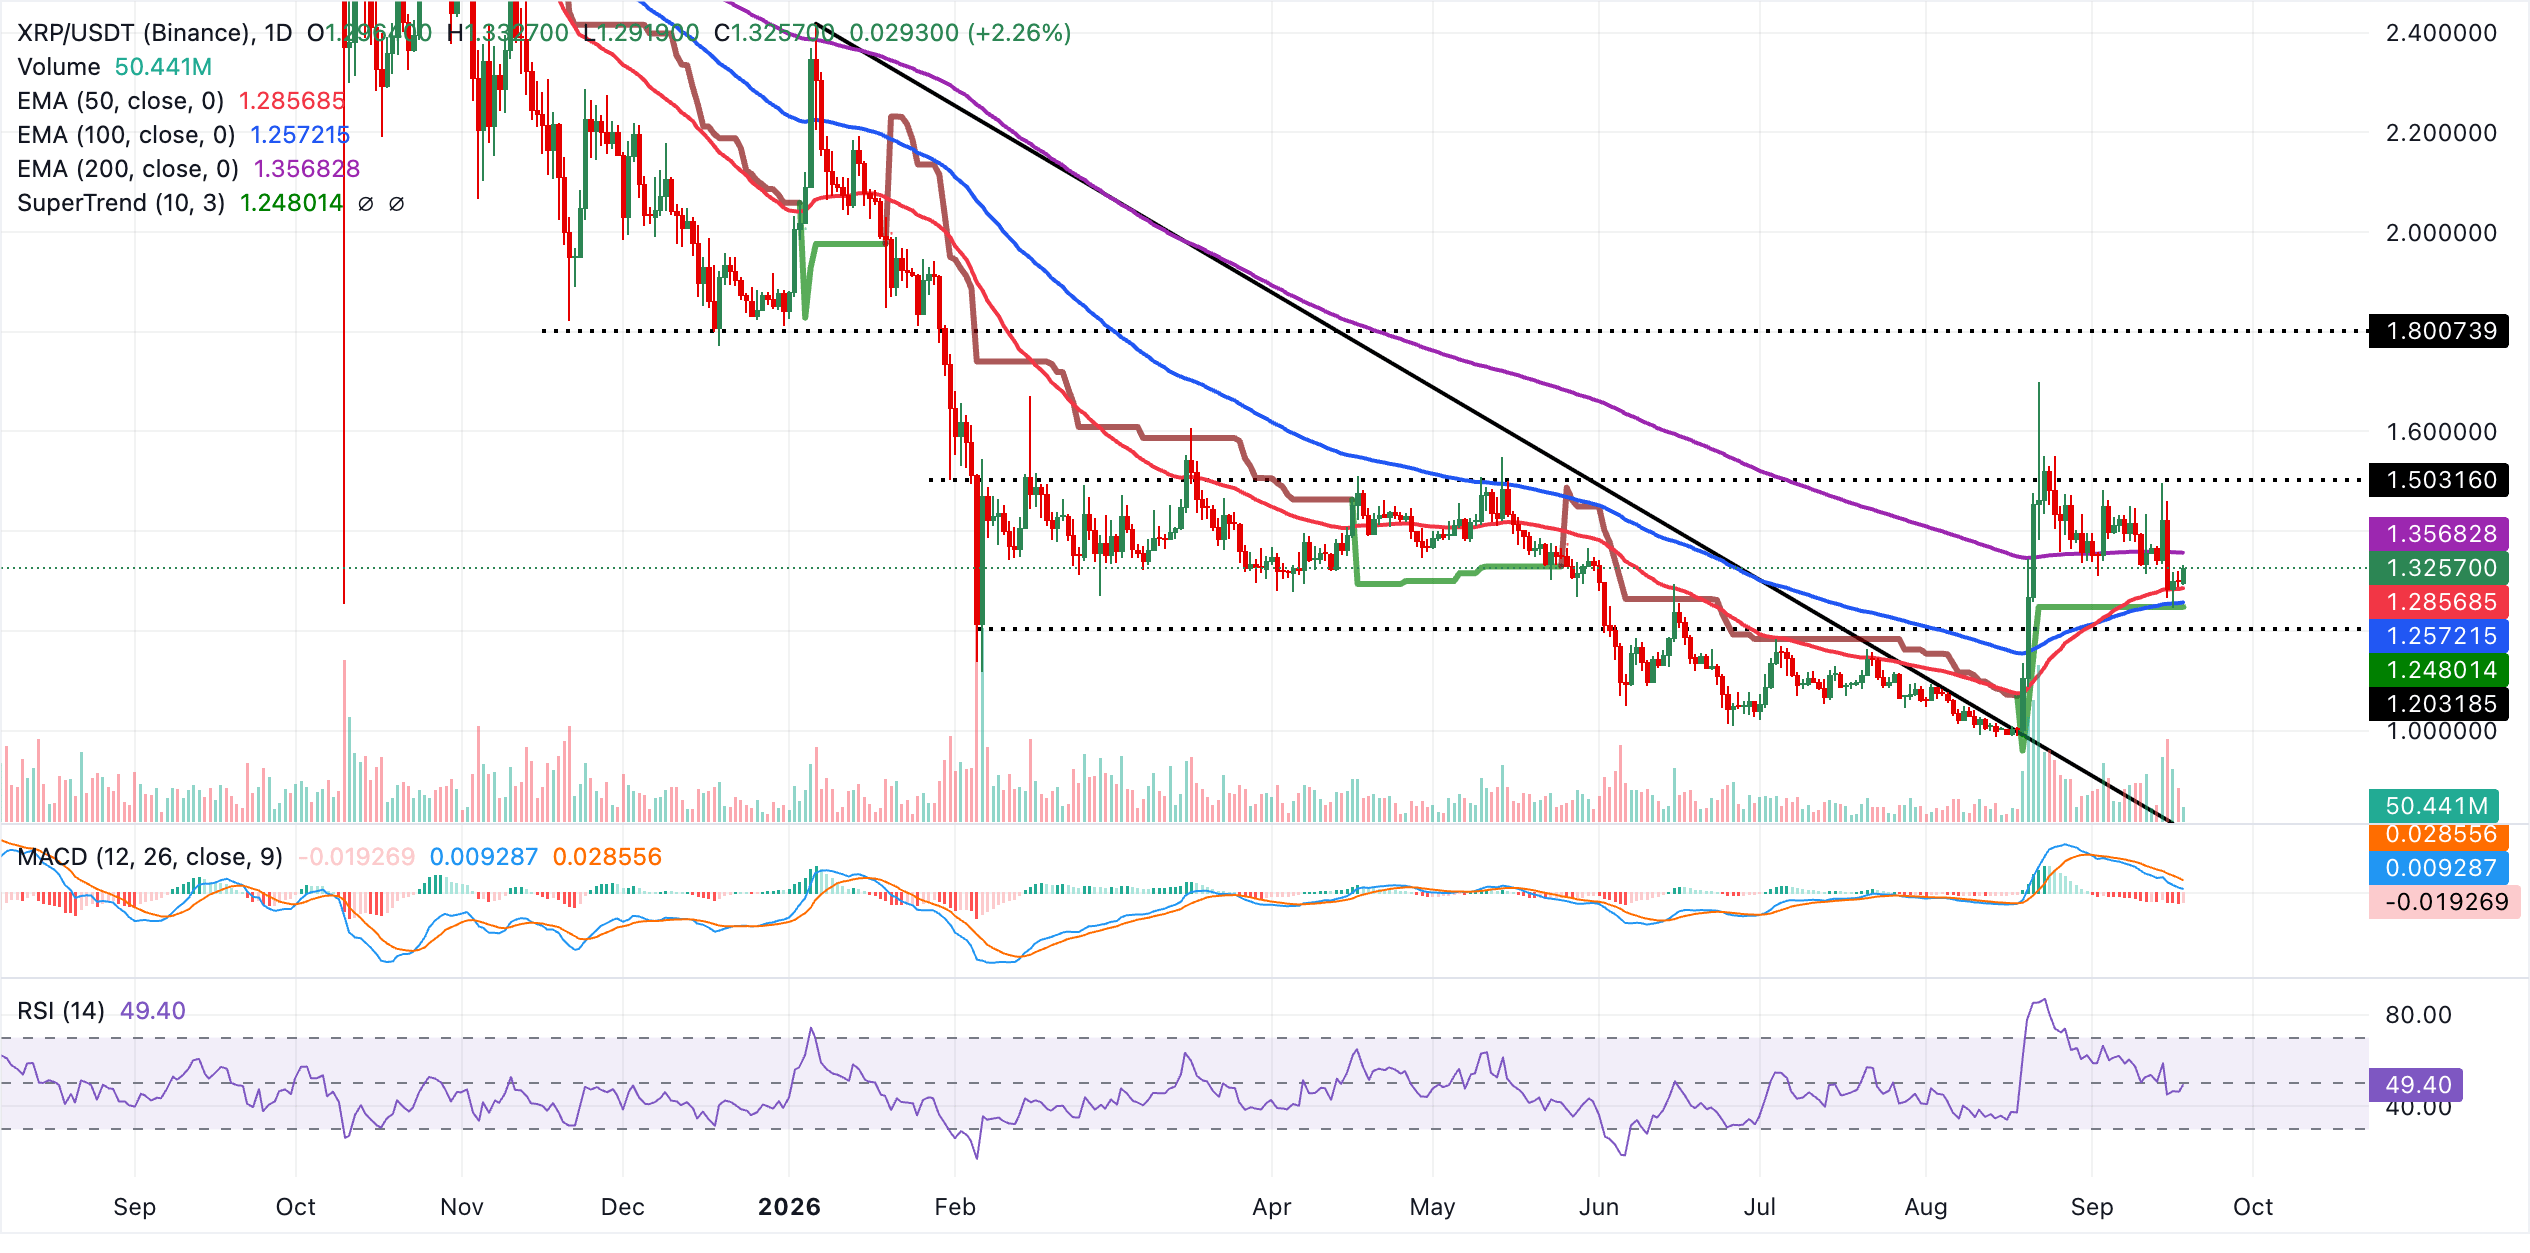
On the downside, initial support lies at the 50-day EMA at $1.29, followed by the 100-day EMA at $1.26, with the SuperTrend line at $1.25 reinforcing a broader demand zone. On the topside, the 200-day EMA at $1.36 remains the first structural barrier ahead of key psychological hurdles at $1.40 and $1.50. Only a sustained move above this latter level would open the way for a more constructive advance, while failure to clear it would keep XRP constrained within a corrective range and vulnerable to a pullback toward the clustered supports below $1.30.
(The technical analysis of this story was written with the help of an AI tool. Know more.)
Cryptocurrency prices FAQs
Token launches influence demand and adoption among market participants. Listings on crypto exchanges deepen the liquidity for an asset and add new participants to an asset’s network. This is typically bullish for a digital asset.
A hack is an event in which an attacker captures a large volume of the asset from a DeFi bridge or hot wallet of an exchange or any other crypto platform via exploits, bugs or other methods. The exploiter then transfers these tokens out of the exchange platforms to ultimately sell or swap the assets for other cryptocurrencies or stablecoins. Such events often involve an en masse panic triggering a sell-off in the affected assets.
Macroeconomic events like the US Federal Reserve’s decision on interest rates influence crypto assets mainly through the direct impact they have on the US Dollar. An increase in interest rate typically negatively influences Bitcoin and altcoin prices, and vice versa. If the US Dollar index declines, risk assets and associated leverage for trading gets cheaper, in turn driving crypto prices higher.
Halvings are typically considered bullish events as they slash the block reward in half for miners, constricting the supply of the asset. At consistent demand if the supply reduces, the asset’s price climbs.
추천 기사


