

Australian Dollar remains subdued following CPI inflation data
- Australian Dollar stays subdued after Australia’s December CPI data was released on Wednesday.
- Australia’s December inflation rose to 3.6% year-over-year, matching forecasts, after a revised 3.5% previously.
- The “Sell America” theme persists, pushing DXY downwards ahead of the Fed decision.
The Australian Dollar (AUD) edges lower against the US Dollar (USD) on Wednesday after registering over 1% gains in the previous session. The AUD/USD pair depreciates as the AUD remains subdued following the release of Australia’s Consumer Price Index (CPI) data for December reported by the Australian Bureau of Statistics (ABS).
Australia’s CPI rose by 3.6% year-over-year (YoY) in December, following a 3.5% (revised from 3.4%) increase prior. The market consensus was for 3.6% growth in the reported period. Australia’s RBA Trimmed Mean inflation increased to 0.2% month-over-month (MoM) and 3.3% year-over-year (YoY). The monthly CPI rose 1.0% in December, up from 0% previously and above the 0.7% forecast.
Australia’s headline inflation is remaining above the Reserve Bank of Australia’s (RBA) 2–3% target, reinforcing the likelihood of a tighter RBA monetary policy, supported by recent PMI data and employment data.
US Dollar edges higher ahead of Fed policy decision
- The US Dollar Index (DXY), which measures the value of the US Dollar against six major currencies, is rising after registering more than 1% losses in the previous session and trading near 96.10 at the time of writing. The “Sell America” narrative continues to dominate sentiment, with the DXY sliding to its lowest level since February 2022 as investors position ahead of Federal Reserve (Fed) policy decision.
- The Federal Reserve is widely expected to keep rates unchanged at 3.50%–3.75% at the end of its two-day meeting on Wednesday, following three consecutive rate cuts in 2025. Markets will focus on the post-meeting press conference for guidance on the policy outlook in the months ahead.
- Jonas Goltermann, deputy chief markets economist at Capital Economics, said in a note, “While there are several potential culprits for the dollar’s drop, the main driver is the fallout from reports that the US Treasury is considering direct currency intervention."
- US President Donald Trump stated that the value of the USD is "great" when asked whether he thought it had declined too much. His comments exert some selling pressure on the US Dollar.
- US ADP Employment Change 4-week average was reported at 7.75K, down from the previous report of 8K.
- Trump warned he would impose 100% tariffs on Canadian goods if Ottawa were to strike a trade deal with China, the BBC reported over the weekend. In response, Canada’s Prime Minister Mark Carney said on Sunday that Canada has no plans to pursue a free trade agreement with China, clarifying that his recent understanding with Beijing only reduced tariffs in a few sectors that had been hit recently.
- Australia's S&P Global Manufacturing Purchasing Managers Index (PMI), which came in at 52.4 in January versus 51.6 prior. Services PMI climbed to 56.0 in January from the previous reading of 51.1, while the Composite PMI climbed to 55.5 in January versus 51.0 prior.
- Employment Change, which arrived at 65.2K in December, swung from 28.7K job losses (revised from 21.3K) in November, compared with the consensus forecast of 30K. Meanwhile, the Unemployment Rate declined to 4.1% from 4.3% prior, against the market consensus of 4.4%.
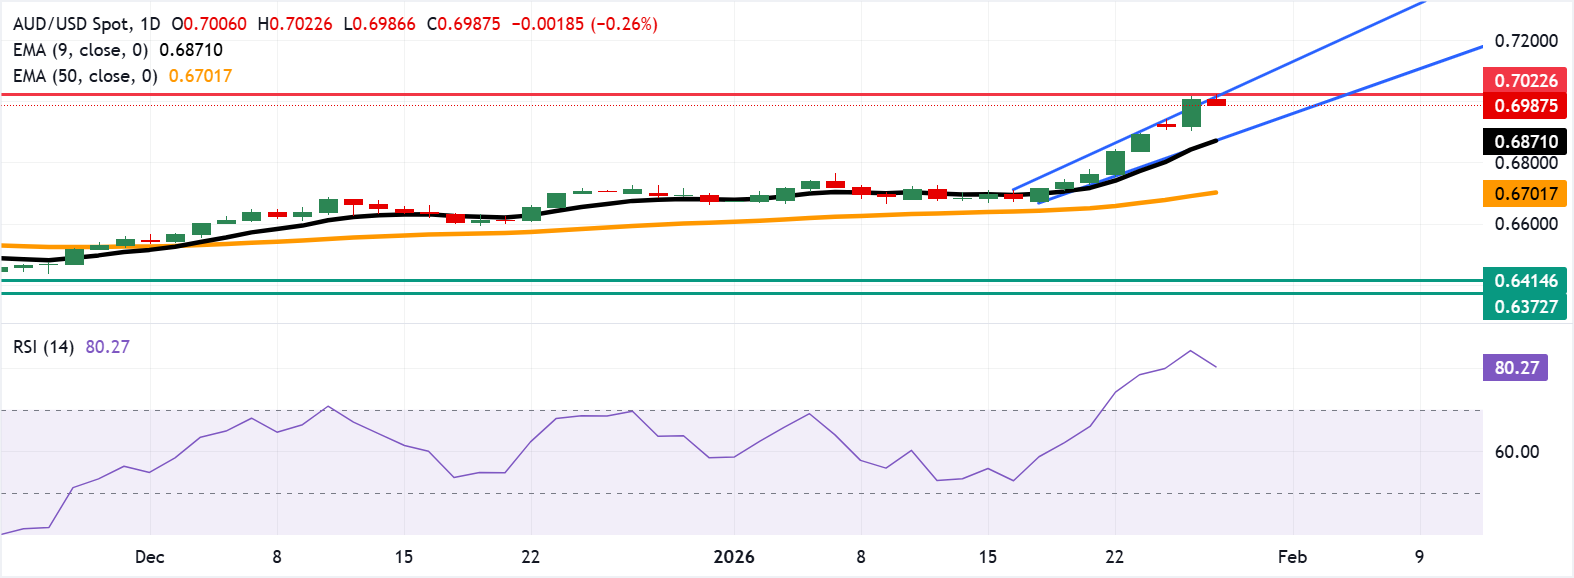
Australian Dollar pulls back from confluence resistance zone around 0.7000
The AUD/USD pair is trading around 0.6990 on Wednesday. Daily chart analysis indicates that the pair is rising within the ascending channel pattern, indicating a persistent bullish bias. The 14-day Relative Strength Index (RSI) at 80.27 is overbought, signaling stretched momentum.
The AUD/USD pair tests the confluence resistance zone around the upper boundary of the ascending channel near the 0.7022, the highest level since February 2023 recoded on Wednesday. On the downside, the primary support lies at the nine-day Exponential Moving Average (EMA) at 0.6871, aligned with the lower ascending channel boundary. A break below the channel would weaken the bullish bias and target the 50-day EMA of 0.6701.
Australian Dollar Price Today
The table below shows the percentage change of Australian Dollar (AUD) against listed major currencies today. Australian Dollar was the weakest against the US Dollar.
| USD | EUR | GBP | JPY | CAD | AUD | NZD | CHF | |
|---|---|---|---|---|---|---|---|---|
| USD | 0.22% | 0.20% | 0.35% | 0.18% | 0.21% | 0.43% | 0.33% | |
| EUR | -0.22% | -0.02% | 0.09% | -0.04% | -0.01% | 0.21% | 0.12% | |
| GBP | -0.20% | 0.02% | 0.15% | -0.02% | 0.00% | 0.23% | 0.14% | |
| JPY | -0.35% | -0.09% | -0.15% | -0.16% | -0.13% | 0.08% | -0.01% | |
| CAD | -0.18% | 0.04% | 0.02% | 0.16% | 0.03% | 0.25% | 0.16% | |
| AUD | -0.21% | 0.00% | -0.01% | 0.13% | -0.03% | 0.22% | 0.12% | |
| NZD | -0.43% | -0.21% | -0.23% | -0.08% | -0.25% | -0.22% | -0.10% | |
| CHF | -0.33% | -0.12% | -0.14% | 0.01% | -0.16% | -0.12% | 0.10% |
The heat map shows percentage changes of major currencies against each other. The base currency is picked from the left column, while the quote currency is picked from the top row. For example, if you pick the Australian Dollar from the left column and move along the horizontal line to the US Dollar, the percentage change displayed in the box will represent AUD (base)/USD (quote).
Economic Indicator
Consumer Price Index (YoY)
The Consumer Price Index (CPI), released by the Australian Bureau of Statistics on a monthly basis, measures the changes in the price of a comprehensive basket of goods and services acquired by household consumers. The indicator is the primary measure of headline inflation after a new methodology was applied to transition from quarterly to monthly readings, applying to data from April 2024 onwards. The YoY reading compares prices in the reference month to the same month a year earlier. A high reading is seen as bullish for the Australian Dollar (AUD), while a low reading is seen as bearish.
Read more.Last release: Wed Jan 28, 2026 00:30
Frequency: Monthly
Actual: 3.6%
Consensus: 3.6%
Previous: 3.4%
Source: Australian Bureau of Statistics
추천 기사


