

Australian Dollar slips on increased risk aversion
- Australian Dollar depreciates as the Greenback strengthens on safe-haven demand after Trump’s weekend comments.
- Australia’s strong PMI and employment data reinforced expectations of tighter RBA monetary policy.
- The US Dollar weakened amid rumors of FX market intervention to support the Japanese Yen.
The Australian Dollar declines against the US Dollar (USD) after opening from a gap up on Monday. The AUD/USD pair depreciates as the Greenback gains on increased safe-haven demand, which could be attributed to the recent comments from US President Donald Trump over the weekend.
However, the AUD/USD pair appreciated as the US Dollar came under pressure amid rumors of a possible intervention in FX markets to support the Japanese Yen (JPY). According to Bloomberg, traders said the Federal Reserve Bank of New York had carried out a so-called rate check with major banks, requesting indicative exchange rates, a step widely viewed as a signal that authorities may be preparing to facilitate another intervention.
Australia’s strong PMI data reinforced the likelihood of a tighter monetary policy from the Reserve Bank of Australia (RBA), supported by employment data. RBA policymakers acknowledged that inflation has eased significantly from its 2022 peak, though recent data suggests renewed upward momentum. Headline CPI slowed to 3.4% YoY in November but remains above the RBA’s 2–3% target band.
US Dollar edges higher on safe-haven demand
- The US Dollar Index (DXY), which measures the value of the US Dollar against six major currencies, is recovering ground and trading near 97.10 at the time of writing.
- Trump warned he would impose 100% tariffs on Canadian goods if Ottawa were to strike a trade deal with China, the BBC reported over the weekend. In response, Canada’s Prime Minister Mark Carney said on Sunday that Canada has no plans to pursue a free trade agreement with China, clarifying that his recent understanding with Beijing only reduced tariffs in a few sectors that had been hit recently.
- The US Gross Domestic Product grew at an annualized rate of 4.4% in the third quarter of 2025, slightly more than expected and the previous reading of 4.3%. Additionally, the Initial Jobless Claims came in at 200K last week, below the market consensus of 212K.
- US Personal Consumption Expenditures (PCE) Price Index rose to 2.8% year-over-year in November from 2.7% in October. On a monthly basis, the PCE Price Index rose by 0.2%. The annual core PCE Price Index, the Federal Reserve's (Fed) preferred gauge of inflation, rose by 2.8% in November, following the 2.7% increase recorded in October and matching the market expectation.
- US President Donald Trump said he would step back from imposing tariffs on goods from European nations opposing his effort to take possession of Greenland. He said earlier there is “no going back” on his ambitions regarding Greenland, alongside earlier threats to impose new 10% tariffs on eight European Union (EU) countries.
- President Trump also said that the United States and the North Atlantic Treaty Organization (NATO) had “formed the framework of a future deal regarding Greenland.” However, he did not outline the parameters of the so-called framework, and it remained unclear what the agreement would entail.
- Fed officials have signaled little urgency to ease policy further until there is clearer evidence that inflation is sustainably moving toward the 2% target. Morgan Stanley analysts revised their 2026 outlook, now forecasting one rate cut in June followed by another in September, compared with their previous expectation of cuts in January and April.
- Australia's S&P Global Manufacturing Purchasing Managers Index (PMI), which came in at 52.4 in January versus 51.6 prior. Services PMI climbed to 56.0 in January from the previous reading of 51.1, while the Composite PMI climbed to 55.5 in January versus 51.0 prior.
- Employment Change, which arrived at 65.2K in December, swung from 28.7K job losses (revised from 21.3K) in November, compared with the consensus forecast of 30K. Meanwhile, the Unemployment Rate declined to 4.1% from 4.3% prior, against the market consensus of 4.4%.
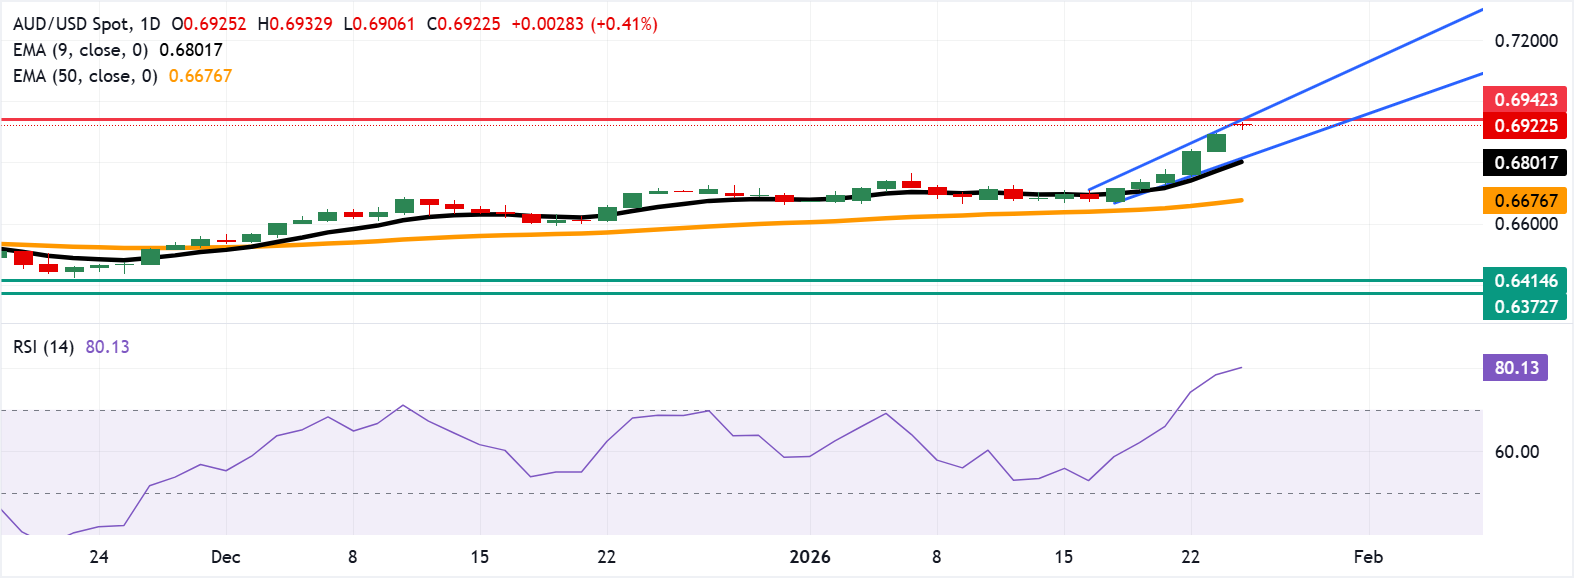
Australian Dollar remains above 0.6900 near upper ascending channel boundary
The AUD/USD pair is trading around 0.6920 on Monday. Daily chart analysis indicates that the pair is rising within the ascending channel pattern, indicating a persistent bullish bias. The 14-day Relative Strength Index (RSI) at 80.06 is overbought, signaling stretched momentum.
The AUD/USD pair could test the confluence resistance zone around the upper boundary of the ascending channel near the 0.6942, the highest level since February 2023. On the downside, the primary support lies at the nine-day EMA at 0.6800, aligned with the lower ascending channel boundary. A break below the channel would weaken the bullish bias and target the 50-day EMA of 0.6676.
Australian Dollar Price Today
The table below shows the percentage change of Australian Dollar (AUD) against listed major currencies today. Australian Dollar was the weakest against the Japanese Yen.
| USD | EUR | GBP | JPY | CAD | AUD | NZD | CHF | |
|---|---|---|---|---|---|---|---|---|
| USD | -0.44% | -0.29% | -1.12% | -0.13% | -0.41% | -0.34% | -0.67% | |
| EUR | 0.44% | 0.15% | -0.68% | 0.33% | 0.02% | 0.09% | -0.24% | |
| GBP | 0.29% | -0.15% | -0.80% | 0.16% | -0.13% | -0.07% | -0.39% | |
| JPY | 1.12% | 0.68% | 0.80% | 0.99% | 0.69% | 0.77% | 0.44% | |
| CAD | 0.13% | -0.33% | -0.16% | -0.99% | -0.29% | -0.21% | -0.55% | |
| AUD | 0.41% | -0.02% | 0.13% | -0.69% | 0.29% | 0.07% | -0.25% | |
| NZD | 0.34% | -0.09% | 0.07% | -0.77% | 0.21% | -0.07% | -0.33% | |
| CHF | 0.67% | 0.24% | 0.39% | -0.44% | 0.55% | 0.25% | 0.33% |
The heat map shows percentage changes of major currencies against each other. The base currency is picked from the left column, while the quote currency is picked from the top row. For example, if you pick the Australian Dollar from the left column and move along the horizontal line to the US Dollar, the percentage change displayed in the box will represent AUD (base)/USD (quote).
Tariffs FAQs
Tariffs are customs duties levied on certain merchandise imports or a category of products. Tariffs are designed to help local producers and manufacturers be more competitive in the market by providing a price advantage over similar goods that can be imported. Tariffs are widely used as tools of protectionism, along with trade barriers and import quotas.
Although tariffs and taxes both generate government revenue to fund public goods and services, they have several distinctions. Tariffs are prepaid at the port of entry, while taxes are paid at the time of purchase. Taxes are imposed on individual taxpayers and businesses, while tariffs are paid by importers.
There are two schools of thought among economists regarding the usage of tariffs. While some argue that tariffs are necessary to protect domestic industries and address trade imbalances, others see them as a harmful tool that could potentially drive prices higher over the long term and lead to a damaging trade war by encouraging tit-for-tat tariffs.
During the run-up to the presidential election in November 2024, Donald Trump made it clear that he intends to use tariffs to support the US economy and American producers. In 2024, Mexico, China and Canada accounted for 42% of total US imports. In this period, Mexico stood out as the top exporter with $466.6 billion, according to the US Census Bureau. Hence, Trump wants to focus on these three nations when imposing tariffs. He also plans to use the revenue generated through tariffs to lower personal income taxes.
추천 기사


