

AUD/USD Price Forecast: Overbought RSI flags pullback risk as uptrend holds
- AUD/USD trades near flat after easing back from a data-driven jump following Australian inflation figures.
- November CPI and trimmed mean inflation slowed but remained above the RBA’s 2–3% target range.
- The technical outlook stays bullish, with prices holding near 15-month highs despite overbought signals.
The Australian Dollar (AUD) trades flat against the US Dollar (USD) on Wednesday, with AUD/USD easing back after an initial advance triggered by Australia’s latest inflation data. At the time of writing, the pair is trading around 0.6738, holding near 15-month highs.
Australia inflation eased in November but remains above the RBA’s 2-3% target range. Data released earlier showed the monthly Consumer Price Index (CPI) was unchanged on the month after a flat reading in October. On an annual basis, CPI slowed to 3.4% in November from 3.8%.
The policy-relevant trimmed mean CPI rose 0.3% on the month in November, slowing from 0.4% in October, while the annual trimmed mean moderated to 3.2% from 3.3%.
AUD/USD saw a muted reaction to the latest US economic releases. The ADP Employment Change report showed private payrolls rose by 41K in December, below expectations of 47K, but reversing the previous month’s decline of 32K. Meanwhile, the ISM Services PMI surprised to the upside, rising to 54.4 in December from 52.6 and beating forecasts of 52.3.
JOLTS data showed job openings fell to 7.146 million in November from 7.449 million, undershooting expectations of 7.6 million.
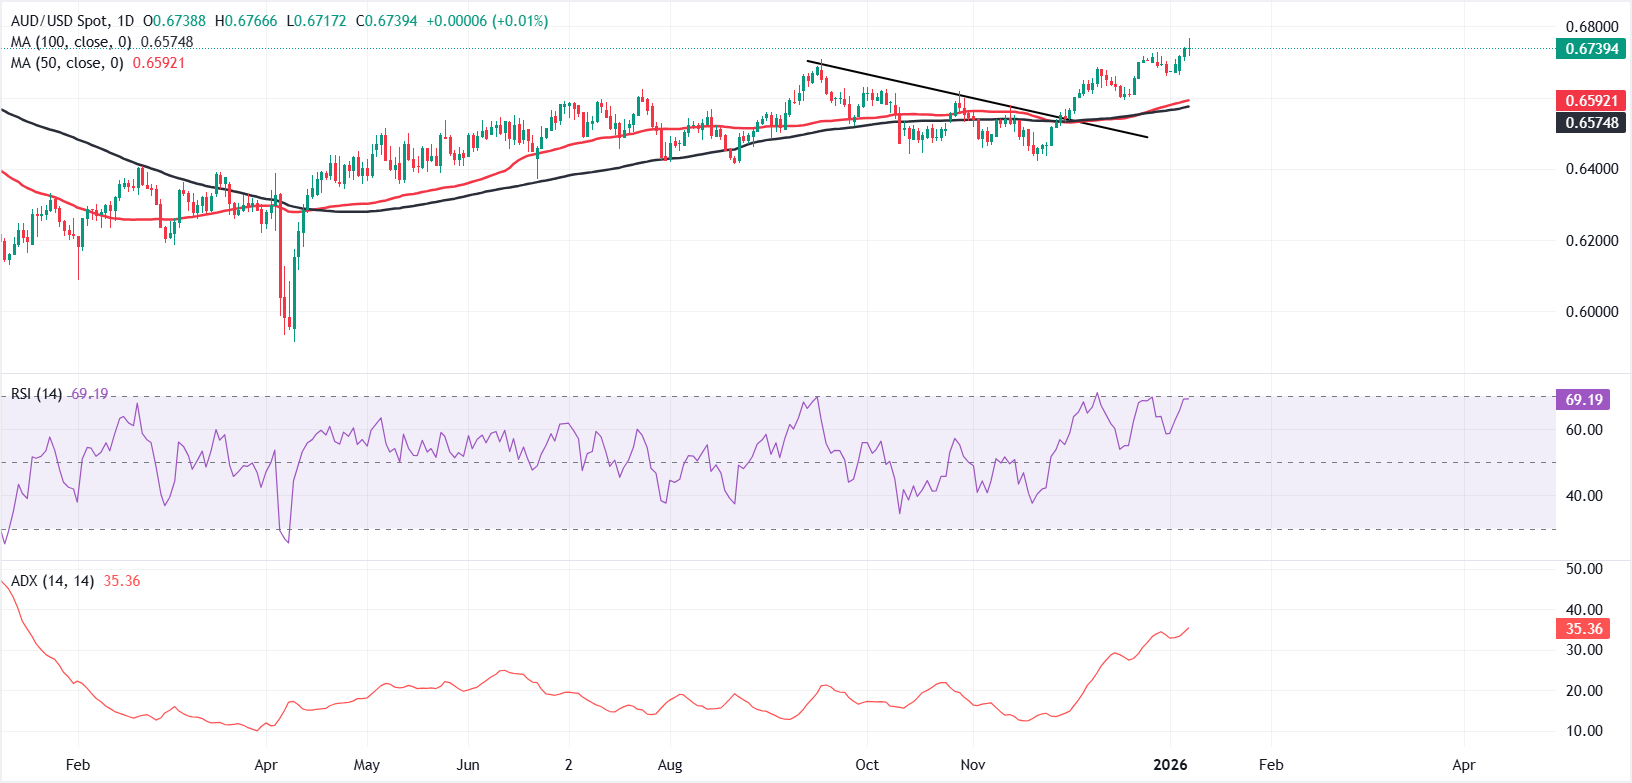
From a technical perspective, the Relative Strength Index (RSI) hovers near 69, approaching overbought territory and raising the risk of a near-term pullback. That said, the broader technical structure remains firmly bullish after a decisive break above the former trendline resistance near 0.6550, with prices holding well above the 50-day and 100-day Simple Moving Averages (SMAs).
If a pullback materialises, AUD/USD could find initial support near the 0.6660 area. A sustained break below this region would weaken the bullish structure and expose the 0.6590-0.6570 zone, where the 50-day and 100-day SMAs converge, making it a key technical support area.
The Average Directional Index (ADX) near 35.36 underscores strong trend strength. On the upside, a continuation of the uptrend could open the door toward the 0.6800 psychological level, with scope for a further extension toward the 2024 high above 0.6900.
US Dollar Price Today
The table below shows the percentage change of US Dollar (USD) against listed major currencies today. US Dollar was the strongest against the British Pound.
| USD | EUR | GBP | JPY | CAD | AUD | NZD | CHF | |
|---|---|---|---|---|---|---|---|---|
| USD | -0.09% | 0.02% | -0.09% | -0.04% | -0.00% | -0.10% | -0.01% | |
| EUR | 0.09% | 0.11% | -0.02% | 0.05% | 0.08% | -0.02% | 0.08% | |
| GBP | -0.02% | -0.11% | -0.13% | -0.06% | -0.03% | -0.13% | -0.03% | |
| JPY | 0.09% | 0.02% | 0.13% | 0.06% | 0.09% | -0.01% | 0.09% | |
| CAD | 0.04% | -0.05% | 0.06% | -0.06% | 0.03% | -0.07% | 0.03% | |
| AUD | 0.00% | -0.08% | 0.03% | -0.09% | -0.03% | -0.09% | 0.00% | |
| NZD | 0.10% | 0.02% | 0.13% | 0.01% | 0.07% | 0.09% | 0.10% | |
| CHF | 0.00% | -0.08% | 0.03% | -0.09% | -0.03% | -0.00% | -0.10% |
The heat map shows percentage changes of major currencies against each other. The base currency is picked from the left column, while the quote currency is picked from the top row. For example, if you pick the US Dollar from the left column and move along the horizontal line to the Japanese Yen, the percentage change displayed in the box will represent USD (base)/JPY (quote).
추천 기사


