

USD/CAD Price Forecast: Sees fresh downside below 1.3720
- USD/CAD ticks lower to near 1.3770 as the Canadian Dollar trades firmly.
- The USD Index trades flat ahead of the US CPI data for November.
- Investors expect the BoC to hold interest rates at their current levels in the near term.
The USD/CAD pair trades marginally lower around 1.3770 during the European trading session on Thursday. The Loonie pair ticks lower, while the US Dollar (USD) trades stably ahead of the United States (US) Consumer Price Index (CPI) data for November, indicating slight strength in the Canadian Dollar (CAD).
Canadian Dollar Price Today
The table below shows the percentage change of Canadian Dollar (CAD) against listed major currencies today. Canadian Dollar was the strongest against the New Zealand Dollar.
| USD | EUR | GBP | JPY | CAD | AUD | NZD | CHF | |
|---|---|---|---|---|---|---|---|---|
| USD | 0.05% | 0.05% | 0.12% | -0.07% | -0.07% | 0.19% | -0.02% | |
| EUR | -0.05% | -0.00% | 0.05% | -0.12% | -0.12% | 0.14% | -0.07% | |
| GBP | -0.05% | 0.00% | 0.06% | -0.13% | -0.12% | 0.14% | -0.08% | |
| JPY | -0.12% | -0.05% | -0.06% | -0.19% | -0.18% | 0.05% | -0.13% | |
| CAD | 0.07% | 0.12% | 0.13% | 0.19% | 0.00% | 0.24% | 0.05% | |
| AUD | 0.07% | 0.12% | 0.12% | 0.18% | -0.01% | 0.25% | 0.05% | |
| NZD | -0.19% | -0.14% | -0.14% | -0.05% | -0.24% | -0.25% | -0.21% | |
| CHF | 0.02% | 0.07% | 0.08% | 0.13% | -0.05% | -0.05% | 0.21% |
The heat map shows percentage changes of major currencies against each other. The base currency is picked from the left column, while the quote currency is picked from the top row. For example, if you pick the Canadian Dollar from the left column and move along the horizontal line to the US Dollar, the percentage change displayed in the box will represent CAD (base)/USD (quote).
At the time of writing, the US Dollar Index (DXY), which tracks the Greenback’s value against six major currencies, flattens around 98.40.
The US CPI report is expected to show that the headline inflation rose to 3.1% year-on-year (YoY) from 3% in October. In the same period, the core CPI – which excludes volatile food and energy items – is estimated to have risen at steadily by 3%.
Higher-than-projected US CPI data for November would weigh on Federal Reserve (Fed) dovish expectations, while soft numbers might boost them.
Meanwhile, the CAD outperforms on expectations that the Bank of Canada (BoC) will not cut interest rates in the near term.
USD/CAD Technical Analysis
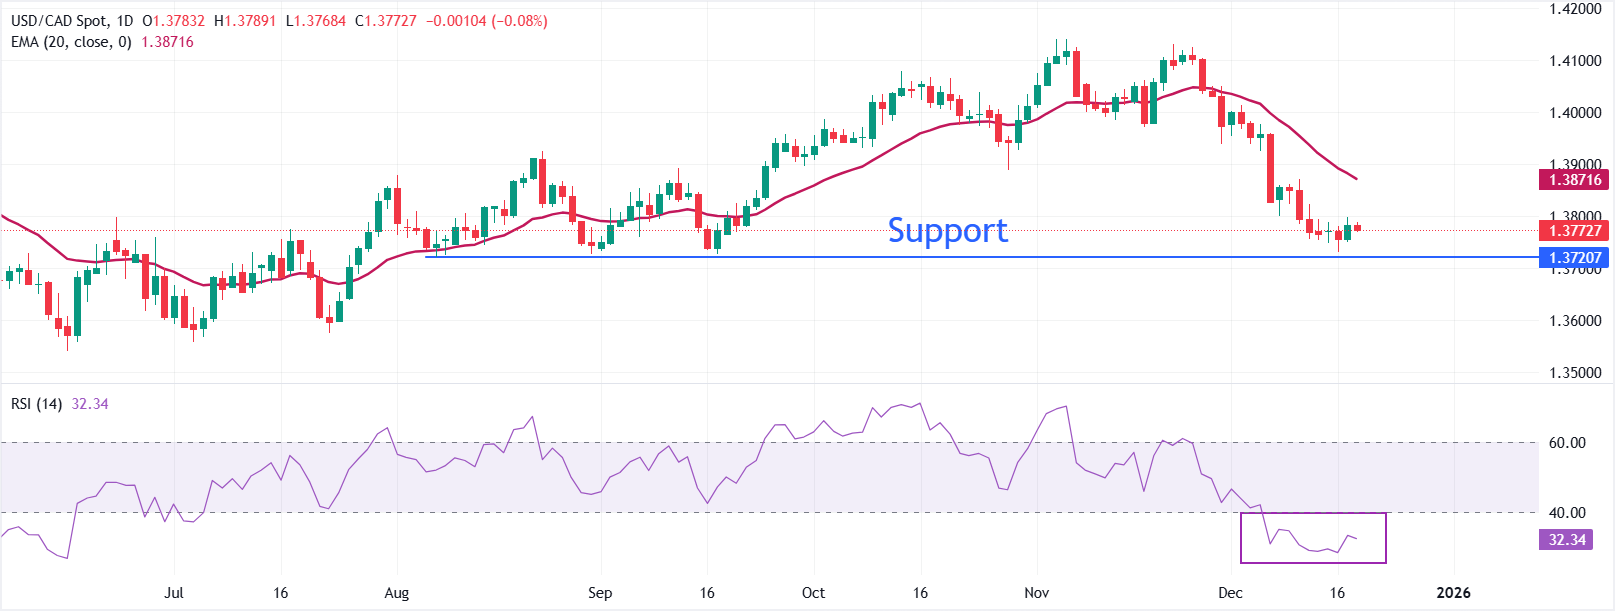
USD/CAD edges down to near 1.3775 on Thursday. The pair holds below the falling 20-day Exponential Moving Average (EMA) at 1.3872, keeping bears in control. The 20-day EM has rolled over for several sessions and continues to cap rebounds.
The 14-day Relative Strength Index (RSI) sits at 32.46, near oversold after a modest bounce from last week’s extremes, and momentum remains fragile.
A sustained recovery would require a daily close above the 20-day EMA to ease downside pressure that could increase the odds of an upside move towards the round-level figure of 1.3900. Until then, the downbeat setup persists and could strengthen if the spot breaks below the August 7 low of 1.3720.
(The technical analysis of this story was written with the help of an AI tool.)
US Dollar FAQs
The US Dollar (USD) is the official currency of the United States of America, and the ‘de facto’ currency of a significant number of other countries where it is found in circulation alongside local notes. It is the most heavily traded currency in the world, accounting for over 88% of all global foreign exchange turnover, or an average of $6.6 trillion in transactions per day, according to data from 2022. Following the second world war, the USD took over from the British Pound as the world’s reserve currency. For most of its history, the US Dollar was backed by Gold, until the Bretton Woods Agreement in 1971 when the Gold Standard went away.
The most important single factor impacting on the value of the US Dollar is monetary policy, which is shaped by the Federal Reserve (Fed). The Fed has two mandates: to achieve price stability (control inflation) and foster full employment. Its primary tool to achieve these two goals is by adjusting interest rates. When prices are rising too quickly and inflation is above the Fed’s 2% target, the Fed will raise rates, which helps the USD value. When inflation falls below 2% or the Unemployment Rate is too high, the Fed may lower interest rates, which weighs on the Greenback.
In extreme situations, the Federal Reserve can also print more Dollars and enact quantitative easing (QE). QE is the process by which the Fed substantially increases the flow of credit in a stuck financial system. It is a non-standard policy measure used when credit has dried up because banks will not lend to each other (out of the fear of counterparty default). It is a last resort when simply lowering interest rates is unlikely to achieve the necessary result. It was the Fed’s weapon of choice to combat the credit crunch that occurred during the Great Financial Crisis in 2008. It involves the Fed printing more Dollars and using them to buy US government bonds predominantly from financial institutions. QE usually leads to a weaker US Dollar.
Quantitative tightening (QT) is the reverse process whereby the Federal Reserve stops buying bonds from financial institutions and does not reinvest the principal from the bonds it holds maturing in new purchases. It is usually positive for the US Dollar.
추천 기사


